A Work Project, presented as part of the requirements for the Award of a Masters Degree in Finance from the NOVA – School of Business and Economics.
Exploring the Predictive Power of Google Searches over the US Stock
Market
João Guilherme Martins Borges Sàágua; Student Number 588
A Project carried out on the Financial Markets theme, under the supervision of: Professor Melissa Prado
Exploring the Predictive Power of Google Searches over the US Stock
Market
ABSTRACT
This paper takes search intensity for stock tickers in Google (SVI) as a
direct measure of retail investor attention and assesses whether it holds
predictive power over short-term market outcomes. In a sample of the most
representative US stocks, during the period 2005
–
2008, I provide
evidence that (1) surges of investor attention forecast higher stock liquidity
and volatility; (2) depending severely on what is considered an abnormal
level of SVI, retail investor attention can also be priced; and (3) SVI does
not relate to firm-specific features, such as size and value. Furthermore, I
extend the investigation to the aggregate market level, finding that investor
attention to the market index predicts greater market liquidity, volatility
and return.
Keywords
: Investor attention; Search data; Stock market predictability
I. Introduction
Timing the major stock market outcomes, such as liquidity, volatility and returns has been a true challenge to investors and researchers over decades. Yet, a significant portion of short-term market phenomena remains unexplained.
Asset pricing models assume the market is efficient at least at a semi-strong level, meaning that all the information is immediately incorporated into security prices, after being publicly released. In order for this assumption to hold there is a fundamental requirement: investors must pay attention to the assets.
Information and attention form an interesting couple, the first is useless without the second, but an overabundance of information will most likely reduce the attention being paid to it. In short and quoting Herbert Simon, “a wealth of information creates a poverty of attention”.
People’s attention can be seen as a resource, and as any other resource in an
economic environment, attention is also scarce. Hence, there is the need to be effectively attentive to the information available, which is mostly released in the form of news. What is more is that attention is time-varying, and following Andrei and Hasler (2012), investors’ attention oscillates in accordance with the state of economy. Hence,
attention fluctuations are usually between two extremes: either investors are very attentive to the financial and economic press, something that occurs mainly during downturns; or they almost disregard news, which is typically verified in a bullish phase. After establishing some of investors’ attention’s features, such as being a limited
psychological behaviour. Naturally, this last element is particularly hard to measure, however recent studies carried out by Da, Engelberg and Gao (2011); Joseph, Wintoki and Zhang (2011) among others, present a timely effective measure of investors’ attention, resorting to search frequency for companies’ ticker symbols in Google, the search engine leading by far the landscape of internet search, possessing, in July 2013, a 67% share of all the searches executed by web users worldwide1.
Since 2004, Google has been storing on its database the volume of searches for a certain word, expression or symbol, and making it available to public on a weekly basis, through a website called Google Trends (http://www.google.com/trends/).
A relevant link between investors’ psychological behaviour, hereby translated by intensity of online searches, and market movements is of major importance, especially, if data collected on web platforms turns out to hold some predictive power.
To corroborate this idea and show its usefulness Choi and Varian (2009) argued that “harnessing the collective intelligence of millions of users, Google web search logs
can provide one of the most timely, broad-reaching influenza monitoring systems available today”, in other words, this data that allegedly mirrors “what we collectively think” represents an important piece of information about “what might happen in the future” (Rangaswamy, Giles and Seres, 2009, p.58).
In fact, when people search for something somewhere, they are explicitly being attentive to it, which makes a query for a stock in Google, or in any other search engine, an unequivocal manifestation of attention.
As it is, to test whether the Search Volume Index (SVI) for tickers, as a direct measure of investor attention, indeed holds predictive power over stock market activity I use a sample of stocks included in the S&P 500 over the period 2005-2008, and SVI impact is in the first place assessed on liquidity.As a matter of fact, I find that rises in
1
levels of investor attention verified in a certain week predict a higher share turnover ratio in the following week.Provided that investor attention has a significant impact on liquidity, I assess its relation with stock returns volatility, expecting it to be positive. Consistently, I encounter an also dynamic relationship between investor attention and volatility of returns, with a surge in the former leading to an increase in the latter.
Moving forward in the analysis, I evaluate if SVI also encloses some price impact. I disclose that only abnormal levels of attention registered during the present week are capable of predicting higher returns in the subsequent week, being consistent with the attention-induced price pressure theory of Barber and Odean (2008). However, this result does not appear to be as strong as other papers present it, with the statistically significance of this interaction being substantially affected by the measure of abnormal SVI employed.
After acknowledging the main effects of investor attention a question of major relevance is worth raising. What type of investors own the attention being captured by ticker searches in Google? The answer – individual/less sophisticated investors – can be found only by following intuition. Logically, institutional investors benefit from an easy access to specific platforms providing extensive financial information as well as vast databases, such as Bloomberg and Reuters, which makes them unlikely users of Google for ticker searching. In contrast, retail investors, lacking those professional tools, resort to Google or other universal search engines to seek financial information. Da et al. (2011) deliver the formal proof for this fact.
Both yield the same results: size anomaly, value anomaly and momentum anomaly do not relate to retail investor attention. In addition, firm-specific characteristics, such as market capitalisation and Book-to-Market ratio do not establish any relevant connection with SVI. In this part of the study, I only provide some evidence for a price reversal after the positive returns earned when investors are quite attentive.
The final exercise revisits the above mentioned market outcomes, from an aggregate market perspective, reaching the surprising conclusions that the search volume for the term S&P500 has explanatory power over market liquidity, volatility of returns and fluctuations of the index quote.
Besides contributing as a robustness test to the results documented by similar studies, using a sample of the most salient and economic meaningful US stocks, and the most appropriate method for each analysis, according to Petersen (2005), this paper originally approaches the theme of anomalies, finding no relevant results, and successfully extends the findings found for individual stocks to the overall market. Throughout this investigation of investor attention, noise trading theories were corroborated.
The rest of the paper is structured as follows. Section II reviews the relevant literature on this topic. Section III describes the specificities of the data used. Section IV summarises the tested hypotheses as well as the methodology followed. Section V presents and thoroughly discusses the empirical findings. Section VI concludes reinforcing the importance of the behavioural component in the financial markets universe.
II. Literature Review
background, it relates to studies that deal with the implications of noise trading on the market. The two previous phenomena are intimately related.
Shleifer and Summers (1990) extensively study the noise trading issue, suggesting that retail investors, who are often less informed, tend to trade impulsively, basing their investments on noisy signals which they perceive as good opportunities to participate in the stock market. The aggregation of those signals generates sentiment. In the same market, wise and informed investors who ponder risk – arbitrageurs – co-exist. Their role is to explore securities’ mispricing, driving their price close to fundamentals. Yet, some misalignment between stock price and company’s intrinsic value tend to
subsist, indicating that noise traders not only influence the market, but also sometimes do it so intensely that they limit the action of risk-averse arbitrageurs. The reason why this is possible as well as its proof is provided by Barber, Odean and Zhu (2009a), who investigate sets of retail brokerage data and report high correlations between trades from individual investors, from which persistent psychological biases are identified. As a consequence, noise traders may or not be responsible for some well-known anomalies that have been alive over years, but, through investor sentiment, they are very likely in charge of temporary market events, such as extreme trading volumes, volatility shocks and significant security mispricing, as shown by Barber et al. (2009b).
Going back to the genesis of sentiment, to spot the signals, investors must have paid attention to financial assets.
The first research on investors’ cognitive sphere was done by Merton (1987),
pressure, supporting that retail investors in the presence of attention-grabbing events typically become net buyers, and provided that the supply of stocks is inelastic (at least in the short-run), an upwards price pressure is verified, leading to positive returns. They back-up this hypothesis with evidence from three attention-grabbing events: extreme trading volume, abnormal returns and news coverage.
Besides the above three, other proxies of investor attention exist, however all of them are indirect, since they rely on the assumption that when these events took place investors paid attention to them, a statement that does not always hold. In these circumstances, Da et al. (2011) propose a direct measure of investor attention, Search Volume Index (SVI) in Google for stock tickers, which not only reveals attention but also allows gauging its level.
Furthermore, to avoid the risk of using a variable that is intended to have a true and unique explanatory power over stock returns, but is no more than a proxy for other external events, such as news coverage, Da et al. (2011) demonstrate in their exercise that 95% of the variation in web search queries, occurs independently from the amount and type of economic and financial news, which are sporadic while SVI is continuous.
Da et al. (2011) depart from the work of Barber et al. (2008) and assert that SVI points out a buy decision for the asset being searched, as when investors intend to purchase a stock, they can choose from an immense universe of stocks, so they pick from the ones which called their attention, whereas when they consider selling a stock, they usually have available only the stocks they own, on which they should already possess a considerable amount of knowledge.
orders and trades across different market centres. Using Madoff as a representative centre for individual investors and NYSE as a typical centre for institutional investors, they reach the conclusion that abnormal levels of SVI consistently have a great impact on the first, while the second remains unaffected, confirming what intuition suggests: retail investors, less sophisticated and unlikely current users of professional finance platforms are the ones who utilise Google to acquire financial information about stocks.
Finally, using the sample of Russel 3000 stocks, they corroborate Barber et al. (2008) attention-induced price pressure, and also Barber et al. (2009) price reversal as a second consequence of noise trading. In this last case, Da et al. (2011) document that returns revert in approximately the same magnitude, within a year horizon.
In the same field, Joseph, Wintoki and Zhang (2011) triangulate these results within the S&P 500 sample, adding evidence for positive dynamic correlation between search intensity and trading volume. Taking a step forward they reach the striking result that SENT (their name for the SVI variable) is positively correlated with the market risk factor (Rm-Rf), following they find out that SENT correlations with Value (HML) and Momentum (UMD) are similar to the ones verified between these two variables and the market factor, which leads them to the conclusion that SENT can potentially mimic the market risk factor. Furthermore, when applying the Carhart model with the extra variable for search intensity to the empirical data, Joseph, Wintoki and Zhang (2011) realise that after controlling for all the four factors, SENT still possesses incremental information, suggesting that asset pricing models should take under consideration investors’ behaviour variables in an attempt to forecast stock returns.
Finally, Vlastakis and Markellos (2012) evaluate the impact of attention paid to the 30 largest NASDAQ companies’ names on the respective stock returns’ volatility.
using SVI and news. They find a high correlation between SVI and historical volatility and a lower, still statistically significant, relation with idiosyncratic implied volatility.
Dimpfl and Jank (2012) carry out a different analysis on the grounds of volatility and they find a strong co-movement of Dow Jones index volatility and retail investor attention, measured by SVI. Reporting Granger causality between the two realities, Dimpfl and Jank (2012) identify the following pattern: “a fundamental shock in
volatility triggers noise trading, which, in turn, leads to more volatility.”
III. Data
To quantify the main variable of interest of this study – investor attention – I use the Search Volume Index in Google for the stocks included in the main US stock index, the S&P 500. Concretely, this dataset is the one from the paper “Investor Information Demand: Evidence from Google Searches around Earnings Announcements” (2012),
which is freely provided by its authors Drake, Roulstone, and Thornock2.
Originally, these data have daily frequency and cover the period under analysis, ranging from the 1st of January 2005 to the 31st of December 2008. As this dissertation targets the disclosure of more comprehensive relations between aggregate queries for stocks on a universal search engine and broad market outcomes, there was a need to convert the data frequency to weekly. That was rigorously executed on Excel, resorting to pivot tables, which allow the conversion of daily data into weekly data, by taking its sum.
Furthermore, Drake et al. (2012) downloaded this data using the fixed scaling option, a feature that scales each SVI value according to a specific observation, the first one. This feature does not harm the interpretation of regression coefficients,
2 Source: http://byuaccounting.net/drake/ProgramsData1.php; The Search Volume Index data was not retrieved directly from
particularly, if they are in a logarithmical form the interpretation is done as usual, considering a 1% increase in the explanatory variable.
The companies’ stocks were identified in Google through their ticker symbols, rather than companies’ names or even companies’ most famous products or services.
The reasoning behind this choice relates to the fact that the relevant searches for the sake of this analysis are the ones that aim at investment purposes. Therefore, it was assumed that people would search for a stock ticker symbol in order to collect relevant financial information, which is quite useful when a limited amount of money can be allocated to a wide variety of stocks, diverging a lot in performance and fundamentals. Trying to capture investors’ attention by looking at search data on companies’ names or
most famous products would turn out to be inaccurate, not only because a company may be known by more than one name or because those names may have other meanings (Ex: Apple, Amazon) but also because people may search them on Google, the worldwide search engine leader, for various reasons other than investing. Hence, tickers, uniquely assigned symbols were chosen as the best signal of investor’s
attention, raising no ambiguities, except for the tickers that may have other meanings or even be confused with other acronyms, (Ex: AA, ABC, ZION, COST). Companies with this sort of noisy tickers or companies for which the stock ticker coincides with the name of the company itself (Ex: IBM) were eliminated from the sample, being consistent with the aim of capturing only the attention of potential investors.
already explained, Da et al. (2011) prove that “SVI indeed captures investor attention and is different from existing proxies of attention”.
Finally, as one of the goals of this paper is to provide a robustness test to previous studies, the variable accounting for abnormal levels of investor attention was constructed in multiple ways3.
Regarding the sample of stocks, in order to avoid survivorship bias, before applying filters, it comprises all the stocks that were ever included in the S&P 500, during the time span under analysis. As a matter of fact, there was a need to acknowledge the historical constituents of the referred index, information that was possible to access through Wharton Research Data Services website4.
After possessing all the company tickers, firm-specific characteristics and market data for individual stocks, the market index and the VIX index were retrieved from a Bloomberg terminal and Yahoo! Finance. Data on macroeconomic indicators was obtained from Trading Economics website5. Weekly Fama-French factors were obtained from Fama and French data library6. For the analysis at the aggregate market level, SVI for the term S&P500 was downloaded directly from Google Trends.
After all the previously mentioned necessary adjustments to guarantee the validity of the analyses, the two datasets (SVI and Market data) were merged and a final filter was applied: all the stocks that did not have both, a valid SVI (different from zero for more than 70% of the observations) and valid market data (complete time-series of return and trading volume), were excluded. Once this narrowing down process, which
3 Abnormal SVI is the difference between the SVI of each observation and: the median over the past 4 weeks; the
log-median over the past 6 weeks; the log-log-median over the past 8; the log-log-median of the whole sample. Abnormal SVI was also computed in the same way, but using log-averages instead of log-medians. Finally, for the returns analysis I also tried out variations in SVI. When nothing is specified, the Abnormal SVI variable being used corresponds to logSVIt- logmedian(SVIt-1,…SVIt-4)). 4https://wrds-web.wharton.upenn.edu/wrds/
5http://www.tradingeconomics.com/
manually goes through each individual stock, was completed, I attained the final sample, which is composed by 215 stocks.
As the stocks included in the S&P 500 are mostly liquid, there was no reason to worry about bid-ask bounce problems derailing the analysis of returns.
A final remark concerning winsorization of the variables ought to be made. Winsorizing the variables is a double-edged sword in this case. On the one hand, decreases or cancels the impact of extreme observations, potentiating a higher correlation between different realities. On the other hand, it forces the loss of a relationship of utmost interest, the relationship between abnormal values of SVI and abnormal values of return or volume. Thus, I decided not to winsorize the variables.
IV. Hypotheses development and Methodology
Building upon the work of Barber, Odean and Zhu (2009), which comprehensively investigates the impact of noise trading on asset pricing, and Barber and Odean (2008), which aims at explaining the triggers of noise trading, by studying attention-grabbing events, I develop a robustness test to the results posteriorly found in the related literature about retail investors’ attention, as measured by the intensity of
web searches for stock tickers in the worldwide leader search engine Google.
In that sense, in order to evaluate whether Google SVI possesses predictive power over main stock market outcomes, such as liquidity, volatility and returns, the following hypotheses are tested:
liquidity, using share turnover ratio, from a dynamic and contemporaneous perspective, assessing the impact of previous week SVI and current week SVI, respectively, on the current week share turnover ratio.
H2: Vlastakis and Marlellos (2012) present strong evidence that information demand, using web searches for companies’ name, helps explaining contemporaneous stock returns volatility, both historical and implied. On the same field, Dimpfl and Jank (2012) report Granger causality between web search queries for tickers and realised volatility. I evaluate whether unequivocal declarations of attention to individual stocks throughout the current and previous weeks predict changes in volatility, using a sample of S&P 500 firms.
H3: Da, Engleberg and Gao (2011) support that a rise in individual investor attention forecasts a significant price impact, generating short-term positive abnormal returns in the subsequent week. I test if this result holds in a lagged relationship and if it is also present within the current week. First, if SVI for individual stocks has a truly significant effect on stock returns, and if so, in which direction, constituting a robustness test not only to Da et al. (2011), Joseph et al. (2012), but also to the attention-induced price pressure of Barber and Odean (2008).
H4: If the results presented by Da et al. (2011) turn out to be corroborated by the empirical data, in an attempt to go a step further, I investigate whether retail investors’
attention may be related to some well-known anomalies, such as the Size anomaly, the Value anomaly and the Momentum anomaly.
To conduct these analyses, whenever pertinent, I start by tabulating the data with the goal of providing a first insight to stock features and sample descriptive statistics. A formal econometrical analysis follows. To rigorously study the impacts of investors’ attention on stocks, I resort to panel regressions with fixed-effects, an extension of the classical linear model, which enables obtaining unbiased estimators, by controlling for unobservable confounding factors that vary across units (stocks) but are constant over time, for instance industry or firm-specific effects. To ensure the validity of inference, the standard errors computed are robust to heteroskedasticity (White standard errors) and also clustered by units, accounting for a possible presence of correlation in the residuals within each firm. I also use Fama-Macbeth panel regressions7, whose standard errors address the time possible time correlation in the residuals.
A remark concerning the decision rule for the usage of the above mentioned regressions ought to be made. When a firm-effect is present, fixed-effects panel regressions with robust clustered standard errors are implemented. Conversely, when a time-effect is encountered, Fama-Macbeth is the correct choice.8
Finally, to predict the variance of returns, whenever possible, GARCH (1,1) model – the standard tool to estimate stock returns volatility, introduced by Bollerslev (1986) – is used. Briefly, the GARCH (1,1) maximum-likelihood (or quasi-maximum likelihood) estimation suggests that the best forecast for the variance of stock returns is a weighted average of the most recent variance registered and the information contained in the most recent squared residual.
7 Created by Fama and Macbeth (1973), this econometrical method, for panel data, determines the risk-premium of each risk factor
in a two-step procedure: first, it carries out time-series regressions, regressing the returns of each stock against the proposed risk factor determining the Beta’s of each asset in relation to that risk factor; second, it runs cross-sectional regressions having the returns of each stock as dependent variable and the previously calculated Beta’s as the independent ones, to finally get the risk-premium for each risk-factor, originally called Gamma by Fama and Macbeth (1973).
8 Petersen (2005) provides a useful discussion as it comes to which model is the most appropriate to be used in different contexts.
V. Empirical Findings
V.1 Data Framing – Stock features and descriptive statistics
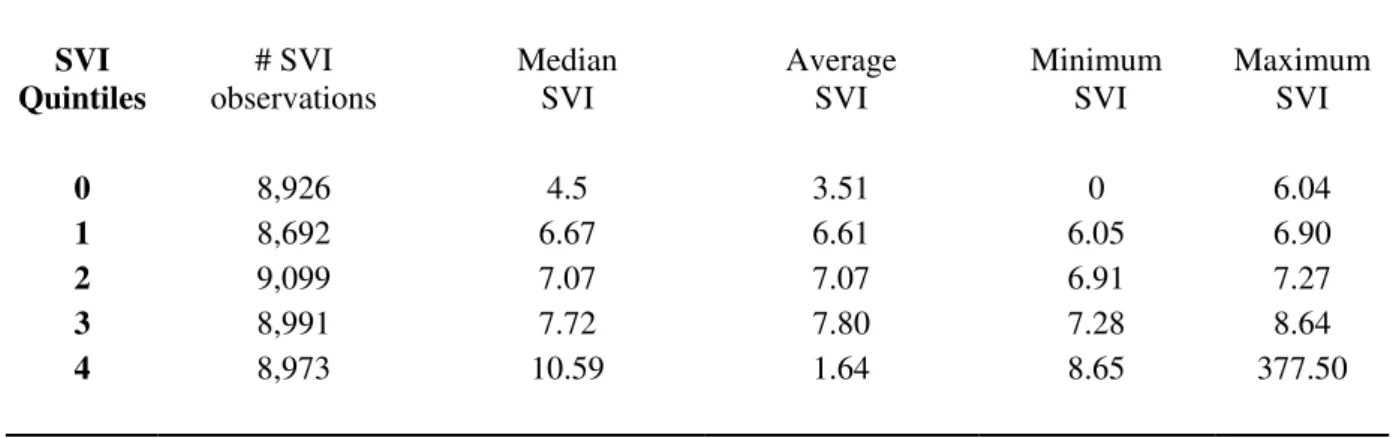
In this first subsection, I provide a broad overview of the general characteristics and descriptive statistics of the 215 S&P500 stocks included in the sample. In order to do so, the sample was sorted by date, and within this first arrangement, quintiles were formed in accordance to the attention level paid to the individual stocks (Table 1).
Table 2 contains the statistics for both market events and firm-specific features for the five weekly portfolios formed on the basis of SVI9.
Starting off with liquidity, it is clearly visible that the portfolio registering the top levels of investors’ attention comprises the mostly traded stocks. H1 seems to be
corroborated by this simple first approach, as even though for the other quintiles volume and turnover fluctuate around the same values, it is possible to notice a rising tendency as we move from lower to upper quintiles, suggesting a positive interaction between investors’ attention and liquidity.
Along with increased liquidity, it is likely to come more volatility. In fact, this preliminary approach to the data suggests that. Similarly to liquidity, significantly greater volatility registered over the past 30 days is observable on the portfolio receiving the highest investor attention, whereas in the remaining quintiles a smooth upward trend can be identified, which may be related to retail investor attention.
Moving to stock returns, the existence of a pattern is not as obvious as before, yet there seems to be a rising tendency as we move from the lowest to the highest SVI quintiles. However, by looking at the portfolio receiving the largest attention, a sudden break in the tendency is detected, as returns drop sharply compared to the previous portfolio. Basically, this fact points out that the most searched stocks were the ones
9 Table 1 provides both statistics, median and mean. The preliminary conclusions drawn are valid regardless the measure chosen, as
performing worst, something that, at first sight, appears to contradict the positive correlation between abnormal levels of SVI and abnormal levels of returns documented by Da et al. (2011) and by Joseph et al. (2012).
Even so, it is interesting to perceive that the 4th quartile encloses the best performers and that, when the impact of outliers is mitigated, there appears to be a positive correlation between SVI and investors’ attention up to the 4th quartile, including, which also disputes one main finding from Merton (1987), who supports that stocks enjoying low visibility usually perform slightly better than more visible peers.
Naturally, no rigorous conclusion can be drawn at this stage, however the empirical data may suggest that stocks benefit from visibility up to some point, after which too much attention leads to abnormal trading and, in turn, abnormal trading leads to volatility spikes, which can jeopardise returns. The addition of a higher risk likely prompts a sell-off decision for an average individual investor, risk-averse by nature, generating price falls. It is worth to stress that this simply theorised, and not yet formally proven, relation of retail investor attention, volatility and return, does not concern systematic volatility but instead some source of idiosyncratic volatility, as documented by Ang, Hodrick, Xing and Zhang (2006). In the present situation, this idiosyncratic volatility may be generated by a too large level of individual investors’ attention, which ends up penalising stock ownership by reducing stock returns.
Table 2 indicates that, roughly speaking, the larger companies are, the more attention is paid to them. As for the Book-to-Market ratio, it is possible to observe that on the two extreme quintiles, the one with the lowest SVI and the one with the highest SVI, we find the most overvalued stocks, i.e. the stocks with the lowest BTM. This overvaluation can be a possible explanation for the most negative returns earned by these two portfolios. Taking the two together, it is possible to extrapolate a possible link with retail investor attention. This data points out that the lowest attention-grabbing firms are the smallest ones, while the mostly searched stocks are the largest. In this scenario, a potential behavioural bias of individual investors can be considered: investors pay greater attention to big capitalisation stocks, as they are more often mentioned in the press and noticing a considerable overvaluation, they tend to get rid of them, generating the negative returns. On the other side, retail investors are not that attentive to smaller firms. Especially, if they appear to be extremely overvalued compared to other public firms, hardly they will consider a purchase. The higher P/E ratio figures for these two quintiles corroborate the noticeable overvaluation.
By looking at the average past return earned in each portfolio, it is visible that the lowest past returns are registered on the highest SVI quintile, which may suggest that retail investors’ common behaviour may lead to the persistency of negative returns,
through the following mechanism: in the first place investors’ attention is caught by extreme negative returns, as such they search them on Google, verifying their overvaluation and bad performance, preceding a sell-off decision that contributes to intensify the negativity of returns.
It is important to reinforce that all the hypotheses described in this subsection have no rigorous proof. They are exclusively grounded on the interpretation of descriptive tables using finance intuition. Throughout the next subsections, a thorough formal analysis will be conducted.
V.2 The effect of retail investor attention on stock’s liquidity
In this subsection, I examine the potential link between the intensity of search queries on Google for stock tickers and stocks’ liquidity by carrying out a set of analyses using panel regressions with fixed effects, and computing robust standard errors clustered by firm.
Before describing the procedure followed, it is relevant to establish the distinction between trading volume and share turnover ratio, which made me opt for the latter to conduct this investigation. In their essence, both are liquidity measures. However, while trading volume is a raw liquidity metric which simply counts the amount of shares of stock that were bought and sold over a certain time span; share turnover compares that same volume traded to the total number of shares outstanding during the same time period through a ratio. Its use, as opposed to trading volume, enables a more accurate interpretation of stock’s liquidity, particularly when there is a large difference between the number of shares outstanding across different companies.
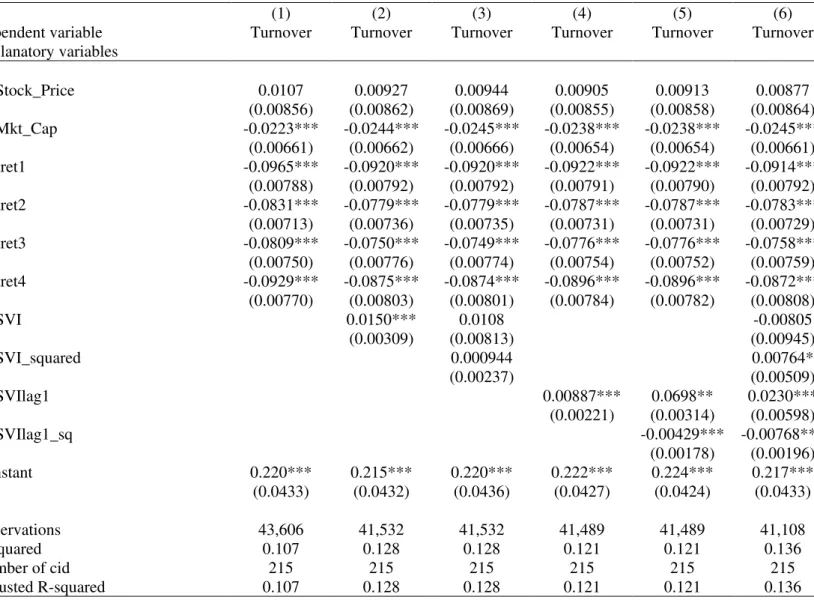
As a matter of fact, and since the results obtained were pretty much the same for both liquidity measures, the focus of this analysis will be on turnover, whose results are shown in Table 3.
past returns up to the fourth lag. Naturally, transaction costs, such as brokerage commissions, would be a relevant variable to account for, however as the stocks in the sample are stocks from the S&P 500, they should all be liquid enough to consider the bid-ask spread negligible; and brokerage fees are impossible to control as there is no data reporting which broker made the deal.
All control variables turned out to be significant except for contemporaneous stock price, possibly because it corresponds only to the closing stock price of the week, and the R2 of this model was 10.7%. Following, the contemporaneous SVI in logarithmical form was introduced as explanatory variable and its impact on turnover appears to be positive and statistically significant at 1%, presenting the first piece of evidence for the existence of a true interaction between investors’ attention and stocks
liquidity. In order to account for non-linearity in this relationship, a quadratic term – logarithmical SVI squared – was added to the equation. Apparently, the solely linear relation between SVI and turnover was overestimating the effect of the former on the latter, a fact demonstrated by the negative coefficient associated with the non-linear SVI term, which is statistically significant at 1%.
Finally, Joseph et al. (2011) document a slightly different relationship between search volume and stock liquidity, measured by trading volume. In their study, they find a dynamic interaction, through which abnormal SVI levels registered in a certain week predict a higher trading volume in the following week. Motivated by their findings, two lagged variables of SVI, both linear and quadratic, were included in the equation:
∑ (1)
contemporaneous relationship10. Instead, it supports that the interaction between retail investor attention and liquidity is dynamic corroborating what was found by Joseph et al. (2012). Furthermore, it is also non-linear and as such the impact of SVI on turnover can be interpreted as follows: SVI indeed leads an increase in turnover, however its impact is decreasing in magnitude. Numerically, ceteris paribus, on average, a 1% increase in SVI registered during the current week forecasts a 0.01532% rise in share turnover ratio during the following week.
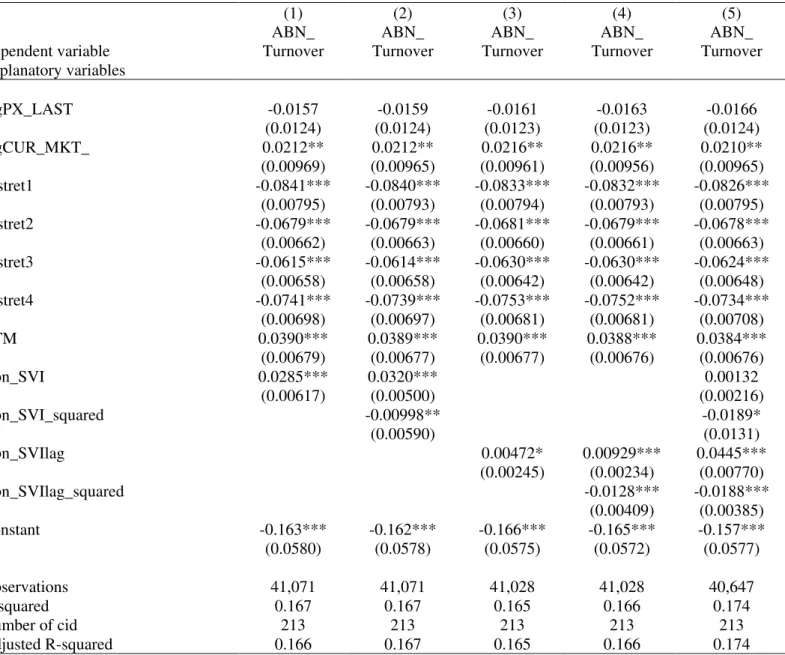
Once the relationship between retail investor attention levels and liquidity, measured through turnover was established, it is relevant to assess a more specific connection between abnormal levels of attention and abnormal turnover, the only one reported by Joseph et al (2011). The determination of abnormal turnover requires abnormal trading volume, which was computed as in Joseph et al. (2012): the difference between the trading volume of each week and the average weekly volume over the whole sample period. Then, to calculate the abnormal share turnover ratio, it suffices to divide abnormal trading volume by the total amount of shares outstanding. The main variable of interest, abnormal SVI, is computed as described in the data section.
The methodology followed to investigate the existence of an interaction between abnormal SVI and abnormal turnover was the same as before. Firstly, I implemented a model to explain abnormal turnover with the usual control variables and an additional one, BTM, a dummy variable that takes the value 1 when the Book-to-market ratio is equal or below 0.35, a threshold arbitrarily established in accordance with the descriptive statistics presented in the previous subsection; and 0 otherwise. The rationale behind this binary variable is that when the Book-to-Market ratio drops to values that indicate an exaggerated overvaluation, investors are affected by an irrational
10 Only the non-linear term remained significant, however only at a 10% level. Hence, I considered its impact negligible. However,
behavioural bias, called disposition effect, extensively explained by Barberis and Xiong (2009), prompting the sale of winners and the holding of losers, related to the fact that investors prefer to recognise gains too early than to realise losses. In this case, I assume that the disposition effect leads to an abnormal trading volume. The coefficient associated to this variable is positive as expected and is statistically significant at 1%.
Once this model was set up, abnormal SVI variables were added to the equation similarly to what was done before. At a first stage, only the linear and contemporaneous abnormal SVI but then the non-linear term as well. Likewise the previous analysis, both turned out to be statistical significant. The results are available in Table 4.
Being consistent with the earlier finding about a lagged interaction between investors’ attention and turnover, the 1-week lag of the abnormal SVI was introduced in
the regression, yielding the final model:
∑ (2)
Just as before, this model, whose goodness of fit equals 17.4%, suggests a strong dynamic relationship between abnormal SVI levels and abnormal turnover11, and no significant contemporaneous relationship. Specifically, a 1% increase in current week abnormal SVI predicts an average rise of 0.0257% in abnormal turnover during the subsequent week.
All in all, conversely to what was initially found in the first step of the analyses, only in a dynamic relationship, retail investor attention, on both normal and extreme levels, captured via volume of searches in Google for stock tickers exercises explanatory power over stock’s normal and abnormal liquidity, hereby measured by
share turnover ratio and abnormal share turnover ratio, respectively. The bottom line conclusion is that when individual investors search stocks intensely on Google, they are
11 The results obtained for the interaction between abnormal levels of retail investor attention and abnormal turnover are robust
considering an investment decision which, in some cases, will indeed occur in the following week, affecting liquidity expressively. These results are in line with the work of Barber et al. (2009), Barber and Odean (2008) and Seasholes and Wu (2007) as it comes to a significant interaction between individual investors’ attention and trading
volume. They also triangulate the findings of Joseph et al. (2012), using a more accurate measure of liquidity and resorting to the most appropriate model, fixed-effects with robust clustered standard errors. Furthermore, I show that not only abnormal levels of attention interact with stock liquidity, but also normal levels, i.e. the weekly amount of Google searches per se. Still, the impact of the former is greater than the impact of the latter.
V.3 Retail investor attention and historical volatility of stock returns
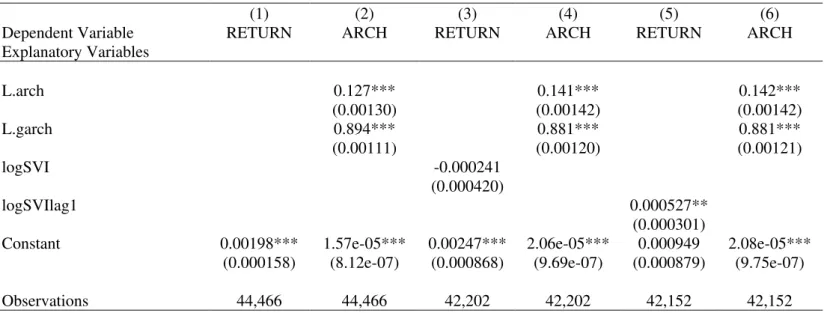
In order to do so, I started by implementing a GARCH (1,1) model, which aimed at explaining volatility using the two usual variables (past variance and past squared residual) as well as an exogenous variable: retail investor attention – SVI. Unluckily, this model yielded a non-stationary process for the variance, meaning that I am facing an explosive GARCH (α+β > 1) from which nothing can be validly concluded, according to Francq and Zakoian (2008). Table 5 contains the model results.12
Therefore, I was forced to use a sub-optimal model to approach the estimation of volatility. I chose the panel regression with fixed-effects and robust clustered standard errors. This model is very likely to contain measurement error, so I recognise it as a limitation of this analysis, however as shown by Islam et al. (2012), who compare various volatility estimates from several models, reaching the conclusion that statistical significance of the coefficients as well as their direction tend to remain unchanged across most of them, including OLS and GARCH.
Nevertheless, care must be taken when linearly estimating volatility. Past volatility cannot be included in the sample, however a proxy for it can. Hence, as a control variable, I include in the model 1-week lagged VIX return. From a wide variety of factors, ranging from geopolitical and systemic issues to market and firm-specific events, which are said to affect volatility of returns; I picked macroeconomic aspects (monthly industrial production growth), interest rates (weekly return of the risk-free asset), market outcomes for each firm (volume traded and past return), firm-specific events (a Bloomberg estimate for 1-year dividend growth), to use as other control variables. The dependent variable is volatility over the last 30 days and the results are available in Table 6.
12
Keeping consistency with what was done before, the first step of the procedure consisted in setting up a model to explain volatility, containing the aforementioned control variables. This model achieved a R2 of about 46%, with all variables being statistically significant, except for dividend growth13. Following, the contemporaneous logarithmic SVI variable, accounting for the effect of retail investors’ attention, was
included in the model. This variable as well as its quadratic term appeared to be statistical insignificant, indicating no relation between retail investor attention and volatility. Motivated by the work of Dimpfl and Jank (2012) who find Granger causality between investors’ attention and stock returns volatility in a dynamic relationship, lags
of the SVI variable were added to the model up to the lag of 4th order, covering approximately the previous 30 days for which volatility was registered. The resultant final equation is as follows:
∑ ∑ (3)
Interestingly, as lags of SVI were added to the equation, the more recent SVI variables (except the contemporaneous) verified a gain in significance, with all lags being statistically significant at 1% confidence level in the final model, summarised in column (7) of Table 6. The correlation between SVI and volatility appears to be clearly positive, for instance when the SVI registered in previous week increases by 1%, there is, on average an increase of 0.0235% in volatility during the following week, holding all other things constant. Furthermore, the irrelevant contemporaneous relation indicates that there is a one week delay between the search in Google and the subsequent investment made by retail investors.
13 As dividend growth is a variable for which a lot of observations are missing and it is also a highly insignificant variable, in
These results14 provide strong evidence that a higher level of retail investor attention leads to increases in volatility, a fact that not only substantiates the preliminary hypothesis presented in the first subsection, but is also consistent with the augment of trading volume driven by a greater intensity of search queries for stock tickers in Google. In fact, the surge in trading volume verified when investors are more attentive to individual stocks appears as the main intermediary of this link between SVI and volatility, making it relevant to revisit the noise trading theme.
In accordance to Barber et al. (2009), retail investors trade impulsively upon noisy signals, disturbing security prices’ stability, introducing a higher level of risk,
hereby translated into rise in idiosyncratic volatility. Hence, the findings for volatility gathered with the results obtained for liquidity, using SVI as a timely attention measure, support the consequences of noise trading at the individual asset level.
This result suggests that the inclusion of a time-effective measure of investors’ attention in models aiming to forecast stock returns volatility can improve their predictive power. Undoubtedly, an augmented estimating potential is always a good thing in itself, but the applicability of this result has its major value during bearish phases, periods not only characterised by high turbulence in the markets, when firms fundamental value is very often camouflaged, but also known as periods of especially high investor attention (see Andrei and Hasler (2012)). Consequently, the relation between retail investors’ attention and volatility is believed to be strengthened during
downturns, with SVI explanatory power being boosted.
Regarding the work of Vlastakis and Markellos (2012), who extensively study the relation between information demand and stock market volatility in a sample of the 30 largest NASDAQ stocks, this result corroborates their findings using a different
14 The results obtained for abnormal levels of investor attention are somehow in line with these findings for normal levels;
approach, a different and broader sample and also a different concept for the search terms of interest: stock tickers instead of companies’ names.
In addition, Baker and Wurgler (2007) posit that a good proxy for the difficulty of arbitrage of a stock is volatility of returns. Matching this result with Baker and Wurgler (2007) evidence, it is plausible to argue that, since more retail attention leads to higher volatility of stock returns, stocks which are often on the spotlight of retail investors, typically noise traders, are harder to arbitrage than stocks whose visibility is lower.
V.4 Is retail investor attention a predictor of stock returns?
Once the influence of retail investor attention on liquidity and volatility is determined, it interests a lot to assess whether investors’ attention, as measured by SVI,
has some price impact on the individual stocks level.
While Drake, Roulstone and Thornock (2012) document surges in information demand around the specific event of earnings announcement, leading, on average to higher returns, Da et. al (2011), Joseph et al. (2012) and Zhang et al. (2013) among others, report a broader effect of investors’ attention, not specifically related to a
particular event: when the volume of searches for stock tickers in Google and other search engines is abnormal in a certain week, on average, in the subsequent week abnormal positive returns are verified. This is where the true robustness test takes form as this is, intuitively, the less obvious effect of SVI.
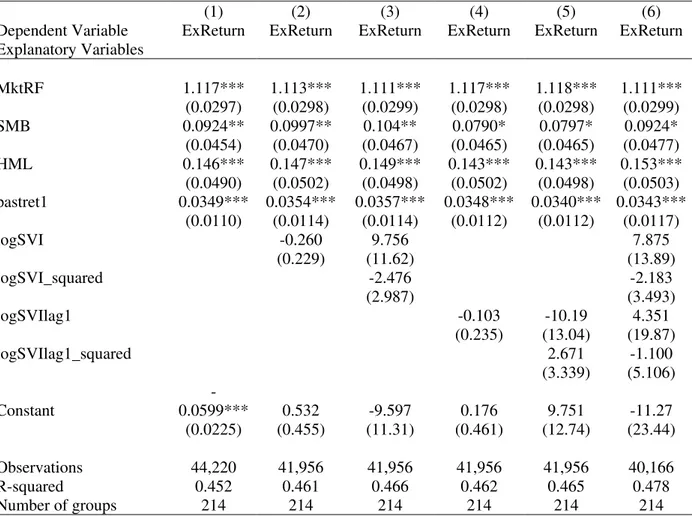
inclusion of the logarithmical SVI as a risk factor. Besides the latter, the independent variables used are the weekly Fama-French factors and the stock returns earned in the previous week, as a proxy for momentum15, given that there is no weekly momentum factor available in the online research databases.
The replicated four-factor model, whose dependent variable is excess return over the risk-free was fairly successful at explaining the returns of the 215 S&P500 stocks included in the sample, achieving a R2 of 45%. Following, the contemporaneous logarithmic form of SVI was included in the model as well as the respective quadratic term, but their coefficients turned out to be statistically insignificant. However, the documented interaction between investors’ attention and returns is rather dynamic. Thus, the linear and non-linear variables were added to the equation, being both statistically insignificant. Table 7 presents the empirical results.
This first approach that intended to explore the predictive power of SVI on stock returns, from a broad asset pricing perspective, yielded no statistical evidence for a general relation between normal levels of SVI and risk adjusted returns.
Yet, the hypothesis that even though usual levels of SVI do not exercise any explanatory power over excess stock returns, abnormal levels of retail investor attention are capable of leading abnormal returns, ought to be tested. Actually, this is the relation for which strong evidence is found in the aforementioned literature.
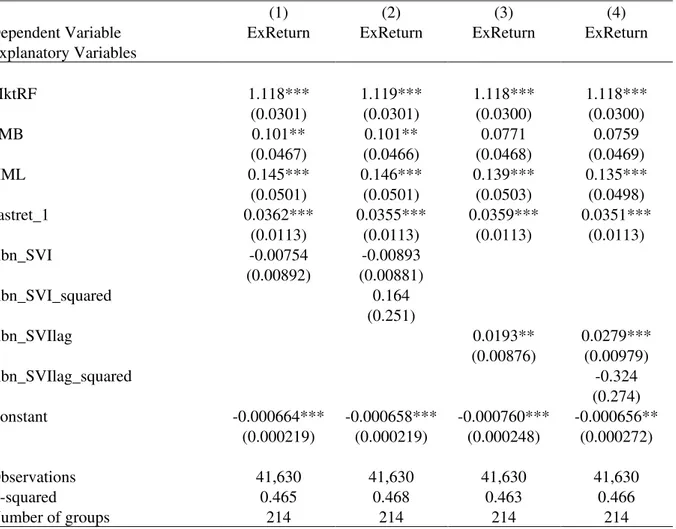
To evaluate whether this interaction applies in this sample of stocks during the time period under analysis, again using an inverse Fama-Macbeth regression the four-factor model was set up and abnormal investor attention variables were added to the specification. Being consistent with previous approach, first contemporaneous abnormal
15 Usually momentum takes under consideration a much larger time span, however, in this case, what interests is a very short-term
SVI, which turned out to be all statistical insignificant and, then, one-week lagged variables reaching the following final model:
(4)
The output of this model is available in Table 8. Indeed, I find that abnormal levels of retail investor attention in the current week have a statistically and economically significant stock price effect in following week, even after the four-factor risk adjustment. The empirical evidence points out an exclusively linear relationship, which can be interpreted as follows: ceteris paribus, a 1% increase in abnormal SVI during a certain week leads to an average 0.0279% increase in the following week stock return, equivalent to a 1.46% rise in annual return.
This finding does not completely corroborate the results obtained by Da et al. (2011), who also find a negative non-linear relationship, suggesting that even though there is a linear augment in price, it decreases in magnitude after a certain point. Nevertheless, it is absolutely in line with the fundamental theory of attention-induced price pressure documented by Barber and Odean (2008), through which retail investors become net buyers of stocks that catch their attention, leading to a temporary increase in stock price, which takes place in the subsequent week.
observation and the median over the past 8 weeks, in this case there is still a positive linear interaction, though weakly significant: only at a 10% confidence level.
Summing up, first of all it is worth emphasising that the fact that the dynamic relationship between abnormal retail investor attention and abnormal stock returns, does not hold for all the abnormal SVI measures does not mean that it does not exist at all in general terms, it suggests that it may not be as strong and certain as other papers, which use the same measure for investor attention, report. Specifically, regarding the work of Da et al. (2011), I use a similar approach, but a different sample. In my case, the stocks under analysis are included in the main US market index, the S&P 500, an index with which various exchanges worldwide are correlated. Therefore, I would expect to see at least the same results holding in this case, provided that these are salient stocks, the US largest caps and the most meaningful firms, from an economical perspective. Another difference should be highlighted: Da et al. (2011) use DGTW returns, while I use Carhart four-factor model risk-adjusted returns. In what concerns the work of Joseph et al. (2012), I use the same sample, but with significantly less stocks, imposing a much stricter filter in order to eliminate as much noise as possible as well as invalid SVI observations, a fact that narrows down my sample to 215 stocks, and likely, I also use a different method, the more appropriate one according to Petersen (2005). Actually, Joseph et al. (2011) do not specify exactly which type of regressions and standard errors they use, they simply mention “run regressions” and “consistent with heteroskedasticity standard errors”.
Finally, Barber et al. (2005) and Barber and Odean (2008) theories about noise trading and investor attention are not refuted or weakened. First, as Seasholes and Wu (2007) argue not all “attention-grabbing events lead to predictable behaviour”, so search
power and on top of that, it is not exactly an attention-grabbing event per se but a possible, however not necessary, consequence of one. SVI is rather a declaration of attention.
V.5 Retail investor attention and anomalies: A short history of big failures
In this field of special attractiveness to investors, Da et al. (2011) show that the increase in return that occurs in the week succeeding an outbreak in SVI is merely temporary, observing a price reversal after the second week, which is prolonged thereafter until the positive effect is more or less annulated, holding all other things constant. Since under specific circumstances I also found a statistically significant relationship between retail investor attention and stock returns, in order to go a step further, I assess whether investor attention may constitute a possible explanation to some other well-known market anomalies, such as the size anomaly, the value anomaly and momentum anomaly, or if, at least, investor attention somehow relates to firm-specific features and firm-firm-specific events.
This investigation faces some limitations. As it comes to size, the sample includes S&P 500 stocks, thus no small capitalisation firms can be found, however it is still possible to conduct the analysis in relative terms, determining within large caps which are bigger and which are smaller. Regarding value, as shown in the first subsection, the majority of the companies present an overvaluation, hence a markedly distinction between value and growth stocks is impossible. Nevertheless, it is possible to compare within overvalued BTM ratios, identifying which of them are more overvalued or and which are closer to equity’s book value. Finally, in the momentum
assumption that investors are timely attentive, therefore a declaration of attention, through a web search in Google, occurs soon after the attention-grabbing event.
To gauge a possible relation between retail investor attention, as measured by SVI, and firm-specific characteristics and events, two methods were put in place. The first, a simple intuitive analysis consisted in weekly sorting the stocks according to the aforementioned factors, forming quintiles and deciles portfolios.
This naïve approach shown in Table 10 aimed at identifying possible patterns of SVI and returns across portfolios based on size, value and past returns.
In size portfolios, an upward trend in returns and in SVI seems to be present, however both are not monotonic, registering some significant breaks when deciles are analysed. If this relationship between retail investor attention and market capitalisation would exist, larger caps would perform smaller caps, contradicting any link between retail investor attention and the size anomaly.
Looking at portfolios based on BTM, no pattern is identifiable in SVI, whereas a downward trend is present in returns, as stocks’ market prices approach their book
equity value. From this analysis, no strong connection can be established between retail investor attention and the value anomaly. Nevertheless, it is observable that the most overvalued stocks, registered both the highest returns and very high SVI levels.
Finally for momentum portfolios, there may be some extreme positive returns leading higher retail investor attention, consistent with Barber and Odean (2008) theory of attention-grabbing events; nonetheless, it appears that the best performers of one week become the worst performers in the following suggesting the presence of the price reversal in this sample, similar to what Da et al. (2011) find for the Russel 3000 stocks.
using a set of fixed-effect panel regressions and robust standard errors clustered by company, as a firm-effect seems to be present. I study the impact of investor attention on two different dependent variables: Jensen’s alpha from the Carhart model and Jensen’s alpha risk-adjusted for the market and individual stocks’ characteristics.16 The
explanatory variables are: one week lagged abnormal SVI, the factor under analysis and an interaction variable of these two variables.
Table 11 shows that there is no relation between abnormal levels of investor attention and firm’s market capitalisation, given the fact that not even a single
interaction variable turned out to be significant.
Table 12 reports the results for the value factor. Similarly to what happened with size, no link was found between retail investor attention and the Book-to-Market ratio.
Considering Table 13, despite weakly significant (only at a 10% confidence level) some interaction variables suggest a relation between retail investor attention and past returns. The negative coefficient associated to these variables indicates price reversals rather than persistency in returns after peaks of investor attention.
On the whole, this analysis whose goal was to find possible explanations for the size anomaly, the value anomaly and the momentum anomaly via retail investor attention, ended up being very conclusive: in this sample of stocks, SVI does not relate to any of the mentioned anomalies17. In contrast, there is some evidence supporting price reversals after the positive price pressure generated by boosts of search volume for stock tickers in Google.
16Jensen’s alpha from the Carhart model was computed by calculating the difference between the realised return and the one
estimated with the betas of the four-factor model from the previous subsection. Jensen’s alpha adjusted was estimated by computing the difference between the realised return and the return estimated using betas from a fixed-effect panel regression model with robust and clustered standard errors, whose explanatory variables were: market risk premium, firm’s market cap, firm’s BTM and firm’s past weekly return.
17 A third method was also employed: weekly portfolios (quintiles) were formed on the basis of each factor under analysis, and for
V.6 Impact of investors’ attention on the aggregate market level
Once the effects of retail investor attention on individual stocks are established, in this final subsection I investigate if any of the three previously studied market outcomes – liquidity, volatility and returns – correlates with retail investor attention at an aggregate market level.
In order to measure investors’ attention to the US stock market, volume of web
search queries in Google was used. Naturally, the term18 which was assumed to reflect deliberate paying of attention by retail investors was S&P500, the true name of the market index. The period and the frequency under analysis remain the same: weekly frequency from January 2005 to December 2008.
An important remark ought to be made. Contrarily to what happens with individual stocks, investors do not own and trade the index itself, they can only trade either S&P500 index futures, an ETF replicating the index or invest in S&P500 index funds. Hence, there is no physical match between the security searched and the security traded, a fact that is likely to yield different results from the ones obtained thus far.
Maintaining the previous order, the first market outcome object of study was liquidity. Unlike the approach used for individual stocks, liquidity for S&P500 index is measured directly through volume traded, since there is no data for the total amount of shares outstanding for all the S&P500 stocks allowing the computation of share turnover ratio. Trading volume, in this case, corresponds to all the shares traded for all stocks included in the index, over a weekly time span.
The analysis of market trading volume was conducted using time-series robust regressions and the respective results are in Table 14. The first specification containing only the controls, closing price and previous weekly return, achieved a R2 of 56%.
18 The ticker for S&P 500 index – SPX – was not included to avoid ambiguities that may result from this search term, provided that
Subsequently, the model was extended with the inclusion of linear and non-linear SVI variables, first the contemporaneous one and after that the lagged effect. I consider the results found as misleading for three reasons. First, none of the coefficients’ significance seems stable as more variables are added to the model; second, the significance of the linear variables is always inferior to 10%; and third, weirdly, not only the adjusted goodness of fit diminishes, penalising the inclusion of irrelevant variables, but also the normal R2 decreases. Therefore, I conclude that there is no evidence supporting a true interaction between normal levels of investor attention and market index volume traded.
Anyway, keeping consistency with what was previously done I examine a possible relationship between those two realities, at an abnormal level. The procedure followed was the exact same and the results are in Table 15. In this case, there is significant evidence supporting linear, contemporaneous and dynamic, links between abnormal investor attention and abnormal market liquidity. Numerically, a 1% increase in the current abnormal SVI leads to an average 3.17% rise in current abnormal volume traded, ceteris paribus; while 1% surge in abnormal SVI in the previous week makes the current week abnormal trading volume grow 2.9%, on average, holding all other things equal. A possible explanation I find for this finding relates to investors’
Provided that retail investor attention affects the overall market liquidity, I study the existence of a possible relationship between retail investor attention and the volatility of market index returns.
Table 16 contains the results of the GARCH (1,1) model, which accounts for the exogenous SVI variables. I find consistency with the results for liquidity, as the contemporaneous SVI seems to affect volatility, leading to its increase in the subsequent period19. This relation is statistically significant at a 5% level. The economic explanation stems from the fact that, as it was showed for individual stocks, augments in liquidity prompted by peaks of investor attention come along with a rise in volatility. In line with this, are noise trading theories already explained throughout the paper.
Accordingly to the evidence provided by Andrei and Hasler (2012) stating that investors are more attentive during bearish phases, times which are also characterised by high volatility shocks; to ensure that the significance of the SVI coefficients is not only due to the crisis period included in the sample, I re-estimate the model excluding all the observations that occurred in the post-Lehman Brothers bankruptcy, on the 15th of September 2008, considered by many as the starting point to the financial crisis. As it is known, the collapse of this financial giant not only prompted a sharp fall in the equity market approximately until March 2009, throwing the S&P500 to values well below 1000 points, but also increased dramatically the volatility of the US stock market. The results for this robustness re-estimation are available in column 11 and 12 of Table 16, and they show that, although slightly smaller, the influence of investor attention on market’s volatility persists even after excluding the crisis period.
Another meaningful relation can be studied from an overall market perspective: the correspondence between retail investors’ attention and implied volatility.
19 As mentioned in the data section, by using the most recent information, in this case contemporaneous, GARCH models yield a
For that purpose, the VIX index20 is used as dependent variable, similarly to what was done by Vlastakis and Markellos (2012). To test this hypothesis, I implement a model that aims at explaining VIX weekly values via times-series robust regressions. Controlling for the only two possibly important factors (within this dataset) in the context of a forward looking volatility measure – interest rates and industrial production growth – SVI variables were included in the model. Table 17 provides strong evidence for the existence of a negative correlation between retail investors’ attention and implied volatility. This counter-intuitive result, for which I find no explanation, only holds when the crisis period is included in the sample, a fact that is even odder, provided that both variables peaked after Lehman Brothers bankruptcy. Excluding the crisis period from the sample, no relevant relations are found between retail investor attention and forward-looking volatility, suggesting that finance professionals do not account for the effects of noise trading in their previsions of market volatility, probably because, under normal circumstances, it has no significant impact on options implied volatility.
As a matter of fact, this paper does not succeed in extending the work of Vlastakis and Markellos (2012), who find a truly significant positive relationship between retail investors’ attention and individual stocks’ implied volatility, to the
aggregate market level.
Finally, moving to the subject of returns, I assess whether the intensity of searches for the term S&P500 has a changing impact on the market index quote.
A set of robust time-series regression were again employed. In this case, there are almost no control variables to explain S&P500 weekly returns, provided that the Fama-French factors apply only to individual firms or portfolios, but not to the index.
20 The CBOE VIX index is a proxy for the following 30-days market volatility, grounded on the basis of market expectations, which
Due to the same reason a further analysis of risk-adjusted (abnormal) returns could not be carried out. Nonetheless, it is still possible to control for the effect of momentum, by including a lagged variable of returns21. Interestingly, the final model in column 5 of Table 18 suggests that a 1% increase in SVI for S&P500 in a certain week predicts a higher index return in the following week, by an average value of 0.636% points, ceteris paribus. The same argument for liquidity holds as a possible reason for the price impact, allowing its polish: finding the best performers, retail investors take long positions on them (consistent with previous findings as well as Barber and Odean (2008) and Da et al. (2011)), generating the price pressure that drives up stock returns and consequently the market index value. Nevertheless, care must be taken when interpreting this result, since there are not many control variables in the model and this effect of SVI may be due to some other factors for which the model does not account. In a nutshell, at the aggregate level, retail investor attention, as measured by SVI for S&P500, possesses some influence on market events for the market index. It interacts with liquidity, when abnormal levels of both dimensions are considered; in line with this, when investors are more attentive to the market its volatility tend to increase and, last but not least, higher levels of investor attention to the market index also result in a rise in market index quote, on average. Yet, it is relevant to look at these results with a critical eye and do not take them as absolutely certain, provided that few control variables were included in the models, due to the nature of the market index and also due to data limitations. Moreover, the relationships documented occur through indirect mechanisms as there is no physical match between the term searched and the asset traded, the impact on the market index occurs via individual stocks.
21 For the sake of rigour, I also specified that model accounting for past volatility, which is not often priced, however establishes a