The complex elevational diversity of birds has been inves-tigated on every continent (GRINNELL & STORER 1924, ORIANS 1969,
KIKKAWA & WILLIAMS 1971, TERBORGH 1971, LACK 1976, WARTMANN
& FURRER 1977, PRIGOGINE 1980, THIOLLAY 1980, EGUCHIet al. 1989,
GOODMAN & GONZALES 1990, THORMSTROM & WATSON 1997, NATHAN
& WERNER 1999, ALIABADIANet al. 2008). In the Neotropical re-gion, the emphasis has been on Andean rainforests (TERBORGH
1971, 1977, 1985, TERBORGH & WESKE 1975, PEARSON & RALPH 1978,
RAHBEK 1997, PATTERSONet al. 1998, HENNESSEYet al. 2003, KATTAN &
FRANCO 2004, HERZOGet al. 2005, PAULSCH & MÜLLER-HOHESTEIN
2008). In Brazil, the Atlantic Forests are also an excellent case study for the elevational diversity of organisms (COLWELLet al. 2004), reaching the greatest altitudinal range in the coastal Serra do Mar, and in the interior Serra da Mantiqueira. While the Serra da Mantiqueira has a truncated elevational gradient, meaning that the lowest elevations are not at sea level, the Serra do Mar has continuous rainforests ranging from sea level to altitudes that may reach 2,300 m in the Serra dos Órgãos, state of Rio de Janeiro (ALMEIDA & CARNEIRO 1998).
Apart from HOLT’s (1928) ornithological survey of the Serra do Itatiaia, in Rio de Janeiro, and STOTZ’s et al. (1996) review of the elevational diversity of all birds in the Atlantic Forest, others have investigated bird elevational diversity in both mountain ranges of the Atlantic Forest (GOERCK 1999, BUZZETTI 2000, DEVELEY
2004, RAJÃO & CERQUEIRA 2006, MALLET-RODRIGUESet al. 2010), and at other locations within these forests (BENCKE & KINDEL 1999,
MELO-JÚNIORet al. 2001). These studies neither explored the driv-ing factors of elevational patterns, nor explicitly described the elevational patterns found. Instead, they described the elevations in which each species was recorded, thereby only developing an elevational range database, without explaining the patterns.
One of the best known species-altitude curves is unimodal. In this curve, the maximum species richness is in the middle of the elevational gradient, which is referred to as the Mid-domain Effect (COLWELL & HURTT 1994, COLWELL & LEES
2000). The Mid-domain Effect (MDE) is a null model that as-sumes that, due to topographical and/or geographical con-straints (base and top of a mountain, for example) species ranges overlap more near the middle of an elevational gradient, where many large- to medium-sized ranges must overlap but are less likely to abut an edge of this gradient (COLWELLet al. 2004). On mountains, the MDE predicts 1) a unimodal diversity curve with maximum diversity at mid-elevations, 2) a strong posi-tive association between the predicted diversity based on Monte Carlo simulations and the empirical diversity at each 100 m elevational band, 3) that deviations in maximum species rich-ness away from the mid-point of the mountain should be dis-tributed on random elevations of this mountain if spatial constraints alone drive elevational diversity and 4) a strong relationship between MDE fit (r2 value) and the ratio of the average bird range size to elevational gradient length. This de-rives from the premise that MDE predictions are based mainly
Bird species diversity in the Atlantic Forest of Brazil is not explained by
the Mid-domain Effect
Vagner Cavarzere & Luís Fábio Silveira
Seção de Aves, Museu de Zoologia, Universidade de São Paulo. Avenida Nazaré 481, 04218-970 São Paulo, SP, Brazil. E-mail: [email protected]; [email protected]
ABSTRACT. The Atlantic Forest is an excellent case study for the elevational diversity of birds, and some inventories along elevational gradients have been carried out in Brazil. Since none of these studies explain the patterns of species richness with elevation, we herein review all Brazilian studies on bird elevational diversity, and test a geometric constraint null model that predicts a unimodal species-altitude curve, the Mid-domain Effect (MDE). We searched for bird inventories in the literature and also analysed our own survey data using limited-radius point counts along an 800 m elevational gradient in the state of São Paulo, Brazil. We found 10 investigations of elevational diversity of Atlantic Forest birds and identified five different elevational patterns: monotonic decreasing diversity, constant at low elevations, constant at low elevations but increasing towards the middle, and two undescribed patterns for Atlantic Forest birds, trough-shaped and increasing diversity. The average MDE fit was low (r2 = 0.31) and none of the MDE predictions were robust across
all gradients. Those studies with good MDE model fits had obvious sampling bias. Although it has been proposed that the MDE may be positively associated with the elevational diversity of birds, it does not fit the Brazilian Atlantic Forest bird elevational diversity.
on the overlap of medium and large-ranged species, and do not apply necessarily to species with small ranges; thus gradi-ents with more large-ranged species should show a better fit to the MDE (DUNNet al. 2007).
While many studies have supported the predictions of the MDE for many taxa (LIEBERMANet al. 1996, RAHBEK 1997,
KESSLER 2000, 2001, HEANEY 2001, JETZ & RAHBEK 2001, SANDERS
2002, MCCAIN 2004, GARCÍA-LOPEZet al. 2011), others have re-jected it, partially or entirely (BOKMA & MÖNKKÖNEN 2000, BROWN
2001, KOLEFF & GASTON 2001, BOKMAet al. 2001, DINIZ-FILHOet al.
2002, HAWKINS & DINIZ-FILHO 2002, LAURIE & SILANDER 2002, ZAPATA
et al. 2003, HERZOGet al. 2005, ALIABADIANet al. 2008, MCCAIN
2009, 2010), arguing that it assumes an a-priori distribution of species (HAWKINS & DINIZ-FILHO 2002, ZAPATA et al. 2003), and that some assumptions of the MDE are unrealistic, conceptu-ally flawed, or internconceptu-ally inconsistent. Assessing the role and the biological basis of the MDE in nature has proven techni-cally challenging and, because it questions the traditional view that assumes a monotonic decline of species richness with in-creasing altitude (STEVENS 1992), it has also proven
controver-sial (COLWELLet al. 2004).
MCCAIN (2009) described global trends in bird elevational diversity, such as the four distinct diversity patterns displayed by birds on mountains: 1) monotonic decreasing diversity, 2) constant at low elevations, 3) constant at low elevations but increasing towards the middle, and 4) unimodal maximum at mid elevations. She also showed that bird diversity on moun-tains where humidity is high either declines with elevation or is relatively constant over low-elevations, while on dry moun-tains it is unimodal or constant over a broad, low-elevation region, usually with a mid-elevation maximum. Here we analyse the elevational diversity of birds in the Atlantic Forest. Our main goals were 1) to review the studies on bird elevational diversity in mountainous regions in the Brazilian Atlantic For-est; 2) to determine and compare elevational patterns of spe-cies richness in Atlantic Forest described in the literature; and 3) to test the predictions of the MDE with these data sets.
MATERIAL AND METHODS
We compiled data on bird elevational diversity from the literature using a combination of the following search keywords suggested by MCCAIN (2009): bird, avian, diversity, species
rich-ness, elevation (-al), altitude (-inal), Brazil. Species-altitude re-lationships were derived from these data and also from a few publications that MCCAIN (2009) excluded from her global
meta-analyses, because they apparently contained biased sampling methods. We are aware that we cannot control for the com-pleteness of surveys we used to generate our review, but our intention was to determine elevational patterns of Atlantic Forest birds using all available data.
We also included our standardized elevational bird dataset from the Serra do Mar, state of São Paulo. To do this, we
con-ducted bird counts in the municipalities of Bertioga (23°51’S, 46°08’W) and at Boracéia Biological Station (23°39’S, 45°53’W), near the municipality of Salesópolis, in the mountains of the Atlantic Forest, during two breeding seasons, using point counts from October 2008 to February 2010. We used nine 100 m wide elevational belt transects along one trail in an 800 m elevational gradient, with three 10-min points at least 200 m apart on each transect. We considered a 50 m limited radius of detection to avoid counting birds from adjacent transects. These analyses, including detailed sampling design and surveys, will be pub-lished elsewhere (V. Cavarzere & L.F. Silveira unpubl. data).
The climate in all study areas (reviews and our data alike) comprises two well-defined seasons: a warm-wet season from October to April, and a cold-dry season from May to Septem-ber. Five transition zones can be found at the study areas, though not all in the same local gradient. They are typically known as: Lowland Rain Forest (0-400 m), Lower Montane Rain Forest (400-1,000 m), Montane Rain Forest (above 1,000 m), Campos de Altitude (open formations above 1,000 m in the Serra do Mar or even higher on the Serra do Itatiaia), and Montane Araucaria Forest (above 1,000 m; VELOSOet al. 1991).
To test the four MDE predictions, we conducted statistical analyses following MCCAIN (2009). Prediction 1 (as explained in the Introduction), a unimodal diversity curve at mid-elevations: to assess whether there are more mid-elevation maximums than other diversity patterns, we used the chi-square goodness of fit test. Prediction 2, a positive association between predicted and empirical diversity: to compare the observed with the expected species richness by the MDE, we generated 95% prediction in-tervals using 50,000 Monte Carlo simulations of elevational ranges within the domain using the Mid-Domain Null Excel worksheet (MCCAIN 2004). The expected species richness in each
elevational band was generated using the empirical range sizes sampled without replacement, and randomly chosen range mid-points. To evaluate whether species richness predicted by the mid-domain effect (based solely on geometric constraints assum-ing hard boundaries) is congruent with the observed species rich-ness, we tested the fit between the two sets of species richness from the coefficient of determination of a least-squares linear regression (COLWELLet al. 2004, MCCAIN 2004). Prediction 3,
de-viation in maximum diversity distributed away from the mid-point of the mountain: we used the Student’s t-test to ascertain if maximum diversities were more likely to occur at the middle of the elevational gradient than at any other elevation. Predic-tion 4, a relaPredic-tionship between MDE fit and the ratio of the aver-age bird range size: the r2 value from the linear regression of the MDE with a ratio of average bird range size (m) divided by the length of the elevational gradient (m) for each study provided an index of the strength of the MDE range size prediction (LEES
et al. 1999, DUNNet al. 2007).
interpola-tion: a species was then considered present at a given elevation if it was present in the next upper and lower altitudinal band. We only analysed data in the literature with sufficient infor-mation to fulfil the premises of the Mid-Domain Null. For sta-tistical analysis we used SPSS 13.0 for Windows (SPSS 2004).
RESULTS
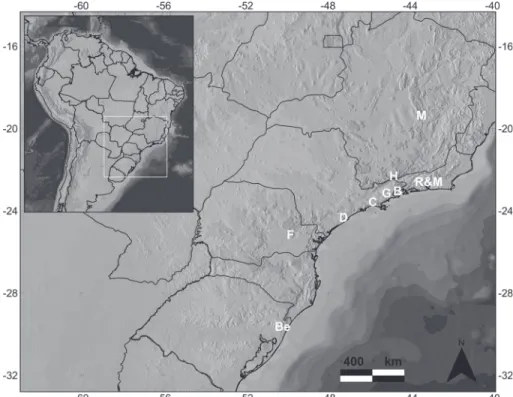
We found 10 research publications on bird elevational diversity conducted in mountainous regions in Brazil. All stud-ies, except for one, were carried out in the Atlantic Forest. The exception was a study carried out at a transition zone with the Cerrado in the Serra do Espinhaço, state of Minas Gerais (Fig. 1, Tab. I). We found five elevational patterns from these data: monotonic decreasing diversity, increasing diversity, constant at low elevations, constant at low elevations but increasing towards the middle and trough-shaped (Figs 2-6).
Data from HOLT (1928) and RAJÃO & CERQUEIRA (2006)
con-firmed a MDE with only a few deviations from the predictions of the null model, while the study of MELO-JÚNIORet al. (2001) contrasted with the unimodal pattern and described a mono-tonic decreasing species-altitude curve. MALLET-RODRIGUESet al.
(2010), our own data, and the study of the distribution of the family Furnariidae (FÁVAROet al. 2006) revealed a poor fit to the
MDE predictions. Our data, which demonstrated a trough-shaped pattern, and that of FÁVAROet al. (2006), showing an
increasing pattern of diversity towards higher elevations, re-sulted in undescribed relationships between elevation and bird species of the Atlantic Forest (Figs 7-12).
Bird diversity did not fit well any of the four MDE predic-tions. Elevational diversity was not uniformly unimodal, but tended to assume different shapes of species-altitude curves (con-trary to prediction 1; 2 = 4.45, df = 1, p = 0.035, n = 11). Fits to
the null model were variable and poor: average r2 value = 0.31 for those studies with available species range data (prediction 2, n = 6). Deviations in maximum bird diversity were not randomly distributed around the mid-point of the mountain, but shifted to significantly lower elevations (prediction 3, t = -1.74, df = 4, p = 0.034, n = 11). Finally, there was a positive relationship be-tween the ratio average bird range size/gradient length and fit to MDE (prediction 4, r2 = 0.79, F = 15.412, df = 1, p = 0.017, n = 6).
DISCUSSION
In the Atlantic Forest of Brazil, bird species diversity is not explained by the Mid-domain Effect. Some of the MDE predictions were not strongly supported, and most of the MDE regressions resulted in a poor fit to the MDE predictions.
Figures 2-6. Elevational richness patterns based on empirical datasets at different Brazilian Atlantic Forest sites: (2) monotonic decreas-ing diversity, (3) increasdecreas-ing diversity, (4) constant at low elevations, (5) unimodal maximum at mid-elevations and (6) trough-shaped.
Figures 7-12. Empirical (solid lines) and the 95% CI of the predicted species richness based on 50,000 Monte Carlo simulations sampled without replacement of the six gradients we analysed from: (7) HOLT (1928); (8) MELO-JÚNIOR et al. (2001); (9) FÁVARO et al. (2006); (10) RAJÃO & CERQUEIRA (2006); (11) MALLET-RODRIGUES et al. (2010); (12) present study.
2
5
3 4
6
7 8
9 10
viations of the maximum diversity away from the mid-point of the mountain were not randomly distributed, and the posi-tive relationship of prediction 4) included incomplete elevational gradients and unstandardized sampling designs. Similar trends in low MDE fits and skewed deviations have been documented along elevational gradients globally for non-fly-ing small mammals (MCCAIN 2007b), bats (MCCAIN 2007a), birds (MCCAIN 2009) and reptiles (MCCAIN 2010). For most vertebrate
groups and other taxa examined to date (DUNNet al. 2007),
elevational patterns consistently reject the MDE, and there-fore we must look for other factors that may determine bird species richness along elevations.
MCCAIN (2009) suggested that, in wet tropical mountains,
bird elevation patterns should be decreasing and monotonic, with or without a maximum diversity at low elevations. This was not the case in five studies analysed here. In the only case where elevational diversity was greatest at low elevations, the sampling effort at different altitudes was not reported, and this pattern may be an artefact of low sampling intensity. Although most gradients examined considered small spatial scales (large spatial diversity patterns of taxonomic groups fit the MDE null model predictions better; DUNNet al. 2007), sampling methods in studies with mid-elevation maximums were not standardised (HOLT 1928, BENCKE & KINDEL 1999, RAJÃO & CERQUEIRA 2006). Our
review suggests that, when testing the MDE against empirical data, the design of sampling procedures, as well as sample ef-fort, are very important, and must include refined and stan-dardized scales of elevational bands.
The homogeneity of the Atlantic Forest vegetation along the elevational gradient of the Serra do Mar may explain, in part, the lack of a MDE. In São Paulo, the highest peaks of this moun-tain range reach up to 800 m (ALMEIDA & CARNEIRO 1998). Transi-tion zones occur at this altitude (VELOSOet al. 1991), but are
probably not enough to create discrete habitat types, which is the basis for the community overlap theory (LOMOLINO 2001). In the case of HOLT (1928), the greatest species richness coincides
with the transition between forest and Campos de Altitude (open formations) at 2,870 m of the Serra do Itatiaia. The same obser-vation can be made for the maximum diversity in the compila-tion of surveys in RAJÃO & CERQUEIRA (2006). The extensive bird counts of MALLET-RODRIGUESet al. (2010) also found high species richness around 1,000 m (transition between forest and Campos de Altitude) at the Serra dos Órgãos, but the same number of species were found between 200 and 600 m, without a break in vegetation. By contrast, no diversity maximum at transition zones was evident in the results of MELO-JÚNIORet al. (2001) and in our data. Apparently, community overlap theory may apply to higher elevational gradients, such as South American Tropical Andes, where more evident transitions in vegetation occur (TERBORGH
1985). Even along gradients where the highest peaks are similar to those found in Brazil, elevational diversity patterns did not support the community overlap theory (MCCAIN 2004).
The lack of information necessary to complement other analyses, as well as few studies, make it difficult to identify environmental drivers of changes in bird species richness with altitude. Uneven sample effort is not responsible for the ob-served patterns, as shown by independence between sample effort and bird diversity for the state of Rio Grande do Sul (Spearman; r2 = 0.093, p = 0.843; BENCKE & KINDEL 1999) or for the coastal municipality of Ubatuba, São Paulo (r2 = 0.500, p = 0.667; GOERCK 1999). Lack of predictive power diminishes
the generality of the MDE null model as an explanation for bird elevational diversity patterns, and consistent deviations from the null model predictions suggest underlying climatic drivers (MCCAIN 2007a). Recent studies have focused on cli-matic variables, such as availability of water and temperature, Table I. List of elevational gradients of bird species richness for the Atlantic Forest, Brazil. Richness pattern, latitude, percentage of gradient sampled, altitude and MDE null model r2 values are given. N/A indicates studies with insufficient data for MDE analyses. (DC) Monotonic
decreasing diversity, (CL) constant at low elevations, (UM) unimodal maximum at mid-elevations, (TS) trough-shaped, (ID) increasing diversity.
Study site (reference) Elevation pattern Latitude % Altitude (m) r2
Serra do Itatiaia, Rio de Janeiro (HOLT 1928) MP -22 88.0 2500 0.82*
Atlantic Forest (STOTZet al. 1996) CL -15 99.0 3014 N/A
Tainhas – Terra de Areia, Rio Grande do Sul (BENCKE &KINDEl 1999) UM -29 70.0 1000 N/A
Ubatuba, São Paulo state (GOERCK 1999) DC -23 91.0 1150 N/A
Angra dos Reis – Parati, Rio de Janeiro (BUZZETTI 2000) CL -23 100.0 1700 N/A Serra do Cipó, Minas Gerais state (MELO-JÚNIORet al. 2001) DC -19 88.0 1600 0.05 Juréia-Itatins Ecological Station, São Paulo (DEVELEY 2004) DC -24 85.0 1300 N/A Tibagi River Basin, Paraná (FÁVAROet al. 2006) ID -25 6.5 1010 0.04
Serra dos Órgãos, Rio de Janeiro (RAJÃO &CERQUEIRA 2006) UM -22 100.0 2260 0.42
Serra dos Órgãos, Rio de Janeiro (MALLET-RODRIGUESet al. 2010) CL -22 90.0 2260 0.11
and their effect on vegetation distribution, as explanations for the elevational distribution of animals. McCain concluded that most investigations were highly correlated with these abiotic factors in determining species richness of bats (MCCAIN 2007b),
birds (MCCAIN 2009) and reptiles (MCCAIN 2010), in spite of the
altitude in which the gradient diversity was greatest.
In the only previous published study of the MDE in Bra-zil, this null model was rejected as an explanation for the elevational pattern of harvestmen on three mountains in Ubatuba (ALMEIDA-NETOet al. 2006). Instead, the decline in
spe-cies richness with increasing elevation was correlated to tem-perature and humidity. The value of the spatial constraint null model corresponds to its quantitative prediction of diversity; thus the low fits to the MDE predictions along elevational gra-dients show that diversity is responding to biological factors and not simply to space (MCCAIN 2007b). Similar support for
combined temperature and water as drivers of diversity exists globally for most plant and animal groups (HAWKINSet al. 2003), and for various plant groups along elevations (e.g., BHATTARAIet
al. 2004, CARPENTER 2005, KRÖMERet al. 2005, ACHARYAet al. 2011).
Thus, most direct and indirect evidence currently supports a climatic driver (which must be considered for future evalua-tions) of diversity patterns with space playing less-pronounced roles (MCCAIN 2007b). Although elevational studies have been
conducted worldwide, the most recent studies have failed to support the MDE for birds, thereby showing that bird (and other taxa) diversity patterns with elevation are not merely conse-quences of random processes.
ACKNOWLEDGMENTS
We thank Pedro F. Develey and José C. Motta Jr for im-portant suggestions on an earlier stage of this study, and Instituto de Biociências da Universidade de São Paulo. Gabriel P. Moraes and Fernanda G. Maciel helped during recent bird surveys in São Paulo. IdeaWild and United Parcel Services (UPS), through Bruno Ehlers, provided essential field equipment. VC benefited from the Coordenação de Aperfeiçoamento de Pessoal de Nível Superior (CAPES) scholarship during the development of this study. LFS receives a grant from Conselho Nacional de Desenvolvimento Científico e Tecnológico (CNPq, #313818/ 2009-6). Léo Novaes produced all images. Three anonymous reviewers and Michael Lawes greatly improved an initial manu-script with several important contributions.
LITERATURE CITED
ACHARYA, K.P.; O.R. VETAAS & H.J.B. BIRKS. 2011. Orchid species
richness along Himalayan elevational gradients. Journal of
Biogeography 38 (9): 1821-1833. doi:
10.1111/j.1365-2699.2011.02511.x.
ALIABADINA, M.; R. SLUYS; C.S. ROSELAAR & V. NIJMAN. 2008. Species diversity and endemismo: testing the mid-domain effect on
species richness patterns of songbirds in the Palearctic region. Contributions to Zoology 77 (2): 99-108. ALMEIDA, F.F.M. & C.R. CARNEIRO. 1998. Origem e evolução da
Serra do Mar. Revista Brasileira de Geociências 28 (2): 135-150.
ALMEIDA-NETO, M.; G. MACHADO; R. PINTO-DA-ROCHA & A.A. GIARETTA.
2006. Harvestman (Arachnida: Opiliones) species distribution along three Neotropical elevational gradients: an alternative rescue effect to explain Rapoport’s rule? Journal of
Biogeography 33 (2): 361-375.
doi:10.1111/j.1365-2699.2005.01389.x.
BHATTARAI, K.R.; O.R. VETAAS & J.A. GRYTNES. 2004. Fern species richness along a central Himalayan elevational gradient, Nepal. Journal of Biogeography 31 (3): 389-400. doi: 10.1046/j.0305-0270.2003.01013.x.
BENCKE, G.A. & A. KINDEL. 1999. Bird count along an altitudinal
gradient of Atlantic Forest in northeastern Rio Grande do Sul, Brazil. Ararajuba7 (2): 91-107.
BOKMA, F. & M. MÖNKKÖNEN. 2000. The mid-domain effect and
the longitudinal dimension of continents. Trends in Ecology and Evolution15 (7): 288-289. doi:10.1016/S0169-5347(00)01885-1.
BOKMA, F.; J. BOKMA & M. MÖNKKÖNEN. 2001. Random processes and geographic species richness patterns: why so few species in the north. Ecography24 (12): 43-49.doi: 10.1034/j.1600-0587.2001.240106.x.
BROWN, J.H. 2001. Mammals on mountainsides: elevational patterns of diversity. Global Ecology and Biogeography 10 (1): 101-109.doi:10.1046/j.1466-822x.2001.00228.x. BUZZETTI, D.R.C. 2000. Distribuição altitudinal de aves em
An-gra dos Reis e Parati, sul do Estado do Rio de Janeiro, p. 131-148. In: M.A.S. ALVES; J.M.C. SILVA; M. VAN SLUYS; H.G. BERGALLO
& C.F.D. ROCHA (Eds). A ornitologia no Brasil: pesquisa atual e perspectivas. Rio de Janeiro, Eduerj, 352p. CARPENTER, C. 2005. The environmental control of plant density
on a Himalayan elevation gradient. Journal of Biogeography 32 (6): 999-1018.doi: 10.1111/j.1365-2699.2005.01249.x. COLWELL, R.K. & G.C. HURTT. 1994. Non biological gradients in
species richness and a spurious Rapoport’s effect. The
American Naturalist 144 (4): 570-595. doi:10.2307/
2462939.
COLWELL, R.K. & D.C. LEES. 2000. The mid-domain effect: geometric constraints on the geography of species richness.
Trends in Ecology and Evolution15 (2): 70-76.doi:10.1016/ S0169-5347(99)01767-X.
COLWELL, R.K.; C. RAHBEK & N.J. GOTELLI. 2004. The mid-domain
effect and species richness patterns: what have we learned so far? The American Naturalist163 (3): E1-E23. doi: 10.1086/382056.
DEVELEY, P.F. 2004. As aves da Estação Ecológica Juréia-Itatins,
p. 278-295. In: O.A.V. MARQUES & W. DULEBA (Ed.). A Estação Ecológica Juréia-Itatins: ambiente físico, flora e fauna.
DINIZ-FILHO, J.A.F.; C.E.R. SANT’ANA; M.C. SOUZA & T.F.L.V.B.
RANGEL. 2002. Null models and spatial patterns of species
richness in South American birds of prey. Ecology Letters 5
(1): 47-55.doi: 10.1046/j.1461-0248.2002.00289.x. DUNN, R.R.; C.M. MCCAIN & N.J. SANDERS. 2007. When does
diversity fit null model predictions? Scale and range size mediate the mid-domain effect. Global Ecology and
Biogeography 16 (3): 305-312. doi:
10.1111/j.1466-8238.2006.00284.x.
EGUCHI, K.; M. TAKEISHI; H. NAGATA; Y. HEMNI & N. KAWAJI. 1989.
Altitudinal distribution of forest birds in the Kayu-Shima Island, Kagoshima Prefecture, Japan. I. Breeding season.
Japanese Journal of Ecology39 (1): 53-65.
FÁVARO, F.L.; L. ANJOS; E.V. LOPES; L.B. MENDONÇA & G.H. VOLPATO.
2006. Efeito do gradiente altitudinal/latitudinal sobre espé-cies de aves florestais da família Furnariidae na Bacia do Rio Tibagi, Paraná, Brasil. Revista Brasileira de Zoologia23
(1): 261-266. doi: http://dx.doi.org/10.1590/S0101-81752006000100020.
GARCÍA-LOPEZ, A.; E. MICÓ & E. GALANTE. 2011. From lowlands to
highlands: searching for elevational patterns of species richness and distribution of scarab beetles in Costa Rica. Diversity and Distributions16 (6): 543-553. doi: 10.1111/j.1472-4642.2011. 00846.x.
GOERCK, J.M. 1999. Distribution of birds along an elevational
gradient in the Atlantic Forest of Brazil: implications for the conservation of endemic and endangered species. Bird
Conservation International 9: 235-253. doi: 10.1017/
S0959270900003439.
GOODMAN, S.M. & P.C. GONZALES. 1990. The birds of Mt. Isarog
National Park, Southern Luzon, Philippines, with particu-lar reference to altitudinal distribution. Fieldiana Zoology 60: 1-39.
GRINNELL, J. & T. I. STORER. 1924. Animal life in the Yosemite: an account of the mammals, birds, reptiles, and amphibians in a cross-section of the Sierra Nevada.
Berkeley, University of California Press, XVIII+741p. HAWKINS, B.A. & J.A.F. DINIZ-FILHO. 2002. The mid-domain effect
cannot explain the diversity gradient of Neartic birds. Glo-bal Ecology and Biogeography 11 (5): 419-426.
HAWKINS, B.A.; R. FIELD; H.V. CORNELL; D.J. CURRIE; J.F. GUÉGAN;
D.M. KAUFMAN; J.T. KERR; G.G. MITTELBACH; T. OBERDORFF; E. O’BRIEN; E.E. PORTER & J.R.G. TURNER. 2003. Energy, water, and broad-scale geographic patterns of species richness.
Ecology84 (12): 3105-3117. doi: 10.1890/03-8006. HEANEY, L.R. 2001. Small mammal diversity along elevational
gradients in the Philippines: an assessment of patterns and hypotheses. Global Ecology and Biogeography10 (1): 15-39. doi: 10.1046/j.1466-822x.2001.00227.x.
HENNESSEY, A.B.; S.A. HERZOG; M. KESSLER & D. ROBINSON. 2003.
Avifauna of the Pilón Lajas Biosphere Reserve and Communal Lands, Bolivia. Bird Conservation International13: 319-349. doi: 10.1017/S095927093993241.
HERZOG, S. K.; M. KESSLER & K. BACH. 2005. The elevational
gradient in Andean bird species richness at the local scale: a foothill peak and a high-elevation plateau. Ecography 28 (2): 209-222. doi: 10.1111/j.0906-7590.2005.03935.x. HOLT, E.G. 1928. An ornithological survey of the Serra do
Itatiaya, Brazil. Bulletin of the American Museum of Na-tural History57 (5): 251-326.
JETZ, W. & C. RAHBEK. 2001. Geometric constraints explain much of the species richness pattern in African birds. Proceedings of the National Academy of Sciences of the United States of America98 (10): 5661-5666.doi: 10.1073/pnas.091100998. KATTAN, G.H. & P. FRANCO. 2004. Bird diversity along elevational gradients in the Andes of Colombia: area and mass effects.
Global Ecology and Biogeography13 (5): 451-458. doi: 10.1111/j.1466-822X.2004.00117.x.
KESSLER, M. 2000. Elevational gradients in species richness and
endemism of selected plant groups in the central Bolivian Andes. Plant Ecology 149 (2): 181-193. doi: 10.1023/ A:1026500710274.
KESSLER, M. 2001. Patterns of diversity and range size of selected
plant groups along an elevational transect in the Bolivian Andes. Biodiversity and Conservation10 (11): 1897-1921. doi: 10.1023/A:1013130902993.
KIKKAWA, J. & E.E. WILLIAMS. 1971. Altitude distribution of land
birds in New Guinea. Search 2: 64-65.
KOLEFF, P. & K.J. GASTON. 2001. Latitudinal gradients in diversity:
real patterns and random models. Ecography 24 (3): 341-351. doi: 10.1111/j.1600-0587.2001.tb00207.x.
KRÖMER, T.; M. KESSLER; S.R. GRADSTEIN & A. ACEBEY. 2005. Diversity
patterns of vascular epiphytes along an elevational gradient in the Andes. Journal of Biogeography32 (10): 1799-1809. doi: 10.1111/j.1365-2699.2005.01318.x.
LACK, D. 1976. Island Biology illustrated by the land birds of Jamaica. Berkeley, University of California Press, XVI+445p. LAURIE, H. & J.A. SILANDER JR. 2002. Geometric constraints and
spatial patterns of species richness: critique of range-based models. Diversity and Distributions 8 (6): 351-364. doi: 0.1046/j.1472-4642.2002.00160.x.
LEES, D.C.; C. KREMER & L. ANDRIAMAMPIANINA. 1999. A null model
for species richness gradients: bounded range overlap of butterflies and other rainforest endemics in Madagascar.
Biological Journal of the Linnean Society67 (4): 529-584. doi: 0.1111/j.1095-8312.1999.tb01945.x.
LIEBERMAN, D.; M. LIEBERMAN; R. PERALTA & G.S. HARTSHORN. 1996.
Tropical forest structure and composition on a large-scale altitudinal gradient in Costa Rica. Journal of Ecology 84
(2): 137-152.
LOMOLINO, M. V. 2001. Elevation gradients of species-density: historical and prospective views. Global Ecology and Biogeography10 (1): 3-13. doi: 10.1046/j.1466-822x.2001 .00229.x.
southeastern Brazil. Zoologia27 (4): 503-522. doi: 10.1590/ S1984-46702010000400003.
MCCAIN, C.M. 2004. The mid-domain effect applied to elevational gradients: species richness of small mammals in Costa Rica.
Journal of Biogeography31 (1): 19-31. doi: 10.1046/j.0305-0270.2003.00992.x.
MCCAIN, C.M. 2007a. Area and mammalian elevational diversity.
Ecology88 (1): 76-86. doi: 10.1890/0012-9658(2007)88[76: AAMED]2.0.CO;2.
MCCAIN, C.M. 2007b. Could temperature and water availability
drive elevational species richness patterns? A global case study for bats. Global Ecology and Biogeography16 (1): 1-13. doi: 10.1111/j.1466-8238.2006.00263.x.
MCCAIN, C.M. 2009. Global analysis of bird elevational diversity. Global Ecology and Biogeography 18 (3): 346-360. doi: 10.1111/j.1466-8238.2008.00443.x.
MCCAIN, C.M. 2010. Global analysis of reptile elevational
diversity.Global Ecology and Biogeography 19 (4): 541-553. doi: 10.1111/j.1466-8238.2010.00528.x.
MELO-JÚNIOR, T.A.; M.F. VASCONCELOS; G.W. FERNANDES & M.A. MARINI.
2001. Bird species distribution and conservation in Serra do Cipó, Minas Gerais, Brazil. Bird Conservation International 11 (3): 189-204. doi: 10.1017/S0959270901000272. NATHAN, R. & Y.L. WERNER. 1999. Reptiles and breeding birds on
Mt. Hermon: patterns of altitudinal distribution and species richness. Israel Journal of Zoology45 (1): 1-33.
ORIANS, G.H. 1969. The number of bird species in some tropical forests. Ecology50 (5): 783-801. doi: 10.2307/1933692. PATTERSON, B.D.; D.F. STOTZ; S. SOLARI; J.W. FITZPATRICK & V. PACHECO.
1998. Contrasting patterns of elevational zonation for birds and mammals in the Andes of southeastern Peru. Journal of Biogeography 25 (3): 593-607. doi: 10.1046/j.1365-2699.1998.2530593.x.
PAULSCH, D. & K. MÜLLER-HOHENSTEIN. 2008. Bird species distribution
along an altitudinal gradient in southern Ecuador and its functional relationships with vegetation structure, p. 149-156. In: E. BECK; J. BENDIX; I. KOTTKE; F. MAKESCHIN & R. MOSANDEL
(Eds). Gradients in a Tropical Mountain Ecosystem of Ecuador. Berlim, Springer Berlin Heidelberg, XXIV+526p. doi: 10.1007/978-3-540-73526-7_15.
PEARSON, O.P. & C.P. RALPH. 1978. The diversity and abundance of
vertebrates along an altitudinal gradient in Peru. Memorias del Museo de Historia Natural “Javier Prado”18: 1-97. PRIGOGINE, A. 1980. The altitudinal distribution of the avifauna
in the Itombwe forest (Zaire). Proceedings of the IV Pan-African Ornithological Congress: 169-184.
RAHBEK, C. 1997. The relationship among area, elevation, and
regional species richness in neotropical birds. The American
Naturalist149 (5): 875-902. doi:10.1086/286028. RAJÃO, H. & R. CERQUEIRA. 2006. Distribuição altitudinal e
simpatria das aves do gênero Drymophila Swainson (Passeriformes, Thamnophilidae) na Mata Atlântica. Revis-ta Brasileira de Zoologia 23 (3): 597-607. doi: 10.1590/ S0101-81752006000300002.
SANDERS, N. J. 2002. Elevational gradients in ant species richness: area, geometry and Rappoport’s rule. Ecography 25 (1): 25-32. doi: 10.1034/j.1600-0587.2002.250104.x.
SPSS. 2004.SPSS (Statistical Package for Social Sciences). Version 13.0. Chicago, SPSS Inc.
STEVENS, G.C. 1992. The elevational gradient in altitudinal ran-ge: an extension of Rapoport’s latitudinal rule to altitude.
The American Naturalist140 (6): 893-911.
STOTZ, D.F.; J.W. FITZPATRICK; T.A. PARKER & D.K. MOSKOVITS. 1996. Neotropical birds: ecology and conservation. Chicago, University of Chicago Press, XX+478p.
TERBORGH, J. 1971. Distribution on environmental gradients: theory and a preliminary interpretation of distributional patterns in the avifauna of the Cordillera Vilcabamba, Peru.
Ecology52 (1): 23-40. doi: 10.2307/1934735.
TERBORGH, J. 1977. Bird species diversity on an Andean elevational gradient. Ecology 58 (5): 1007-1019. doi: 10.2307/1936921.
TERBORGH, J. 1985. The role of ecotones in the distribution of
Andean birds. Ecology 66 (4): 1237-1246. doi: 10.2307/ 1939177.
TERBORGH, J. & J.S. WESKE. 1975. The role of competition in the distribution of Andean birds. Ecology56 (3): 562-576. doi: 10.2307/1935491.
THIOLLAY, J.M. 1980. L’evolution des peuplements d’oiseaux
tropicaux le long d’un gradient altitudinal dans l’himalaya central. Terre et la Vie34: 199-269.
THORMSTROM, R. & R.T. WATSON. 1997. Avian inventory and key
species of the Masoala Peninsula, Madagascar. Bird Conservation International 7 (2): 99-115. doi: 10.1017/ S0959270900001453.
VELOSO, H.P.; A.L.R. RANGEL FILHO & J.C.A. LIMA. 1991. Classifi-cação da vegetação brasileira, adaptada a um sistema internacional. Rio de Janeiro, IBGE/CDDI, Departamento de Documentação e Biblioteca, 124p.
WARTMANN, B. & R.K. FURRER. 1977. Zur Struktor der avifauna eines Alpentales entlang des Höhengradienten. I. Veränderungen zur Brutzeit. Der Ornithologische Beobachter74: 137-160. ZAPATA, F.A.; K. J. GASTON & S.L. CHOWN. 2003. Mid-domain
models of species richness gradients: assumptions, methods and evidence. Journal of Animal Ecology72 (4): 677-690. doi: 10.1046/j.1365-2656.2003.00741.x.