CARLA RODRIGUES RIBAS
GRADIENTE LATITUDINAL DE RIQUEZA DE ESPÉCIES DE
FORMIGAS EM CERRADO: REGRA DE RAPOPORT E EFEITOS
DA PRODUTIVIDADE E HETEROGENEIDADE
Tese apresentada à Universidade Federal de Viçosa, como parte das exigências do Programa de Pós-Graduação em Entomologia, para obtenção do título de Doctor Scientiae.
VIÇOSA
CARLA RODRIGUES RIBAS
GRADIENTE LATITUDINAL DE RIQUEZA DE ESPÉCIES DE
FORMIGAS EM CERRADO: REGRA DE RAPOPORT E EFEITOS
DA PRODUTIVIDADE E HETEROGENEIDADE
Tese apresentada à Universidade Federal de Viçosa, como parte das exigências do Programa de Pós-Graduação em Entomologia, para obtenção do título de Doctor Scientiae.
APROVADA: 23 de fevereiro de 2006
Prof. José Henrique Schoereder Prof. Og F. Fonseca de Souza (Conselheiro) (Conselheiro)
Prof. Júlio Neil Cassa Louzada Prof. Heraldo L. Vasconcelos
“Somos do tamanho dos nossos sonhos.”
Fernando Pessoa
AGRADECIMENTOS
Ao Zhé por ter sido meu exemplo todos esses anos e por tudo que passamos juntos.
Ao Carlos por ter sido fonte de inspiração ou de piração, sempre.
Aos meus dois melhores amigos, Rogério e Renata, que sempre estão prontos pra me dar colo, mesmo longe.
À Duda por existir.
Aos meus pais, minha tia e a minha avó por serem sempre meu exemplo e todo apoio necessário.
À D. Maria que virou minha mãe em Viçosa.
À Carina e ao Marco que são pessoas sempre presentes, sempre companheiras e que se tornaram meus grandes amigos.
Ao João por ter concordado em realizar meu pedido e por ter se tornado tão companheiro.
Aos amigos que me ajudaram com o trabalho de campo, Carla, Marcelo, Rogério, Zhé e Renata.
Ao pessoal do IBAMA, aos diretores dos parques, estações e floretas nacionais por terem permitido e colaborado com a realização desse trabalho sem o qual não seria possível a realização dessa tese.
Aos amigos que sempre estiveram dispostos a ler mais uma versão dos artigos e sem cara feia, principalmente para o Leandro e Renata.
Ao pessoal do laboratório por ter me ajudado com as infinitas dúvidas nesses quatro anos.
Ao Og e ao Ronaldo por terem ajudado com as análises “eRradas”.
Ao Adrian por ter me ajudado com o segundo artigo e principalmente por ter se tornado meu amigo.
Ao Crodoaldo pela companhia sempre que preciso, as 18:00h no Moreira’s. Ao Hildo por trazer sempre a mais gelada.
Ao Carlinhos e a Ritinha por fazerem o trailer ser tão bom.
Aos estagiários do laboratório que sempre (ou quase sempre) me fazem ficar de bom humor, principalmente ao João Vítor, Washington, Ricardo e Clarice.
À D. Paula, à Mirian e todos os professores e colegas da pós-graduação pelo apoio durante o doutorado.
À Universidade Federal de Viçosa e à CAPES sem as quais não seria possível a realização dessa tese.
ÍNDICE
RESUMO...vi
ABSTRACT...viii
1. Introdução geral...1
2. Is the Rapoport effect widespread? Null models revisited... 6
3. Spatial scale dependence of a reverse latitudinal gradient in arboreal ant species richness………...………...………... 50
4. Mid-domain and Rapoport effects - Null models for testing latitudinal gradients in ant species richness………..………... 81
RESUMO
RIBAS, Carla Rodrigues, D.S., Universidade Federal de Viçosa, fevereiro de 2006. Gradiente latitudinal de riqueza de espécies de formigas em cerrado: regra de
Rapoport e efeitos da produtividade e heterogeneidade. Orientador: Carlos Frankl Sperber. Conselheiros: José Henrique Schoereder e Og Francisco Fonseca de Souza.
ABSTRACT
RIBAS, Carla Rodrigues, D.S., Universidade Federal de Viçosa, February 2006. Latitudinal pattern of arboreal ant species richness: testing Rapoport’s effect and the effect of productivity and heterogeneity. Advisor: Carlos Frankl Sperber. Committee members: José Henrique Schoereder and Og Francisco Fonseca de Souza.
INTRODUÇÃO GERAL
O gradiente latitudinal de riqueza de espécies (GLRE) é um padrão encontrado para vários grupos de organismos e já foram levantadas mais de 30 hipóteses para explicá-lo (Willig et al. 2003; Hawkins and Agrawal 2005). Ultimamente existem algumas hipóteses que são tidas como mais promissoras, tais como as relacionadas à energia, à heterogeneidade ambiental, ao tempo evolutivo e ao efeito do domínio mediano (Turner 2004; Bjorholm et al. 2005; Brayard et al. 2005; Mora and Robertson 2005; Rex et al. 2005).
As hipóteses relacionadas à energia e a hipótese da heterogeneidade ambiental são na verdade fatores correlacionados à latitude e não mecanismos que poderiam explicar o aumento do número de espécies em direção ao equador (Hawkins and Diniz-Filho 2004). Mesmo assim esses dois fatores estão freqüentemente correlacionados à riqueza de espécies em vários grupos (Tews et al. 2004; Evans et al. 2005).
A hipótese do efeito do domínio mediano (EDM) prevê que a alocação aleatória de espécies com diferentes tamanhos de distribuição dentro de um domínio com limites geográficos produz um pico de riqueza de espécies no meio desse domínio (Colwell and Hurtt 1994; Colwell and Lees 2000). Apesar de existir bastante controvérsia sobre o uso do EDM como um modelo nulo para explicar o GLRE (Colwell et al. 2005; Hawkins et al. 2005; Zapata et al. 2005), Colwell et al. (2004) revisaram diversos trabalhos que testaram esse efeito chegando à conclusão de que esse é um efeito importante na explicação de gradientes de riqueza de espécies.
com diversas metodologias que são utilizadas para se testar essa relação (Gaston et al. 1998), recentemente tem sido encontrada em alguns grupos (e.g. Fortes and Absalão 2004; Arita et al. 2005; Folgarait et al. 2005). Gaston et al. (1998) criticaram a visão de que esse padrão seja considerado uma regra, uma vez que é um fenômeno local e não se aplica ao hemisfério sul, sugerindo o termo efeito Rapoport como mais plausível. Os resultados de trabalhos que testam o efeito Rapoport como causa do GLRE são conflitantes (Rohde 1996; Fleishman et al. 1998; Kolasa et al. 1998; Taylor and Gaines 1999; Smith and Gaines 2003).
O objetivo dessa tese é testar a existência do gradiente latitudinal de riqueza de espécies de formigas arborícolas em cerrado, assim como testar hipóteses explicativas para o padrão encontrado. A tese encontra-se dividida em três capítulos, cada um correspondendo a um artigo científico.
No primeiro capítulo propusemos um método modificando um modelo nulo anteriormente proposto por Lyons and Willig (1997), que permite testar o efeito Rapoport tanto em gradientes altitudinais quanto em gradientes latitudinais. Esse método permite também testar o efeito em distribuições que são restritas arbitrariamente pela área amostrada pelo pesquisador. Para isso, levantamos a hipótese de que a extensão de ocorrência das espécies é similar àquela esperada pela simples imposição de limites a essas extensões (distribuição nula). Quando as distribuições são diferentes da esperada pelo acaso, deve-se testar a hipótese de que as distribuições correspondem àquelas esperadas pelo efeito Rapoport. Nesse capítulo utilizamos esse novo método para re-analisar 55 distribuições publicadas em 39 artigos.
recursos e a heterogeneidade estrutural do ambiente e qual a influência das diferentes escalas espaciais no gradiente e nos fatores correlacionados. Esse trabalho foi realizado com dados coletados em 11 unidades de conservação no cerrado em três escalas espaciais, abrangendo um gradiente latitudinal de 14°.
No terceiro capítulo testamos a existência do efeito do domínio mediano e do efeito Rapoport na comunidade de formigas arborícolas em Cerrado, usando modelos nulos. Esses modelos excluem o efeito de gradientes espaciais causados por variáveis ambientais incluindo somente limitações geográficas na distribuição das extensões de ocorrência das espécies. Se os padrões observados são diferentes do esperado pelo acaso, pode-se deduzir que mecanismos biológicos podem ser responsáveis pelos gradientes observados. Esse trabalho também foi realizado com dados coletados em 11 unidades de conservação no cerrado.
Referências Bibliográficas
Arita HT, Rodríguez P, Vázquez-Domínguez E (2005) Continental and regional ranges of North American mammals: Rapoport’s rule in real and null worlds. J Biogeogr 32: 961-971
Bjorholm S, Svenning JC, Skov F, Balslev H (2005) Environmental and spatial controls of palm (Arecaceae) species richness across the Americas. Global Ecol Biogeogr 14: 423-429
Brayard A, Escarguel G, Bucher H (2005) Latitudinal gradient of taxonomic richness: combined outcome of temperature and geographic mid-domains effects? J Zool Syst Evol Res 43: 178-188
Colwell RK, Lees DC (2000) The mid-domain effect: geometric constraints on the geography of species richness. TREE 15: 70-76
Colwell RK, Rahbek C, Gotelli NJ (2004) The mid-domain effect and species richness patterns: what have we learned so far? Am Nat 163: E1-E23
Colwell RK, Rahbek C, Gotelli NJ (2005) The mid-domain effect: there’s a baby in the bathwater. Am Nat 166: E149-E154
Evans KL, Warren PH, Gaston KJ (2005) Species-energy relationships at the macroecological scale: a review of the mechanisms. Biol Rev 80: 1-25
Fleishman E, Austin GT, Weiss AD (1998) An empirical test of Rapoport's rule: elevational gradients in montane butterfly communities. Ecology 79: 2482-2493 Folgarait PJ, Bruzzone O, Porter SD, Pesquero MA, Gilbert LE (2005) Biogeography
and macroecology of phorid flies that attack fire ants in south-eastern Brazil and Argentina. J Biogeogr 32: 353-367
Fortes RR, Absalão RS (2004) The applicability of Rapoport’s rule to the marine mollusks of the Americas. J Biogeogr 31: 1909-1916
Gaston KJ, Blackburn TM, Spicer JI (1998) Rapoport's rule: time for an epitaph? TREE 13: 70-74
Hawkins BA, Diniz-Filho JAF (2004) 'Latitude' and geographic patterns in species richness. Ecography 27: 268-272
Hawkins BA, Agrawal AA (2005) Latitudinal gradients. Ecology 86: 2261-2262
Hawkins BA, Diniz-Filho JAF, Weis AE (2005) The mid-domain effect and diversity gradients: Is there anything to learn? Am Nat 166: E140-E143
Kolasa J, Hewitt CL, Drake JA (1998) Rapoport's rule: an explanation or a byproduct of the latitudinal gradient in species richness? Biodiv Conserv 7: 1447-1455
concerns and empirical evaluations for New World bats and marsupials. Oikos 79: 568-580
Mora C, Robertson DR (2005) Causes of latitudinal gradients in species richness: a test with fishes of the Tropical Eastern Pacific. Ecology 86: 1771-1782
Rex MA, Crame JA, Stuart CT, Clarke A (2005) Large-scale biogeographic patterns in marine mollusks: A confluence of history and productivity? Ecology 86: 2288-2297 Rohde K (1996) Rapoport's rule is a local phenomenon and cannot explain latitudinal
gradients in species diversity. Biodiv Lett 3: 10-13
Smith KF, Gaines SD (2003) Rapoport's bathymetric rule and the latitudinal species diversity gradient for Northeast Pacific fishes and Northwest Atlantic gastropods: evidence against a causal link. J Biogeogr 30: 1153-1159
Stevens GC (1989) The latitudinal gradient in geographical range: how so many species coexist in the tropics. Am Nat 133: 240-256
Taylor PH, Gaines SD (1999) Can Rapoport's rule be rescued? Modelling causes of the latitudinal gradient in species richness. Ecology 80: 2474-2482
Tews J, Brose U, Grimm V, Tielbörger K, Wichmann MC, Schwager M, Jeltsch F (2004) Animal species diversity driven by habitat heterogeneity/diversity: the importance of keystone structures. J Biogeogr 31: 79-92
Turner JRG (2004) Explaining the global biodiversity gradient: energy, area, history and natural selection. Basic Appl Ecol 5: 435-448
Willig MR, Kaufman DM, Stevens RD (2003) Latitudinal gradients of biodiversity: patterns, process, scale, and synthesis. Ann Rev Ecol Evol System 34: 273-309 Zapata FA, Gaston KJ, Chown SL (2005) The mid-domain effect revisited. Am Nat
Running Title: Rapoport effect revisited
Is the Rapoport effect widespread? Null models revisited
Carla R. Ribas 1,2 and José H. Schoereder 2
1 - Programa de Pós-Graduação em Entomologia; Departamento de Biologia Animal; Universidade Federal de Viçosa; Viçosa – MG; 36570-000; Brazil. [email protected]
2 - Departamento de Biologia Geral; Universidade Federal de Viçosa; Viçosa – MG; 36570-000; Brazil.
Corresponding author – José H. Schoereder, Departamento de Biologia Geral;
Universidade Federal de Viçosa; Viçosa – MG; 36570-000; Brazil; [email protected]
Abstract.
1. Aim To test the Rapoport effect using null models and data sets taken from literature.
We proposed an improvement on an existing method, testing Rapoport effect in elevational and latitudinal distributions when the sampled distributions are restricted by the latitudinal/elevational variation sampled.
2. Location Global.
3. Methods First, we hypothesized that real range size distributions were similar to
those expected by imposing boundaries or limits to species distributions (null distribution). When these distributions were different from those expected under the null assumptions, we tested the hypothesis that these distributions corresponded to those expected when a Rapoport effect would occur. We used two simulation methods, random and pseudo-random, which differed only in that the latter one assumes fixed species midpoints, coinciding with real midpoints. The observed correlations were compared with the frequency distribution of 1,000 simulations, using both simulation methods. We compared the parameters of the correlation curves generated by 1,000 simulations with those of the observed distributions, testing whether correlations indicated a Rapoport effect.
4. Results Several significant patterns of correlations between range size and midpoint
5. Main conclusions Using null models and midpoint as a distribution parameter we were unable to confirm the Rapoport effect in many data sets studied. Even though some recent studies have supporting this effect, our results suggest that the Rapoport effect is not widespread as a pattern in global ecology.
6. Keywords: Altitude; Biogeography; Distribution; Latitude; Meta-analysis;
Introduction
The term Rapoport's rule has been proposed by Stevens (1989) to describe a pattern of global species distribution. The rule suggests that a latitudinal increase in the size of species distributions (hereafter, range size) occurs when one moves from the equator to the poles. Following the same reasoning, Stevens (1992) extended Rapoport’s rule to elevational gradients in which there would be a positive relationship between range size and altitude. There are many mechanisms proposed to account for this controversial pattern and the possible explanations of the Rapoport's rule are beyond the scope of this paper (more details can be found in Folgarait et al., 2005; Hernández Fernández & Vrba, 2005a; Parmesan et al., 2005).
Several authors have noticed the coincident patterns of Rapoport’s rule and the gradient in species richness and some of them tested for a causal relationship between these patterns, but results are still inconclusive (Rohde, 1996; Rohde & Heap, 1996; Fleishman et al., 1998; Kolasa et al., 1998; Taylor & Gaines, 1999; Smith & Gaines, 2003). Willig et al. (2003) reported that some taxa exhibited a marked latitudinal gradient without showing Rapoport's rule, concluding that this hypothesis did not explain well the gradient of species richness.
Different methodologies were used to test the relationship between range size and latitude or altitude. Stevens’ method (1989) consists of dividing the area considered in latitudinal bands, calculating and regressing the average latitudinal range size of all species occurring in each band against latitude. This method creates a statistical difficulty because it includes the same species several times, generating non-independent data (Rohde et al., 1993). In Rohde's midpoint method (following Rohde et al., 1993), for each species the mean range extent (midpoint) is calculated and then regressed against range extent. Pagel et al. (1991) suggested the most-distal point method, which categorizes a species by the latitude within its range that is farthest from the equator, and then range size is regressed against most-distal latitude within that range.
The use of different methodologies to test the Rapoport effect and the lack of such relationships in the southern hemisphere (Gaston et al., 1998; Reed, 2003; Hernández et al., 2005) and in some taxa (Rohde et al., 1993) has prevented clarification of the importance of Rapoport rule as a general pattern of species distribution. Nathan & Werner (1999) suggested that a more critical and formal method, which does not suffer from statistical biases, is currently needed. Ashton (2001) recommended that meta-analytical techniques would be particularly useful to assess the generality of ecological patterns, such as the Rapoport effect.
Recently, a new perspective to test for gradients in species richness came from the mid-domain effect (Colwell & Hurtt, 1994; Colwell et al., 2004; Mora & Robertson, 2005; Arita, 2005, but see Zapata et al., 2003), in which there is a peak in species richness in the centre of a domain, caused only by imposing physical or ecological boundaries to the limits of this domain. The random placement of ranges within these boundaries generates a species richness peak, independently of biological mechanisms. Mid-domain models predict that not only more ranges will pile up in the centre of a domain, but that range sizes will be larger in the centre of a domain as a function of geometric constraints.
In this paper, we proposed an improvement to the method of Lyons & Willig (1997), allowing the test for Rapoport effects both in elevational and latitudinal distributions, even when described distributions are restricted by the latitudinal range sampled. First, we hypothesized that range size distributions were similar to those expected by imposing boundaries to these distributions (null distribution). When these distributions were different from those expected under null assumptions, we tested the hypothesis that these distributions corresponded to those expected under a Rapoport effect.
Material and Methods
Data sets
those that contained species distributions per latitude or altitude. This group of papers describes the distribution of several taxa, in northern and southern hemispheres or both, independent of including tests of the Rapoport effect.
Latitudinal distributions – expected null correlations
Following Lyons & Willig (1997), the first step to analyze latitudinal distributions was to describe the expected correlation between range size and mid-latitude. Stevens (1989) and Rohde et al. (1993) expected a positive correlation between range size and a latitudinal descriptor, but Lyons & Willig (1997) demonstrated an inverse correlation among these variables because the end of northern and southern continents (hard boundaries) impose a constraint such that ranges become smaller when one moves to higher latitudes in both directions (see Fig. 1 in Lyons & Willig, 1997). In lower latitudes, larger ranges might occur due to the lack of boundaries that restrict the extent of the ranges. We used midpoint instead of the most distal point because its use eases the detection of deterministic patterns in range sizes (Lyons & Willig, 1997).
We expected a negative correlation between range size and mid-latitude, when there are hard boundaries in the northern and southern limits of range distributions, and when ranges encompass an entire continent, including zero latitude and extending to north and south latitudes. In our data, these criteria are matched by the data from Rohde (1999) and Harcourt (2000).
cases, using midpoint as a latitudinal descriptor, we expected smaller ranges close to the limits of the sampled area and larger ranges in the centre of the sampled area independent of latitude. The expected null correlation between range size and midpoint in these data, considering only sampling boundaries, was quadratic with a peak in range sizes at intermediate sampling latitudes. All data sets of latitudinal distributions, except for Rohde (1999) and Harcourt (2000), were descriptions of latitudes ranging in a smaller scale than the entire continent and they were analyzed using this expected quadratic correlation.
Latitudinal distributions – linear correlation analysis
We calculated range size and mid-latitude for each species distribution in each data set as a function of latitude, for test the linear correlation between range size and latitude. Subsequently we calculated the correlation between range size and mid-latitude, using Pearson product-moment coefficient.
We randomized range size and mid-latitude using the two models proposed by Lyons & Willig (1997) both assuming hard boundaries: random and pseudo-random simulations, for create a random distribution. Random simulation randomized range size and mid-latitude, and pseudo-random simulation randomized only range sizes, with the midpoints having exactly the same distribution as in the real data. Pseudo-random simulations, therefore, were not completely stochastic because they maintained the empirical midpoints of species distributions.
coefficient was within the 95% limits of frequency distribution of the simulated coefficients, we accepted the null hypothesis that the correlation between range size and midpoint was the same as expected by chance alone (null assumptions assuming hard boundaries). Because this test is two-tailed, we accepted null hypothesis with p > 0.025. If the observed correlation coefficient was different from that produced by the simulation, we investigated why this difference occurred. There are two possible results: a positive or a negative correlation. If we observed a positive correlation between range size and mid-latitude, this represents smaller range sizes in lower latitudes and larger range sizes in higher latitudes than expected by chance, i.e. the expected Rapoport effect. However, even if we found a negative correlation, we had to test for the Rapoport effect, because a lower slope than expected by chance means smaller range sizes at lower latitudes and larger range sizes at higher latitudes, i.e. the expected Rapoport effect. We calculated the slope of correlation for the observed data sets, and for each simulated distribution, generating a frequency distribution of 1,000 simulated values. We then compared the observed slope with the frequency distribution of 1,000 simulated ones. If the observed slope was below the 95% limits of frequency distribution, we rejected the null hypothesis and accepted the existence of a Rapoport effect.
Latitudinal distributions – quadratic correlation analysis
y = a + bx + cx2
where y is range size, a, is the intercept, b, and c are equation parameters, and x is the mid-latitude.
The expected correlation follows a triangular distribution of points because the upper corners represent combinations of midpoints and range that are geometrically impossible (Colwell & Hurtt, 1994). The quadratic model was chosen because it was the simplest model describing a unimodal distribution.
We calculated r and a, b, and c parameters for all data sets with restricted latitudinal sampled areas (Sokal & Rohlf, 1981). We then simulated 1,000 random and 1,000 pseudo-random distributions and for each simulation we calculated the correlation coefficient, obtaining a frequency distribution of 1,000 coefficients, comparing each observed correlation coefficient with the 95% frequency distribution. If the observed coefficient was outside the 95% limits of the simulated frequency distribution coefficients, we rejected the null hypothesis that the correlation between range size and midpoint was the same as the one expected by chance alone (null assumptions assuming sampling boundaries) and we would investigate why these differences appeared.
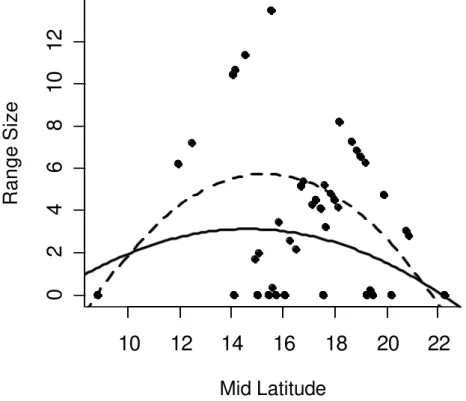
If there was a Rapoport effect, we would expect range sizes smaller than expected by chance in low latitudes and higher than expected by chance in high latitudes (Fig. 2). Therefore, to check for the Rapoport effect, we calculated a, b, and c parameters (Sokal & Rohlf, 1981) for each of the 1,000 simulations in each simulation model (random and pseudo-random) and compared the frequency distribution of 1,000 simulated values with that calculated for observed distributions.
Stevens (1992) also expected a positive correlation between range size and mid-altitude, but if we consider that the base and the top of mountains are hard boundaries (Colwell & Hurtt, 1994; Rahbek, 1997; Colwell & Lees, 2000; Sanders, 2002), the expected null correlation would also be quadratic with a peak in range sizes at intermediate altitudes (Fig. 3). At higher and lower altitudes, we expected smaller range sizes. This is the expected correlation for all our data of elevational distributions.
We used the same procedure as the one to test the quadratic correlation in latitudinal distributions to test if the correlation between range size and mid-altitude is different from that expected under the inclusion of hard boundaries.
Results
Latitudinal distributions
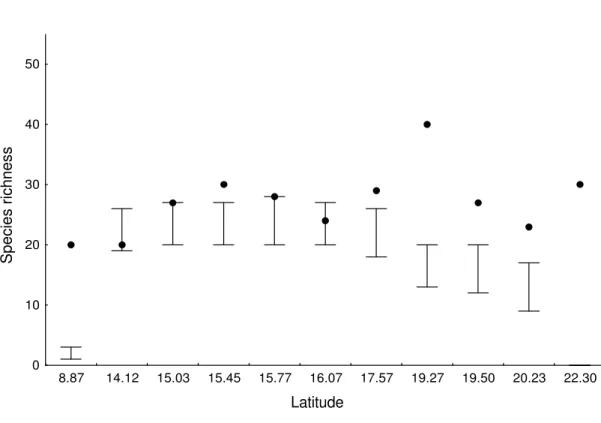
The coefficients of linear correlation between range size and mid-latitude were smaller than expected by chance in the two data distributions analyzed (Rohde, 1999; Harcourt, 2000), using the two methods of simulation (random and pseudo-random) (see Appendices S2 and S3 in Supplementary Material). However, the correlations showed range sizes larger than expected by chance at small latitudes and smaller than expected by chance at high latitudes (see Appendices S2 and S3 in Supplementary Material; Fig. 4). Because this pattern seems the opposite of the expected by the Rapoport effect, we called hereafter a reverse Rapoport, even though we have to consider that the real reverse Rapoport would be based on the average range size distributions (Stevens 1989)
results were observed: smaller range sizes at the boundaries, a reverse Rapoport and one Rapoport effect (see Appendices S2 and S3 in Supplementary Material; Fig. 5abc).
Elevational distributions
In the random simulations, 34 correlations were different from expected by chance (see Appendix S2 in Supplementary Material) and 10 were similar to that expected by chance. Among the 34 significant correlations, four supported a Rapoport effect (see Appendix S2 in Supplementary Material; Fig. 5c). Other results observed were: (i) parameters of the observed curves significantly equal to that obtained in the simulations (Fig. 5d); (ii) larger range sizes in all altitudes (Fig. 5e); (iii) smaller range sizes at the boundaries (Fig. 5a); and (iv) reverse Rapoport (Fig. 5b) (see Appendix S2 in Supplementary Material).
In the pseudo-random simulations, 25 correlations were different from that expected under null assumptions and 17 were similar to that expected by chance (see Appendix S3 in Supplementary Material). One was indicative of a Rapoport effect (Fig. 5c), and other results observed were: (i) parameters of the observed curves significantly equal to that obtained in the simulations (Fig. 5d); (ii) larger range sizes in all altitudes (Fig. 5e); (iii) smaller range sizes in all altitudes (Fig. 5f); (iv) smaller range sizes at the boundaries (Fig. 5a); (v) larger range sizes at the boundaries (Fig. 5g); and (vi) reverse Rapoport (Fig. 5b) (see Appendix S3 in Supplementary Material).
The results obtained using random and pseudo-random simulations to all data sets analysed were summarized in Figure 6.
Our results showed a weak evidence of a Rapoport effect because few of them were different from that expected under null assumptions. The five distributions showing Rapoport effect did not present any coincidence of gradient studied (latitude or altitude), hemisphere (South and North) and taxa. Therefore, even though some distributions did show a Rapoport effect, such an effect cannot be viewed as a general pattern in ecology. The idea that the Rapoport effect is not so spread is corroborated by the 10 distributions that showed a reverse Rapoport effect, with larger range sizes than expected by chance in lower midpoints, and smaller range sizes than expected by chance in higher midpoints. Some authors (Gaston et al., 1998; Gaston, 2003) already reported that geographic ranges of tropical species might, on average, be larger than in adjacent temperate regions.
The patterns found in distributions that were significantly different from the simulations could be explained by different biological mechanisms. The midpoint of species distributions may represent optimal conditions or the geographical centre of its evolutionary origin (Lyons & Willig, 1997), assuming non-directional dispersal movements. If range sizes were smaller than expected under the null assumptions, specialization may be a mechanism restricting species distributions, independent of latitude or altitude. By specialization here we mean every adaptation of the individuals that restricts their distribution that can be resources, environmental conditions or biological interactions, such as the presence of predators or competitors. Conversely, observed range sizes larger than expected by chance may indicate an absence of specific requirements of resources and environmental conditions.
especially if ranges are truncated more often at one end of the domain. For example, studies that examine range size in South Hemisphere are biased unless they eliminate the species whose ranges cross into the North Hemisphere. In those cases, ranges are more likely to be truncated in the north and ranges will pile up at the northern edge of the domain (sensu soft boundaries of Colwell & Hurtt, 1994). In this example, there will be significant deviations from the null model provided here, which are more related with a biased data sets than with biology. These significant deviations will always occur when a soft boundary is produced by the arbitrarily defined domain.
The data from Sklená & Jørgensen (1999) produced an interesting result, which is shown in Fig. 5h. The data show a monotonic decrease of range sizes with mid-altitude, instead of the usual triangular distribution. This may happen due to the presence of few species occurring only at low altitudes, which caused the loss of the left hand side of the triangle. Interestingly, the model we proposed captures this linear correlation even when we were expecting a quadratic relationship, changing the signals of the parameters a, b and c.
borders of the continent but actually the limits of latitudes in which they sampled (see the differences of approaches in Fig. 1). Following this reasoning, the expected correlation between range size and mid-latitude would be quadratic with larger range sizes in the middle latitudes of the sampled area and smaller range sizes close to the boundaries of the sampled area.
The large number of observed results in the random and pseudo-random simulations suggests the inexistence of a single pattern in the distribution of range sizes (Fig. 6). Results of random simulations changing to that expected by chance in pseudo-random simulations might evidence that several different environmental variables (such as climate or biome distribution) may influence the distribution of organisms (Hernández Fernández & Vrba 2005a, b). The absence of a single pattern in pseudo-random simulations may be a result of the inclusion of the specific geographic location of each species in the simulation. Randomness generated by the pseudo-random simulation would be more similar to real distributions, which increases the chance of finding results similar to that expected by chance alone. This may explain the higher proportion of results in which correlations were not significantly different from that expected under null assumptions in pseudo-random simulations (from 16 in random simulations to 27 in pseudo-random, compare Appendices S2 and S3 in Supplementary Material). Added to this change, we observed more distribution patterns in pseudo-random (six) than in pseudo-random (four) simulations (Fig. 6).
pattern that resembles that one expected by chance (Colwell et al., 2004), which is usually called a deterministic chaos (Bascompte & Solé, 1995). A different approach, with models incorporating such biological mechanisms and testing the responses of species distributions, is necessary to test such hypothesis.
The random simulations in the present study are identical to mid-domain effect (MDE) models, with a theoretical range size frequency distribution as discussed in Colwell et al. (2004) and Arita (2005). The pseudo-random simulations are essentially MDE midpoint re-sampling models, even though we used them for a different purpose here. MDE models have been initially suggested to study only one-dimensional distributions, such as those analyzed in the present study. However, more recent studies incorporated longitude in the models (Bokma & Mönkkönen, 2000; Bokma et al., 2001; Hawkins & Diniz-Filho 2002; Brayard et al. 2005) because species distributions are at least two-dimensional structures. We did not use two-dimensional distributions because the Rapoport effect is usually analyzed in one dimension (latitude, elevation or depth).
We concluded that most statistical methods used up to now to test for the Rapoport effect were not able to distinguish between stochastically and deterministically generated patterns. One of the most important parts of hypothesis testing in science is to make this distinction and to describe expected patterns under null assumptions. In our work, the Rapoport effect was found in few gradients analyzed. Furthermore, correlation between range size and midpoint was frequently similar to that expected under the null assumptions and, for that reason, there was no need to search for biological mechanisms in these specific correlations. Even though some recent studies have found a Rapoport effect (Fortes & Absalão, 2004; Arita et al., 2005; Folgarait et al., 2005), others authors (Rohde et al., 1993; Blackburn & Gaston, 1996; Rohde, 1996; Rohde & Heap, 1996; Ruggiero & Lawton, 1998; Gaston & Chown, 1999; Samyn & Tallon, 2005) claim that Rapoport’s rule is not widespread to be considered as a pattern in global ecology.
Acknowledgments. We thank of Sandra M. Soares for the initial ideas of this paper and
Supplementary Material
The following material is available online at www.blackwell-synergy.com/loi/geb
Appendix S1 Articles used in the analyses of the Rapoport effect
Appendix S2 Results of random simulations of the Rapoport effect
Appendix S3 Results of pseudo-random simulations of the Rapoport effect
References
Adolfo, G. & Navarro, S. (1992) Elevational distribution of birds in the Sierra Madre del Sur, Guerrero, Mexico. The Condor, 94, 29-39.
Alexander, G. & Hilliard Jr., J.R. (1969) Elevational and seasonal distribution of Orthoptera in the rocky mountains of Northern Colorado. Ecological Monographs, 39, 385-431.
Araújo, L.M. & Fernandes, G.W. (2003) Elevational patterns in a tropical ant assemblage and variation in species richness between habitats. Lundiana, 4,103-109. Arita, H.T. (2005) Range size in mid-domain models of species diversity. Journal of
Theoretical Biology, 232, 119-126.
Arita, H.T., Rodríguez, P. & Vázquez-Domínguez, E. (2005). Continental and regional ranges of North American mammals: Rapoport’s rule in real and null worlds. Journal of Biogeography, 32, 961-971.
Ashton, K.G. (2001) Are ecological and evolutionary rules being dismissed prematurely? Diversity and Distributions, 7, 289-295.
Bascompte, J. & Solé, R.V. (1995) Rethinking complexity: modelling spatiotemporal dynamics in ecology. Trends in Ecology and Evolution, 10, 361–366
latitudinally restricted Australian butterfly species in response to climate change. Global Change Biology, 8, 954-971.
Blackburn, T.M. & Gaston, K.J. (1996) Spatial patterns in the geographic range sizes of bird species in the New World. Philosophical Transactions of the Royal Society of London Series B, 351, 897-912.
Bokma, F. & Mönkkönen, M. (2000) The mid-domain effect and the longitudinal dimension of continents. Trends in Ecology and Evolution, 15, 288-289.
Bokma, F., Bokma, J. & Mönkkönen, M. (2001) Random processes and geographic species richness patterns: why so few species in the north? Ecography, 24, 43-49. Brayard, A., Escarguel, G. & Bucher, H. (2005) Latitudinal gradient of taxonomic
richness: combined outcome of temperature and geographic mid-domains effects? Journal of Zoological Systematics and Evolutionary Research, 43, 178-188.
Cardillo, M. (2002) The life-history basis of latitudinal diversity gradients: how do species traits vary from the poles to the equator? Journal of Animal Ecology, 71, 79-87.
Clausnitzer, V. & Kityo, R. (2001) Elevational distribution of rodents (Muridae and Gliridae) on Mt Elgon, Uganda. Tropical Zoology, 14, 95-118.
Colwell, R.K. & Hurtt, G.C. (1994) Nonbiological gradients in species richness and a spurious Rapoport effect. The American Naturalist, 144, 570-595.
Colwell, R.K., & Lees, D.C. (2000) The mid-domain effect: geometric constraints on the geography of species richness. Trends in Ecology and Evolution, 15, 70-76. Colwell, R.K., Rahbek, C. & Gotelli, N.J. (2004) The mid-domain effect and species
richness patterns: what have we learned so far? The American Naturalist, 163, E1-E23.
(Mammalia): null models under geometric and phylogenetic constraints. Brazilian Journal of Biology, 62, 437-444.
Fisher, B.L. (1996) Ant diversity patterns along an elevational gradient in the Réserve Naturelle Intégrale d' Andringitra, Madagascar. Fieldiana Zoology, 85, 93-108. Fisher, B.L. (1998) Ant diversity patterns along an elevational gradient in the Réserve
Spéciale d' Anjanaharibe-Sud and on the Western Masoala Peninsula, Madagascar. Fieldiana Zoology, 90, 39-67.
Fisher, B.L. (1999) Ant diversity patterns along an elevational gradient in the Réserve Naturelle Intégrale d' Andohahela, Madagascar. Fieldiana Zoology, 94, 129-147. Fleishman, E., Austin, G.T. & Weiss, A.D. (1998) An empirical test of Rapoport's rule:
elevational gradients in montane butterfly communities. Ecology, 79, 2482-2493. Folgarait, P.J., Bruzzone, O., Porter, S.D., Pesquero, M.A. & Gilbert, L.E. (2005)
Biogeography and macroecology of phorid flies that attack fire ants in south-eastern Brazil and Argentina. Journal of Biogeography, 32, 353-367.
Fortes, R.R. & Absalão, R.S. (2004) The applicability of Rapoport’s rule to the marine mollusks of the Americas. Journal of Biogeography, 31, 1909-1916.
Gagné, W.C. (1979) Canopy-associated arthropods in Acacia koa and Metrosideros tree communities along an elevational transect on Hawaii Island. Pacific Insects, 21, 56-82.
Gaston, K.J. (2003) The structure and dynamics of geographic ranges. Oxford University Press, Oxford.
Gaston, K.J. & Chown, S.L. (1999) Why Rapoport's rule does not generalise. Oikos, 84, 309-312.
Gathorne-Hardy, F., Syaukani, & P. Eggleton. 2001. The effects of altitude and rainfall on the composition of the termites (Isopteran) of the Leuser ecosystem (Sumatra, Indonesia). Journal of Tropical Ecology, 17, 379-393.
Gotelli, N.J. & Ellison, A.M. (2002) Biogeography at a regional scale: determinants of ant species density in New England bogs and forests. Ecology, 83, 1604-1609.
Harcourt, A.H. (2000) Latitude and latitudinal extent: a global analysis of the Rapoport effect in a tropical mammalian taxon: primates. Journal of Biogeography, 27, 1169-1182.
Hawkins, A.F.A. (1999) Elevational and latitudinal distribution of east Malagasy forest bird communities. Journal of Biogeography, 26, 447-458.
Hawkins, B.A. & Diniz-Filho, J.A.F. (2002). The mid-domain effect cannot explain the diversity gradient of Nearctic birds. Global Ecology and Biogeography, 11, 419-426. Heaney, L.R. (2001) Small mammal diversity along an elevational gradient in the
Philippines: an assessment of patterns and hypotheses. Global Ecology and Biogeography, 10, 15-39.
Hernández, C.E., Moreno, R.A. & Rozbaczylo, N. (2005) Biogeographical patterns and Rapoport’s rule in southeastern Pacific benthic polychaetes of the Chilean coast. Ecography, 28, 363-373.
Hernández Fernández, M. & Vrba, E.S. (2005a) Rapoport effect and biomic specialization in African mammals: revisiting the climatic variability hypothesis. Journal of Biogeography, 32, 903-918.
Hernández Fernández, M. & Vrba, E.S. (2005b) Body size, biomic specialization and range size of African large mammals. Journal of Biogeography, 32, 1243-1256. Hofer, U., Bersier, L. & Borcard, D. (1999) Spatial organization of a herpetofauna on an
Hortal-Muñoz, J., Martín-Piera, F. & Lobo, J.M. (2000) Dung beetle geographic diversity variation along a Western Iberian latitudinal transect (Coleoptera: Scarabaeidae). Annals of the Entomological Society of America, 93, 235-243.
Hosoda, H. (1999) Elevational occurrence of ground beetles (Coleoptera, Carabidae) on Mt. Kurobi, central Japan, with special reference to forest vegetation and soil characteristics. Pedobiologia, 43, 364-371.
Kikuta, T., Gunsalam, G., Kon, M. & Ochi, T. (1997) Elevational change of fauna, diversity and food preference of dung and carrion beetles on Mt. Kinabalu, Borneo. Tropics, 7, 123-132.
Kolasa, J., Hewitt, C.L. & Drake, J.A. (1998) Rapoport's rule: an explanation or a byproduct of the latitudinal gradient in species richness? Biodiversity and Conservation, 7, 1447-1455.
Koleff, P. & Gaston, K.J. (2001) Latitudinal gradients in diversity: real patterns and random models. Ecography, 24, 341-351.
Lees, D.C., Kremen, C. & Andriamampianina, L. (1999) A null model for species richness gradients: bounded range overlap of butterflies and other rainforest endemics in Madagascar. Biological Journal of the Linnean Society, 67, 529-584. Lobo, J.M. & Halffter, G. (2000) Biogeographical and ecological factors affecting the
elevational variation of mountainous communities of coprophagous beetles (Coleoptera: Scarabaeoidea): a comparative study. Annals of the Entomological Society of America, 93, 115-126.
Lyons, S.K. & Willig, M.R. (1997) Latitudinal patterns of range size: methodological concerns and empirical evaluations for New World bats and marsupials. Oikos, 79, 568-580.
species richness. Journal of Mammalogy, 84, 967-980.
McCain, C.M. (2004) The mid-domain effect applied to elevational gradients: species richness of small mammals in Costa Rica. Journal of Biogeography, 31, 19-31. MD. Nor, S. (2001) Elevational diversity patterns of small mammals on Mount
Kinabalu, Sabah, Malaysia. Global Ecology and Biogeography, 10, 41-62.
Moles, A.T. & Westoby, M. (2003) Latitude, seed predation and seed mass. Journal of Biogeography, 30, 105-128.
Mora, C. & Robertson, D.S. (2005) Causes of latitudinal gradients in species richness: a test with fishes of the tropical eastern pacific. Ecology, 86, 1771-1782.
Nathan, R. & Werner, Y.L. (1999) Reptiles and breeding birds on Mt. Hermon: patterns of elevational distribution and species richness. Israel Journal of Zoology, 45, 1-33. Ochoci ska, D. & Taylor, J.R.E. (2003) Bergmann´s rule in shrews: geographical
variation of body size in Palearctic Sorex species. Biological Journal of the Linnean Society, 78, 365-381.
Pagel, M.D., May, R.M. & Collie, A.R. (1991) Ecological aspects of the geographical distribution and diversity of mammalian species. The American Naturalist, 137, 791-815.
Parmesan, C., Gaines, S., Gonzalez, L., Kaufman, D.M., Kingsolver, J., Peterson, A.T. & Sagarin, R. (2005) Empirical perspectives on species borders: from traditional biogeography to global change. Oikos, 108, 58-75.
Poulsen, M.K. & Lambert, F.R. (2000) Elevational distribution and habitat preferences of forest birds on Halmahera and Buru, Indonesia: implications for conservation of Moluccan avifaunas. Ibis, 142, 566-586.
Reed, R.N. (2003) Interspecific patterns of species richness, geographic range size, and body size among New World venomous snakes. Ecography, 26, 107-117.
Rickart, E.A. (2001) Elevational diversity gradients, biogeography and the structure of montane mammal communities in the intermountain region of North America. Global Ecology and Biogeography, 10, 77-100.
Robertson, H.G. (2002) Comparison of leaf litter ant communities in woodlands, lowland forests and montane forests of north-eastern Tanzania. Biodiversity and Conservation, 11, 1637-1652.
Rohde, K. (1996) Rapoport's rule is a local phenomenon and cannot explain latitudinal gradients in species diversity. Biodiversity Letters, 3, 10-13.
Rohde, K. (1999) Latitudinal gradients in species diversity and Rapoport's rule revisited: a review of recent work and what can parasites teach us about the causes of the gradients? Ecography, 22, 593-613.
Rohde, K. & Heap, M. (1996) Latitudinal ranges of teleost fish in the Atlantic and Indo-pacific oceans. The American Naturalist, 147, 659-665.
Rohde, K., Heap, M. & Heap, D. (1993) Rapoport's rule does not apply to marine teleosts and cannot explain latitudinal gradients in species richness. The American Naturalist, 142, 1-16.
Ruggiero, A. & Lawton, J.H. (1998) Are there latitudinal and elevational Rapoport effects in the geographic ranges of Andean passerine birds? Biological Journal of the Linnean Society, 63, 283-304.
Samson, D.A., Rickart, E.A. & Gonzales, P.C. (1997) Ant diversity and abundance along an elevational gradient in the Philippines. Biotropica, 29, 349-363.
Sánchez-Cordero, V. (2001) Elevation gradients of diversity for rodents and bats in Oaxaca, Mexico. Global Ecology and Biogeography, 10, 63-76.
Sanders, N.J. (2002) Elevational gradients in ant species richness: area, geometry, and Rapoport's rule. Ecography, 25, 25-32.
Sanders, N.J., Moss, J. & Wagner, D. (2003) Patterns of ant species richness along elevational gradients in an arid ecosystem. Global Ecology and Biogeography, 12, 93-102.
Sfenthourakis, S. (1992) Elevational effect on species richness of Oniscidea (Crustacea; Isopoda) on three mountains in Greece. Global Ecology and Biogeography, 2, 157-164.
Shepherd, U.I. & Kelt, D.A. (1999) Mammalian species richness and morphological complexity along an elevational gradient in the arid southwest. Journal of Biogeography, 26, 843-855.
Sklená , P. & Jørgensen, P.M. (1999) Distribution patterns of páramo plants in Ecuador. Journal of Biogeography, 26, 681-691.
Smith, K.F. & Gaines, S.D. (2003) Rapoport's bathymetric rule and the latitudinal species diversity gradient for Northeast Pacific fishes and Northwest Atlantic gastropods: evidence against a causal link. Journal of Biogeography, 30, 1153-1159. Sokal, R.R. & Rohlf, F.J. (1981) Biometry – The principles and practice of statistics in
biological research. W.H. Freeman and Company, New York.
Stephenson, S.L., Novozhilov, Y.K. & Schnittler, M. (2000) Distribution and ecology of myxomycetes in high-latitude regions of the Northern Hemisphere. Journal of Biogeography, 27, 741-754.
Stevens, G.C. (1992) The elevational gradient in elevational range: an extension of Rapoport's latitudinal rule to altitude. The American Naturalist, 140, 893-911.
Taylor, P.H. & Gaines, S.D. (1999) Can Rapoport's rule be rescued? Modelling causes of the latitudinal gradient in species richness. Ecology, 80, 2474-2482.
Willig, M.R., Kaufman, D.M. & Stevens, R.D. (2003) Latitudinal gradients of biodiversity: patterns, process, scale, and synthesis. Annual Review of Ecology, Evolution and Systematics, 34, 273-309.
Wolf, J.H.D. (1993) Diversity patterns and biomass of epiphytic bryophytes and lichens along an elevational gradient in the northern Andes. Annals of the Missouri Botanical Garden, 80, 928-960.
Biosketches
Carla R. Ribas is at the Universidade Federal de Viçosa finishing her Ph.D. in Entomology and she is an associate professor and researcher at the Laboratory of Community Ecology. Her main interest is in ant community ecology.
José H. Schoereder is professor of ecology at the Universidade Federal de Viçosa and
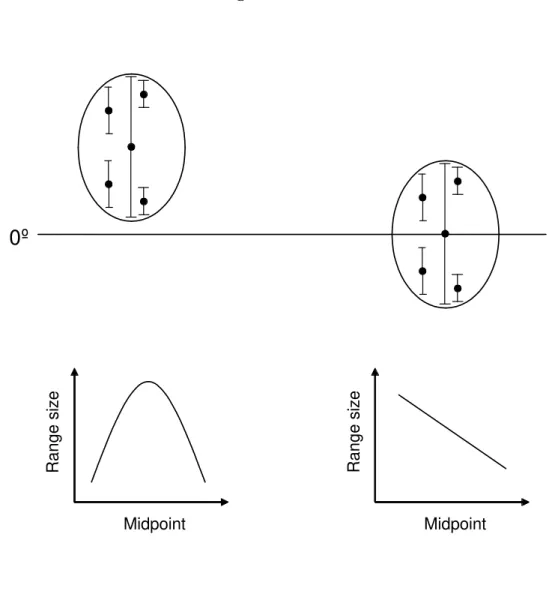
Figure 1 – Lower drawings represent the expected relationship between range sizes (lines) and mid-latitude (circles) in two possible cases of species distribution (upper drawings). On the left side, a distribution that does not cross the equator (0º) produces a unimodal expected relationship between the variables, because increasing or decreasing the latitude from the midpoint of the distribution decreases range sizes. On the right side, a linear correlation is expected because the distribution crosses the equator, and the increase in latitude corresponds to a decrease in range sizes.
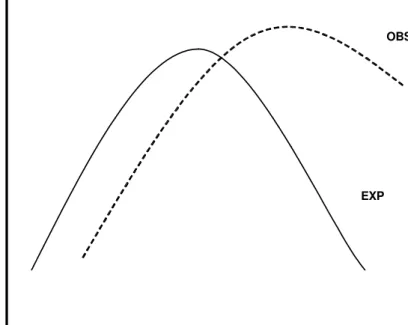
Figure 2 – Representation of correlation between range size and midpoint. The solid line represents the expected correlation (EXP) considering the null assumptions. The dashed line represents the correlation under the Rapoport effect (OBS): smaller range sizes in small latitudes/altitudes and larger range sizes in high latitudes/altitudes.
Figure 3 – Representation of range sizes (lines) and mid-altitude (circles). In elevational distributions, defined by two hard boundaries (the base and the top of mountains), range sizes should be smaller close to these boundaries and larger in the centre of the domain, by chance alone. These constraints produce a unimodal relationship between range size and mid-altitude (right hand side).
Figure 5 – Examples of results found of correlations between range size and midpoint. Dashed lines represent the expected correlations considering the null assumptions. Solid lines represent the observed correlations. a) Smaller range sizes at the boundaries of distribution (Adolfo & Navarro, 1992); b) Reverse Rapoport effect (Samson et al., 1997); c) Rapoport effect (Gotelli & Ellison, 2002 – forest); d) Parameters of the observed curves significantly equal to that obtained in the simulations (Fisher, 1996); e) Larger range sizes (Nathan & Werner, 1999 - reptiles); f) Smaller range sizes (Wolf, 1993 – lichens); g) Larger range sizes at the boundaries of the distribution (Wolf, 1993 - bryophytes); h) Linear correlation (Sklená & Jørgensen, 1999).
0º
Midpoint
Range
size
Midpoint
Range
OBS
EXP Range
Size
Mountain top
Mountain base Midpoint
Range
OB
EXP Range
Size
(b)
(c)
(d)
(e)
(f)
(g)
(h)
(a)
Midpoint
Range
Random Pseudo
Results of simulations
Frequency
0 6 12 18 24 30
Appendix S1 – Data used in the analyses of the Rapoport effect, and number of taxa distributions described (Distributions used). Some authors have analysed the Rapoport effect (Fleishman et al., 1998; Rohde, 1999; Harcourt, 2000; McCain, 2003). From these, McCain (2003) did not find a Rapoport effect, Rohde (1999) found a reverse Rapoport effect, and the other two papers described Rapoport effects.
Authors Gradient Taxa Distributions
used
Range limits
Adolfo & Navarro (1992) Altitude Birds 1 680-3100 m Alexander & Hilliard Jr. (1969) Altitude Orthoptera 1 1530-4265 m Araújo & Fernandes (2003) Altitude Ants 1 800-1500 m Beaumont & Hughes (2002) Latitude Butterflies 1 9.6-43.6 degrees Clausnitzer & Kityo (2001) Altitude Rodents 1 2875-4120 m
Fisher (1996) Altitude Ants 1 785-2000 m
25-1015 m
Fisher (1998) Altitude Ants 2
875-1985 m
Fisher (1999) Altitude Ants 1 430-1250 m
Fleishman et al. (1998) Altitude Butterflies 1 1900-3260 m
Gagné (1979) Altitude Arthropods 1 15-2400 m
Gathorne-Hardy et al. (2001) Altitude Termites 1 20-1400 m
Altitude 1-543 m
Gotelli & Ellison (2002)
Latitude
Ants 4
42-44.95 degrees Harcourt (2000) Latitude Primates 1 21 S - 41 N degrees
Hawkins (1999) Altitude Birds 1 20-2200 m
1100-2700 m 475-1750 m
Heaney (2001) Altitude Mammals 3
300-950 m Hofer et al. (1999) Altitude Amphibians and
Reptiles
Hortal-Muñoz et al. (2000) Altitude Beetles 1 75-1200 m
Hosoda (1999) Altitude Beetles 1 1100-1720 m
Kikuta et al. (1997) Altitude Beetles 1 550-1950 m
Altitude 0-2050 m
Lees et al. (1999)
Latitude Butterflies 2 12.5-25 degrees Lobo & Halffter (2000) Altitude Beetles 1 1900-3300 m
McCain (2003) Latitude Rodents 1 19-45 degrees
McCain (2004) Altitude Mammals 1 0-1800 m
MD. Nor (2001) Altitude Mammals 1 700-3200 m
10.7-43.07 degrees 27-63.27 degrees 25-51 degrees Moles & Westoby (2003) Latitude Plants 4
37.53-46.43 degrees 100-2800 m Nathan & Werner (1999) Altitude Reptiles and Birds 2
300-2800 m Ochoci ska & Taylor (2003) Latitude Shrews 1 44.12-69.47
degrees Poulsen & Lambert (2000) Altitude Birds 1 0-2060 m
Rickart (2001) Altitude Mammals 1 1220-3745 m
Robertson (2002) Altitude Ants 1 300-1850 m
Rohde (1999) Latitude Scombrids 1 45 S-45.8 N
degrees Samson et al. (1997) Altitude Ants 1 250-1750 m
2 720-2450 m 1 750-2950 m Sánchez-Cordero (2001) Altitude Rodents and Bats
Stephenson et al. (2000) Latitude Myxomycetes 1 34.43-77 degrees Wolf (1993) Altitude Bryophytes and
Lichens
Appendix S2 – Results of random simulations of the Rapoport effect. The Non-significant correlations are those in which the results of comparisons between the observed correlation coefficient and that expected under null assumptions were non-significant. The
Parameter analysis columns show the results of comparisons between the parameters of the observed curves with that expected under null assumptions. Studies are ordered first by type of gradients (latitude or altitude), correlations (linear and quadratic), then alphabetically by author.
Parameter analysis
Authors Non-significant
correlations Chance Larger
ranges
Smaller ranges at boundaries
Reverse
Rapoport Rapoport
Latitudinal distributions – linear correlations
Harcourt (2000) X
Rohde (1999) X
Latitudinal distributions – quadratic correlations
Beaumont & Hughes (2002) X
Gotelli & Ellison (2002) – bog distribution X
Gotelli & Ellison (2002) – forest distribution X
Lees et al. (1999) X
McCain (2003) X
Moles & Westoby (2003) – Australia X Moles & Westoby (2003) - Eastern North America X Moles & Westoby (2003) - New Zealand X Moles & Westoby (2003) - North America X Ochoci ska & Taylor (2003) X Stephenson et al. (2000) X
Elevational distributions – quadratic correlations
Adolfo & Navarro (1992) X
Alexander & Hilliard Jr. (1969) X
Clausnitzer & Kityo (2001) X
Fisher (1996) X
Fisher (1998) – Masoala Peninsula distribution X Fisher (1998) – RS d’ Anjanaharibe-Sud distribution X
Fisher (1999) X
Fleishman et al. (1998) X
Gagné (1979) X
Gathorne-Hardy et al. (2001) X
Gotelli & Ellison (2002) – bog distribution X
Gotelli & Ellison (2002) – forest distribution X
Hawkins (1999) X
Heaney (2001) – Mt. Isarog distribution X Heaney (2001) – Mt. Kitanglad distribution X
Heaney (2001) – Mt. Pangasugan distribution X
Hofer et al. (1999) – amphibians distribution X Hofer et al. (1999) – reptiles distribution X
Hortal-Muñoz et al. (2000) X
Hosoda (1999) X
Kikuta et al. (1997) X
Lees et al. (1999) X
Lobo & Halffter (2000) X
McCain (2004) X
MD. Nor (2001) X
Nathan & Werner (1999) – birds distribution X Nathan & Werner (1999) – reptiles distribution X
Poulsen & Lambert (2000) X
Rickart (2001) X
Robertson (2002) X
Samson et al. (1997) X
distribution
Sánchez-Cordero (2001) – Sierra Mazateca rodents distribution
X Sánchez-Cordero (2001) – Sierra Mixteca bats
distribution
X Sánchez-Cordero (2001) – Sierra Mixteca rodents
distribution
X
Sanders et al. (2003) X
Sfenthourakis (1992) X
Shepherd & Kelt (1999) X
Sklená & Jørgensen (1999) X
Wolf (1993) – bryophytes distribution X
Appendix S3 –Results of pseudo-random simulations of the Rapoport effect. The Non-significant correlations are those in which the results of comparisons between the observed correlation coefficient and that expected under null assumptions were non-significant. The Parameter analysis columns show the results of comparisons between the parameters of the observed curves with that expected under null assumptions. Studies are ordered first by type of gradients (latitude or altitude), correlations (linear and quadratic), then alphabetically by author.
Parameter analysis
Authors Non-significant
correlations Chance
Smaller ranges at boundaries Larger ranges at boundaries Smaller ranges Larger ranges Reverse
Rapoport Rapoport
Latitudinal distributions – linear correlations
Harcourt (2000) X
Rohde (1999) X
Latitudinal distributions – quadratic correlations
Beaumont & Hughes (2002) X Gotelli & Ellison (2002) – bog distribution X
Gotelli & Ellison (2002) – forest distribution X
Lees et al. (1999) X
McCain (2003) X
Moles & Westoby (2003) – Australia X Moles & Westoby (2003) - Eastern North
America
Elevational distributions – quadratic correlations
Adolfo & Navarro (1992) X
Alexander & Hilliard Jr. (1969) X
Araújo & Fernandes (2003) X Clausnitzer & Kityo (2001) X
Fisher (1996) X
Fisher (1998) – Masoala Peninsula distribution
X Fisher (1998) – RS d’ Anjanaharibe-Sud
distribution
X
Fisher (1999) X
Fleishman et al. (1998) X
Gagné (1979) X
Gathorne-Hardy et al. (2001) X
Gotelli & Ellison (2002) – bog distribution X Gotelli & Ellison (2002) – forest distribution X
Hawkins (1999) X
Heaney (2001) – Mt. Isarog distribution X Heaney (2001) – Mt. Kitanglad distribution X
Heaney (2001) – Mt. Pangasugan distribution X
Hofer et al. (1999) – amphibians distribution X Hofer et al. (1999) – reptiles distribution X
Hortal-Muñoz et al. (2000) X
Hosoda (1999) X
Kikuta et al. (1997) X
Lees et al. (1999) X
Lobo & Halffter (2000) X
McCain (2004) X
Nathan & Werner (1999) – birds distribution X Nathan & Werner (1999) – reptiles
distribution
X
Poulsen & Lambert (2000) X
Rickart (2001) X
Robertson (2002) X
Samson et al. (1997) X
Sánchez-Cordero (2001) – Sierra Mazateca bats distribution
X Sánchez-Cordero (2001) – Sierra Mazateca
rodents distribution
X Sánchez-Cordero (2001) – Sierra Mixteca
bats distribution
X Sánchez-Cordero (2001) – Sierra Mixteca
rodents distribution
X Sanders et al. (2003) X
Sfenthourakis (1992) X
Shepherd & Kelt (1999) X
Sklená & Jørgensen (1999) X
Wolf (1993) – bryophytes distribution X
Spatial scale dependence of a reverse latitudinal gradient in arboreal
ant species richness
Carla R. Ribas1,2, José H. Schoereder2 and Carlos F. Sperber2
1. Programa de Pós-Graduação em Entomologia; Departamento de Biologia Animal; Universidade Federal de Viçosa; Viçosa – MG; Brazil; [email protected]
2. Departamento de Biologia Geral; Universidade Federal de Viçosa; Viçosa – MG; Brazil; [email protected] and [email protected]
Corresponding author: José H. Schoereder; Departamento de Biologia Geral, Universidade Federal de Viçosa, Av. P.H. Rolfs, s/n, Viçosa – MG, 36570-000, Brazil. Phone: +55.31.3899.4003, FAX: +55.31.3899.2549, e-mail: [email protected]
Abstract
In this study, we do not attempt to answer the question why there are more species in the tropics, but to test the existence of a latitudinal gradient in ant species richness, and test factors responsible for it. We sampled ants and measured environmental variables (habitat productivity and heterogeneity) in the Cerrado (Brazilian savannah) at three spatial scales: trees, plots and sites. Contrary to expectation, ant species richness (alpha diversity) increased with latitude at the spatial scales of trees and plots. Beta diversity, measured as the difference in species composition among trees within plots and among plots within sites, did not vary with latitude or with environmental variables. Habitat productivity (estimated as tree biomass), resource heterogeneity (estimated as tree species richness), and structural heterogeneity (estimated as the coefficient of variation of distances among trees) did not correlate significantly with alpha or beta diversity at any spatial scale. Different patterns of gradients in species richness were possibly linked to the spatial scale studied. The reverse latitudinal gradient in alpha species richness was possibly caused by the Cerrado geographical distribution or by the evolutionary history of ant species. At the larger spatial scale sites, the absence of correlation between alpha diversity and latitude might have been caused by the small number of samples. Unsaturated communities may account for the absence of correlation between beta diversity and latitude. We demonstrate that latitudinal gradients can be found even with small latitudinal variation, but these gradients may be the reverse of global gradients. We conclude that processes acting at local spatial scales can lead to local variations in species richness that do not scale up to global patterns. Thus, studies performed at a global scale may overlook important regional variation in determinants of diversity.
Introduction
The astonishing species diversity of the tropics is widely recognized, but its causes remain controversial (Hawkins and Agrawal 2005). Willig et al. (2003) reviewed more than 30 hypotheses on the processes that could explain this latitudinal gradient in species richness (LGSR). Among these hypotheses, they considered habitat productivity or ambient energy as potential factors to explain the LGSR, and some recent studies have considered this hypothesis (Turner 2004; Bjorholm et al. 2005; Brayard et al. 2005; Mora and Robertson 2005; Rex et al. 2005).
Although habitat productivity or ambient energy is often presented as a hypothesis, it is actually not a mechanism that explains the latitudinal gradient, but a factor that correlates with latitude (Hawkins and Diniz-Filho 2004). The most commonly used estimates for productivity are plant biomass (Braschler et al. 2004; Grughy et al. 2005), evapotranspiration (Rangel and Diniz-Filho 2005), net primary productivity (Cleland et al. 2004), the normalized difference of vegetation index (Bailey et al. 2004), and temperature (Brayard et al. 2005). A positive correlation between species richness and energy estimates has been reported for different taxa (Mittelbach et al. 2001; Evans et al. 2005), independent of which estimate of energy is used. Some factors, such as increased population size, niche position and diversification rate, may appear to contribute frequently to the correlation between species richness and energy estimates at macro-scale (for further discussion of these mechanisms, see Evans et al. 2005).
heterogeneity usually concerns variation in the environmental conditions in which the organisms live, associated to abiotic characteristics of their habitat. Resource heterogeneity refers to variations in resource types available to the organisms, and can be associated to abiotic or biotic characteristics of the habitat. An increase in habitat heterogeneity might allow a higher number of species to coexist (Tilman and Pacala 1993), and this correlation can be found repeatedly in the ecological literature (Roth 1976; Reed 1978; Bell et al. 2000; Bestelmeyer and Wiens 2001; Ribas et al. 2003; Sperber et al. 2004; Tews et al. 2004). Additional to the fact that habitat heterogeneity is also a latitudinal correlate, it is left unexplained why there is more heterogeneity in the tropics (Rohde 1999).
Invertebrates have been recognized as better habitat indicators than vertebrates for evaluation of conservation priorities and for monitoring biodiversity, because they are abundant, relatively easy to sample, and respond relatively fast to habitat modifications (Lewinsohn et al. 2005). Ants are described as particularly suitable organisms for these purposes because they are affected by habitat characteristics such as resource diversity (Armbrecht et al. 2004), climatic variables (Folgarait et al. 2005), vegetation structure (Crist and Wiens 1994), habitat productivity (Kaspari 2005), habitat diversity and complexity (Armbrecht et al. 2005). Although ants show the LGSR in some habitats, there are few studies, to our knowledge, (Farji-Brener and Ruggiero 1994; Majer et al. 2001; Johnson and Ward 2002; Kaspari et al. 2004) on the Southern hemisphere that tested hypotheses to explain this pattern.
Our specific aim was to test: (i) the existence of a latitudinal gradient in species richness in arboreal ants in the Cerrado, (ii) whether the gradient is correlated with habitat productivity, resource heterogeneity and structural heterogeneity, and (iii) what is the influence of spatial scale on the LGSR and its correlates.
Material and methods
Study sites
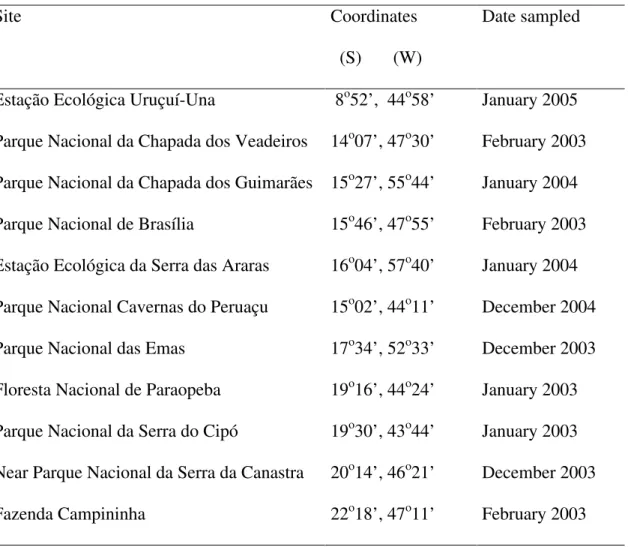
(Goodland 1971). In Central Brazil, the Cerrado covers an area of about 1.800.000 km2 (Ratter 1992; Câmara 1993). The rainy season is from September to April with around 1500 mm of rainfall, and the dry season is during the coldest months of the year (May to August) (Goodland 1971). We carried out the fieldwork at 11 sites consisting of conservation units in the Cerrado biome in Brazil between 8º and 22ºS latitude (Table 1).
Sampling design- latitudinal gradient and spatial scales
We sampled arboreal ants using pitfall traps baited with sardine and honey. The pitfall traps were plastic containers (diameter 19 cm, height 11 cm) with an inner receptacle containing the bait. Ants attracted by the bait fell into a 5% detergent plus salt solution. Traps were tied to tree stems at a height of ca. 1.3 m and remained in the field for 48h. Samplings were always carried out during the rainy season (December, January and February in three consecutive years 2003, 2004 and 2005) (Table 1), because ants are more abundant in this season. Ants were identified to genera according to Bolton (1994; 2003). Whenever possible, we identified the ants to species level by comparison to the reference collection of the Community Ecology Lab of the Federal University of Viçosa. When species identification was not possible, we sorted ants according to their external morphology. Voucher specimens are deposited in the above reference collection.