AMTD
6, 519–546, 2013A comparison of rainfall measurements by multiple instruments
X. C. Liu et al.
Title Page
Abstract Introduction
Conclusions References
Tables Figures
◭ ◮
◭ ◮
Back Close
Full Screen / Esc
Printer-friendly Version
Interactive Discussion
Discussion
P
a
per
|
Dis
cussion
P
a
per
|
Discussion
P
a
per
|
Discussio
n
P
a
per
|
Atmos. Meas. Tech. Discuss., 6, 519–546, 2013 www.atmos-meas-tech-discuss.net/6/519/2013/ doi:10.5194/amtd-6-519-2013
© Author(s) 2013. CC Attribution 3.0 License.
Atmospheric Measurement Techniques Discussions
This discussion paper is/has been under review for the journal Atmospheric Measurement Techniques (AMT). Please refer to the corresponding final paper in AMT if available.
A comparison of rainfall measurements
by multiple instruments
X. C. Liu, T. C. Gao, and L. Liu
College of Meteorology and Oceanography, PLA University of Science and Technology, Nanjing, China
Received: 3 December 2012 – Accepted: 7 January 2013 – Published: 16 January 2013 Correspondence to: L. Liu ([email protected])
AMTD
6, 519–546, 2013A comparison of rainfall measurements by multiple instruments
X. C. Liu et al.
Title Page
Abstract Introduction
Conclusions References
Tables Figures
◭ ◮
◭ ◮
Back Close
Full Screen / Esc
Printer-friendly Version
Interactive Discussion
Discussion
P
a
per
|
Dis
cussion
P
a
per
|
Discussion
P
a
per
|
Discussio
n
P
a
per
|
Abstract
Simultaneous observations of rainfall collected by a tipping bucket rain gauge, a weigh-ing bucket rain gauge, an optical rain gauge, a present weather detector, a Joss– Waldvogel disdrometer, and a 2-D video disdrometer during January to October 2012 were analyzed to evaluate how accurately they measure rainfall and drop size dis-5
tributions (DSDs). For the long-term observations, there were different discrepancies in rain amounts from six instruments in the order of 0 to 27.7 %. The ORG, JWD, and 2DVD underestimated, and the TBRG overestimated the rain rate whenR <20 mm h−1; the TBRG agreed well with the reference values, while the PWD and 2DVD overesti-mated, WRG and JWD underestimated the rain rate whenR >20 mm h−1. The TBRG 10
and WRG underestimated more than 50 % of rainfall duration substantially in the light rainfall, ORG underestimated the rainfall duration for about 12.7 %, while the JWD and 2DVD overestimated the rainfall duration for more than 30 %. The overall DSDs of JWD and 2DVD agreed well with each other, while the JWD had a higher volume mean diameter, lower raindrop numbers and liquid water content than that of 2DVD. The 15
overestimation of small-size drops (D <1 mm) and underestimation of very large-size drops (D >4 mm) by JWD suggests the JWD’s inaccuracy of measurement of small-size drops and very large-small-size drops; the underestimation of small raindrops by 2DVD suggested that DSDs in the heavy rainfall by 2DVD should be handled carefully.
1 Introduction
20
Measurements of precipitation have been widely applied in meteorology, hydrology, environmental, agricultural, and soil sciences. There are many instruments available to measure precipitation; conventional rain gauge is the most widely used instrument in the world wide, which can only measure the precipitation intensity and duration. With the development of optical and electronic techniques since 1970s, a variety of 25
AMTD
6, 519–546, 2013A comparison of rainfall measurements by multiple instruments
X. C. Liu et al.
Title Page
Abstract Introduction
Conclusions References
Tables Figures
◭ ◮
◭ ◮
Back Close
Full Screen / Esc
Printer-friendly Version
Interactive Discussion
Discussion
P
a
per
|
Dis
cussion
P
a
per
|
Discussion
P
a
per
|
Discussio
n
P
a
per
|
the size, shape, velocity of precipitation particles. In particular, the disdrometer that can measure the drop size distributions (DSDs) have been widely used in the cloud modeling and climate studies, rainfall estimation by radar, hydrological modeling, soil erosion, and etc. Although the comparative observations with the disdrometers and rain gauge verify the accuracy of rain rate measured by disdrometers, there’s no ref-5
erence instrument that can obtain the true values, nor standard environment that can simulate the precipitation, the DSD, number concentration, and other micro-physical variables of precipitation measured by different instruments show different discrepan-cies (Chandrasekar and Gori, 1991; Tokay et al., 2001, 2003; L ¨ohnert et al., 2011), which makes it difficult to the effective application of micro-physical data of precipita-10
tion.
At present, the Joss–Waldvogel disdrometer (JWD), 2-D video disdrometer (2DVD), and OTT PARSIVEL disdrometer are the most widely used disdrometers for compar-isons and validations of weather radar (Sheppard and Joe, 1994; Schuur et al., 2001; Thurai et al., 2009) and TR MM (Baquero et al., 2005; Wolff et al., 2005), but the 15
accuracy of measurements are still been under examination. There are significant dis-crepancies in rainfall amounts from JWD and rain gauges in the order of 10 to 20 % (Sheppard and Joe, 1994; Tokay et al., 2003), and the JWD underestimated the num-ber concentration of small drops (Caracciolo et al., 2002). The 2DVD had a better agreement with the rain gauges, but it underestimated small to medium drops (Tokay 20
et al., 2001). The 2DVD and OTT PARSIVEL disdrometer had close agreement in DSD parameters whenR was less than 20 mm h−1, while the mass-weighted mean diame-ter, the standard deviation of the mass-spectrum, and the rainrate of PARSIVEL were higher than that of 2DVD when rainrate was particularly above 30 mm h−1(Thurai et al., 2011).
25
AMTD
6, 519–546, 2013A comparison of rainfall measurements by multiple instruments
X. C. Liu et al.
Title Page
Abstract Introduction
Conclusions References
Tables Figures
◭ ◮
◭ ◮
Back Close
Full Screen / Esc
Printer-friendly Version
Interactive Discussion
Discussion
P
a
per
|
Dis
cussion
P
a
per
|
Discussion
P
a
per
|
Discussio
n
P
a
per
|
October 2012. The rainfall observations are from a tipping bucket rain gauge, a weigh-ing rain gauge, an optical rain gauge, a present weather detector, the DSD observations are from a Joss–Waldvogel disdrometer, and a 2-D video disdrometer. In this paper, a brief description of each instrument can be found in Sect. 2. Section 3 summarizes the general rainfall events, overall comparisons of rain rate and duration by different in-5
struments are analyzed, and selected events are analyzed in details minute by minute. Parameters of drop size distribution observed by JWD and 2DVD are calculated and compared, and their characteristics and differences are discussed. Conclusive remarks are given in the last section.
2 Instruments description
10
2.1 Rain gauge
The tipping bucket rain gauge (TBRG for short) is a siphon-controlled tipping bucket rain gauge (RIMCO 7499 Series). Any rain falling on the collecting funnel is di-rected through a siphon control unit and discharges as a steady stream into a two-compartment bucket mounted in unstable equilibrium. The volume of each compart-15
ment bucket is equivalent to a rainfall of 0.2 mm, therefore the precision and resolu-tion is one full bucket (0.2 mm), and the uncertainty is ±0.2 mm under 250 mm h−1. The main source of the TBRG sampling error is its sampling principle and its inabil-ity to capture the small temporal variations during the rainfall time series (Habib et al., 2001). There are substantial errors in the 1-min estimates especially at low rain rate, as 20
the time scale of the rainfall increases, the error decreases substantially (Wang et al., 2008).
The weighing rain gauge (WRG for short) operates on the principle of weighing the rainwater collected by the buckets. The rain rate can be calculated by the difference in rainwater accumulation over a given time interval. The accuracy of the rain rate 25
AMTD
6, 519–546, 2013A comparison of rainfall measurements by multiple instruments
X. C. Liu et al.
Title Page
Abstract Introduction
Conclusions References
Tables Figures
◭ ◮
◭ ◮
Back Close
Full Screen / Esc
Printer-friendly Version
Interactive Discussion
Discussion
P
a
per
|
Dis
cussion
P
a
per
|
Discussion
P
a
per
|
Discussio
n
P
a
per
|
rainwater drains from the catchment basin into the measurement chamber, and the sampling interval (Nystuen, 1999). however, rainfall measurement is invalid during the collecting pan drains when the collecting pan fills with water.
The optical rain gauge (ORG for short) measures the scintillation of infrared light pro-duced by the liquid water drops falling between a light source and a receiver (Nystuen 5
et al., 1996). The variation of light intensity caused by a given drop is a function of drop size, fall velocity, shape, and coherence of the light source. However, limited by the measurement principle, the ORG should not be used for frozen precipitation particles. The Model ORG-815 has a precision of 0.1 mm and an uncertainty of±0.1 mm h−1 in this study. Compared with the other gauges, the ORG overestimates rain rate when 10
there are more small drops, and underestimates rain rate when there are more large drops, it might bias high during higher winds (Nystuen, 1999).
2.2 Present weather detector
The present weather detector (PWD for short) is a multi-variables sensor for automatic weather observing systems. The Model Vaisala PWD22 combines an optical sensor 15
for visibility, a capacitive device Vaisala RAINCAP® rain sensor with double-plate for precipitation and a Pt100 thermistor for temperature, these three independent mea-surements together provide prevailing visibility, precipitation, and present weather type (January 2004).
The precipitation intensity is based on both the optical and capacitive measurements. 20
Optical precipitation intensity is proportional to the volume of particles, as an adjustable parameter; capacitive precipitation intensity is calculated by RAINCAP®data, of which the signal is proportional to the rain amount on the sensing surfaces. The capacitive intensity is higher than the optical intensity in liquid precipitation, PWD multiplies the optical intensity with a scaling factor to get the water equivalent intensity in frozen 25
AMTD
6, 519–546, 2013A comparison of rainfall measurements by multiple instruments
X. C. Liu et al.
Title Page
Abstract Introduction
Conclusions References
Tables Figures
◭ ◮
◭ ◮
Back Close
Full Screen / Esc
Printer-friendly Version
Interactive Discussion
Discussion
P
a
per
|
Dis
cussion
P
a
per
|
Discussion
P
a
per
|
Discussio
n
P
a
per
|
2.3 Joss–Waldvogel disdrometer
The Joss–Waldvogel disdrometer (JWD for short) was originally developed by Joss and Waldvogel (1967) to measure radar reflectivity (Tokay et al., 2003), which is an impact type device and measures the drop size by a styrofoam cone with a sampling cross-sectional area of 50 cm2. The JWD’s output is proportional to the size and fall velocity 5
of the impacting drops, and the drops’ size can be retrieved based on an assumption of the relationship between diameter and fall velocity in still air (Tokay et al., 2001). The Model RD-80 were used in this study, the drops are sorted into 20 size intervals ranging from 0.3 to 5.4 mm, and the boundaries of each channel increase with drop size from 0.1 to 0.5 mm.
10
It should be noted that the accuracy of JWD is sensitive to background noise; it could underestimate the small raindrops in heavy rain when the Styrofoam cone is hit by much more drops (Tokay et al., 2001). Since the largest size of the JWD is 5.4 mm, any drops larger than 5.4 mm would be counted in the largest size, which causes an underestimation of rain rate in heavy rain. Velocities of raindrops can diverge from the 15
assumed empirical fall speed in the presence of updrafts and downdrafts, causing an underestimation or overestimation of drop size.
2.4 2-D video disdrometer
2-D video disdrometer (2DVD for short) comprises of two light sources and two CCD line-scan cameras with 34.1 kHz rate perpendicular to each other, two light 20
sheets spaced 6.2 mm vertically form the virtual measurement area (10 cm×10 cm) (Kruger and Krajewski, 2002). Three-dimensional shape information of particles can be recorded when it passing the sampling area, based on which the shape, size, vol-ume, equivalent drop diameter, and oblateness can be calculated. The vertical velocity of each particle can be determined according to the distance between the two light 25
AMTD
6, 519–546, 2013A comparison of rainfall measurements by multiple instruments
X. C. Liu et al.
Title Page
Abstract Introduction
Conclusions References
Tables Figures
◭ ◮
◭ ◮
Back Close
Full Screen / Esc
Printer-friendly Version
Interactive Discussion
Discussion
P
a
per
|
Dis
cussion
P
a
per
|
Discussion
P
a
per
|
Discussio
n
P
a
per
|
are sorted into 50 size intervals ranging from 0.1 to 9.9 mm; the boundaries of the 50 channels are 0.2 mm uniformly.
The size resolution of 2DVD is 1 pixel of linear CCD or finer than 0.2 mm; therefore it cannot measure the drops smaller than 0.2 mm. The enclosure of 2DVD can cause errors in the detection of small drops, some of them might be counted more than once 5
when they pass across the measurement area while others are not counted at all (Nes-por et al., 2000). Also the spatial distribution of raindrops cross the measurement area could be distorted by the wind. A drop seen by the above light sheet might be matched to a different drop by the below light sheet, this mismatching could cause errors in shapes and velocities of particles (Leijnse and Uijlenhoet, 2010).
10
3 Intercomparison analysis
The rainfall measurements used in this study were collected during the Atmospheric Radiation Measurement (ARM) climate research that was operated at Darwin, North-ern Territory, Australia from January to October 2012. The rainfall observations are from a TBRG, a WRG, an ORG, a PWD, a JWD, a 2DVD, where the DSDs are obtained from 15
the JWD and 2DVD.
3.1 General analysis
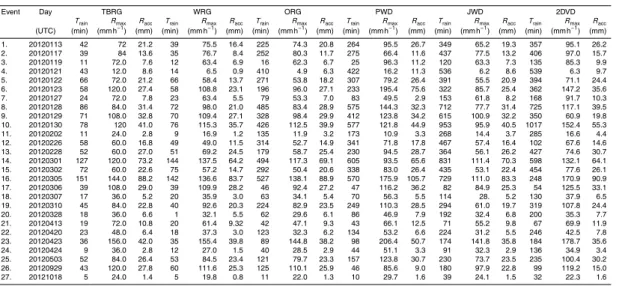
Table 1 presents the rainfall duration (Train), max rain rate (Rmax), and rainfall accumu-lations (Racc) for 27 rainfall events observed by six instruments, of which the missing records, operational failures, and obvious discrepancies of observations are excluded. 20
In general, the maximum value ofTrain was recorded by JWD, the maximum values of Rmax and Racc were recorded by PWD, while the minimum values of Train,Rmax, Racc were recorded by WRG. The rainfall duration of TBRG and WRG is far less than that of ORG, PWD, JWD, and 2DVD, while there’s no such obvious difference of rainfall accumulation by six instruments.
AMTD
6, 519–546, 2013A comparison of rainfall measurements by multiple instruments
X. C. Liu et al.
Title Page
Abstract Introduction
Conclusions References
Tables Figures
◭ ◮
◭ ◮
Back Close
Full Screen / Esc
Printer-friendly Version
Interactive Discussion
Discussion
P
a
per
|
Dis
cussion
P
a
per
|
Discussion
P
a
per
|
Discussio
n
P
a
per
|
Table 2 presents the bias (∆R) of total rainfall accumulations by six instruments, which can be calculated as:
∆R=R1−R2
R1
(1)
whereR1 and R2 denotes the total rainfall accumulation of all the 27 events by two instruments (R1is the bigger one).
5
There are significant discrepancies in rainfall accumulations from different instru-ments, ORG presents the best agreement with the JWD (∆R=0 %), the ORG, JWD, and 2DVD present an excellent agreement with the TBRG (∆R=5.9, 5.8, 5.0 %), while the PWD and 2DVD present the worst agreement with the WRG (more than 20 %). The comparisons of event rain amounts between TBRG and other five instruments are 10
presented in Fig. 2. The correlation coefficient and standard deviation (σ) are used to quantity their discrepancies. It can be found that the ORG and TBRG have the best correlation coefficient and the leastσ, the probable reason is that the ORG is calibrated by the TBRG, while the PWD and TBRG have the worst correlation coefficient and the largestσ. Compared with the TBRG, The WRG and ORG underestimated the rainfall 15
accumulation obviously, while the PWD and 2DVD overestimated the rainfall accumu-lation significantly. However, bias does not quantify event by event agreement; details of specific rainfall events will be discussed in the following section.
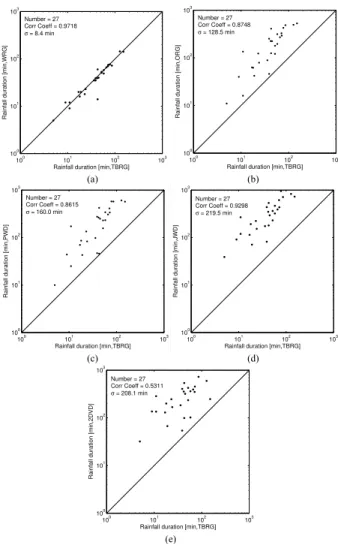
Table 3 presents the∆R of rainfall durations by six instruments, it can be found that there is the least bias between the TBRG and WRG (∆R=3.2 %), and the largest 20
bias between TRBG and JWD (∆R=86.2 %), which can be validated by Fig. 3. The comparisons of rainfall durations between TBRG and other five instruments show that the TBRG and WRG have the best correlation coefficient and the leastσ, while the JWD and TBRG have the largestσ, 2DVD and TBRG have the worst correlation coefficient. The overall rainfall duration by ORG, PWD, JWD, and 2DVD bias much higher than 25
AMTD
6, 519–546, 2013A comparison of rainfall measurements by multiple instruments
X. C. Liu et al.
Title Page
Abstract Introduction
Conclusions References
Tables Figures
◭ ◮
◭ ◮
Back Close
Full Screen / Esc
Printer-friendly Version
Interactive Discussion
Discussion
P
a
per
|
Dis
cussion
P
a
per
|
Discussion
P
a
per
|
Discussio
n
P
a
per
|
3.2 Event analysis
Since general rain rate and rainfall duration of long term could not reflect the specific performance of each instrument, details of selected rainfall events with typical features during the precipitation process are discussed, differences and discrepancies between different instruments are analyzed in this section.
5
Figure 4a and b show the evolution of the rain rate by six instruments on 13 Jan-uary and 2 March 2012. It can be found that the TBRG, WRG, and ORG have a good agreement when rain rate is more than 20 mm h−1, JWD bias lower and the PWD and 2DVD bias higher. The largest and the smallest rain rate are recorded by PWD and JWD respectively at the same time. The ORG, JWD, and 2DVD show a good agree-10
ment, while WRG bias lower and PWD bias a little higher when the rain rate is less than 20 mm h−1. The rain rate of TBRG shows an obvious and discrete variation, the main reason is that its bad resolution of 12 mm h−1. The TBRG has a bad timeliness, one tip
of compartment bucket with water in light rainfall need take a long while, therefore rain rate less than 12 mm h−1can not be detected in time.
15
Although the variations of rain rate recorded by six instruments show great discrep-ancy, the rainfall accumulation by six instruments have relative small bias. In Fig. 4a, the WRG have the smallest record of rainfall accumulation (16.4 mm), the PWD have the largest record of rainfall accumulation (26.6 mm), and the TBRG, ORG, and JWD have a good agreement (21.2, 20.7, and 19.1 mm), while the 2DVD bias a little higher 20
(26.0 mm). The similar result can be fount in Fig. 4b.
The rainfall durations recorded by six instruments agree well when the rain rate is more than 20 mm h−1, while there are much greater discrepancy in the light rainfall
(R <20 mm h−1). The TBRG and WRG have a good agreement (42, 37 min), while the
ORG, PWD, JWD, and 2DVD recorded much longer rainfall duration (198, 208, 234, 25
AMTD
6, 519–546, 2013A comparison of rainfall measurements by multiple instruments
X. C. Liu et al.
Title Page
Abstract Introduction
Conclusions References
Tables Figures
◭ ◮
◭ ◮
Back Close
Full Screen / Esc
Printer-friendly Version
Interactive Discussion
Discussion
P
a
per
|
Dis
cussion
P
a
per
|
Discussion
P
a
per
|
Discussio
n
P
a
per
|
a long while to be sensed by compartment bucket or weighing sensor, causing the underestimation of rainfall duration of TBRG and WRG.
Due to the disadvantages and shortcomings of each instrument, rain rate by any instrument treated as the reference is inappropriate. Therefore we propose a reference algorithm based on a weighting of different instruments to obtain a reference value, 5
shown as follows:
Rr= 4
P
i=0 Ri·Wi
4
P
i=0 Wi
(2)
whereRris the reference rain rate,Ri is the rain rate by theith instrument (where 0 for
WRG, 1 for ORG, 2 for PWD, 3 for JWD, 4 for 2DVD), the rain rate by TBRG is excluded because of its bad resolution, Wi is the weighting value for the ith instrument. The
10
averaging method is the simplest and easiest weighting function, but it is inaccurate because of different biases of different instruments, therefore we propose a dynamic weighting function:
Wi =
Ri 4
P
i=0 Ri
. (3)
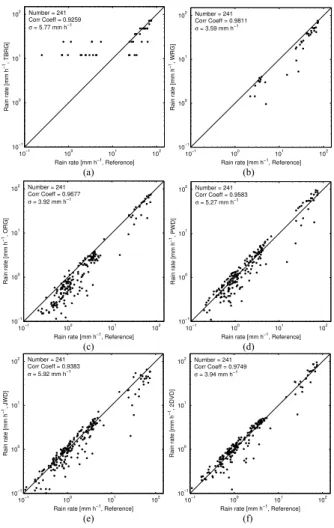
Figure 5 shows the comparison of individual instruments against the reference values 15
AMTD
6, 519–546, 2013A comparison of rainfall measurements by multiple instruments
X. C. Liu et al.
Title Page
Abstract Introduction
Conclusions References
Tables Figures
◭ ◮
◭ ◮
Back Close
Full Screen / Esc
Printer-friendly Version
Interactive Discussion
Discussion
P
a
per
|
Dis
cussion
P
a
per
|
Discussion
P
a
per
|
Discussio
n
P
a
per
|
about the 1 : 1 line. Compared with the reference values, The WRG and ORG under-estimated the rainfall accumulation obviously. In generally, the PWD and 2DVD overes-timated, WRG and JWD underestimated the rain rate during heavy rainfall; the TBRG overestimated the rain rate obviously during light rainfall, while the WRG and ORG underestimated the rain rate slightly.
5
3.3 DSD analysis
Generally, the power-law parameters for Marshall and Palmer (Smith et al., 1993) dis-tributions are widely used for describing precipitation. However, the MP model applies only to stable rainfall from stratiform clouds (Joss and Gori, 1987; Carbone and Nelson, 1978; Willis, 1984). It is now widely accepted that the DSDs of precipitation is better 10
represented by the ga mma distribution (Ulbrich, 1983; Testud et al., 2001):
N(D)=N0Dmexp(−λD) (4)
where the N0, m, and λ are intercept, shape, and slope parameters, which can be calculated by the method of moments (Tokay and Short, 1996). Thex-moment of DSD is defined as:
15
Mx=
∞
Z
0
N(D)DxdD= ∞
X
0
N(D)Dx. (5)
TheN0,m, andΛcan be calculated by using theM3,M4, andM6:
N0=
λm+4M3 γ(m+4)
m=11G−8+(G2+8G)1
/2
2(1−G) λ=mD+m4
AMTD
6, 519–546, 2013A comparison of rainfall measurements by multiple instruments
X. C. Liu et al.
Title Page
Abstract Introduction
Conclusions References
Tables Figures
◭ ◮
◭ ◮
Back Close
Full Screen / Esc
Printer-friendly Version
Interactive Discussion
Discussion
P
a
per
|
Dis
cussion
P
a
per
|
Discussion
P
a
per
|
Discussio
n
P
a
per
|
whereG=M43/M32M6,Dm=M4/M3. The number densityNd, liquid water content W, radar reflectivity factorZ of rainfall can be calculated by using theM0,M3, andM6.
Nd=M0 W =πρwater
6 M3
Z=M6
(7)
whereρwateris the density of water.
Figure 6 shows the evolution of the DSD variables obtained by JWD and 2DVD on 2 5
March 2012. It can be found that the volume mean diameter measured by JWD is larger than that measured by 2DVD, the drop numbers and liquid water content measured by 2DVD is more than that by JWD, while there is little difference of Z between JWD and 2DVD because of a logarithmic transformation. Considering the evolution of rain rate in Fig. 3b, the differences of volume mean diameter, number, and liquid water 10
content between both are getting greater with the increasing of rain rate, while there is somewhat difference ofZ when no rainfall, the reasons related to the instruments will be discussed in the following analysis of DSDs.
The individual observed drop size distributions by JWD and 2DVD for four different rain intensity intervals are shown in Fig. 7a–d and for overall rainfall are shown in 15
Fig. 7e. Small drops were the main contributors to the number concentration in light rain (R <5 mm h−1), since the minimum size of JWD is 0.3 mm, its concentration was lower than that of 2DVD during the light rain, while the 2DVD shows a better ability to measure the large-size raindrops. Small and moderate drops were the main contributors to the number concentration in moderate rain (5 mm h−1< R <15 mm h−1), compared with the 20
AMTD
6, 519–546, 2013A comparison of rainfall measurements by multiple instruments
X. C. Liu et al.
Title Page
Abstract Introduction
Conclusions References
Tables Figures
◭ ◮
◭ ◮
Back Close
Full Screen / Esc
Printer-friendly Version
Interactive Discussion
Discussion
P
a
per
|
Dis
cussion
P
a
per
|
Discussion
P
a
per
|
Discussio
n
P
a
per
|
JWD is insensitive to the variation of kinetic of raindrops with size when D >3 mm, causing the underestimation of large raindrops and the overall rain rate. Small rain-drops in the absence of large rainrain-drops can be recorded precisely by the video dis-drometer; however, small raindrops in the more large raindrops might be easily omitted due to the shadow effect. Inaccuracy of small raindrops in the heavy rainfall as one 5
disadvantage of 2DVD can be concluded.
Except for the raindrops smaller than 0.3 mm, the DSDs of JWD and 2DVD that included overall rainfall agreed well with each other (Fig. 7e), the overestimation of small-size drops (D <1 mm) and underestimation of very large-size drops (D >4 mm) by JWD suggests the JWD’s inaccuracy of measurement of small-size drops and very 10
large-size drops; while the 2DVD can promote the measurement of DSDs of overall-size drops substantially.
Table 4 summarizes the DSD parameters for different rain rate intervals calculated by Eqs. (5)–(7).M3,M4,M6are related to the liquid water content, rain rate, and radar reflectivity, all of which are of interest in cloud modeling and radar rainfall retrieval stud-15
ies. Among the five rain rate intervals, the seven parameters have the smallest values whenR <5 mm h−1, and the largest values whenR >30 mm h−1, parameters of
over-all rainfover-all are between the rain rate of R <5 mm h−1 and 5 mm h−1< R <15 mm h−1. All these parameters of 2DVD are larger than that of JWD except for the N0 when
R <5 mm h−1 due to 2DVD’s underestimation of small raindrops, compared with the
20
2DVD, JWD bias lower because of its inaccuracy of measurement of small-size drops and very large-size drops, especially in a very heavy rainfall.
4 Conclusions
In order to evaluate the accuracy of rainfall measurements by different instruments based on different principles, we analyzed the rainfall observations by a tipping bucket 25
AMTD
6, 519–546, 2013A comparison of rainfall measurements by multiple instruments
X. C. Liu et al.
Title Page
Abstract Introduction
Conclusions References
Tables Figures
◭ ◮
◭ ◮
Back Close
Full Screen / Esc
Printer-friendly Version
Interactive Discussion
Discussion
P
a
per
|
Dis
cussion
P
a
per
|
Discussion
P
a
per
|
Discussio
n
P
a
per
|
from January to October 2012 and selected rainfall events by six instruments were compared, a reference algorithm of rain rate were used to evaluate the accuracy of each instrument, DSDs observed by JWD and 2DVD are compared and discussed; the conclusions are obtained as follows.
For the long-term observations, there are different discrepancies in rain amounts 5
from six instruments in the order of 0 to 27.7 %. The intensity of TBRG shows an obvious and discrete variation due to its resolution of 12 mm h−1, rain rate less than 12 mm h−1can not be detected in time. Compared with the reference values calculated by the reference algorithm, when the rain rate was less than 20 mm h−1, the ORG, JWD, and 2DVD had a good agreement, which underestimated rain rate, while the TBRG 10
overestimated the rain rate; when the rain rate was more than 20 mm h−1
, the TBRG agreed well with the reference, while the PWD and 2DVD overestimated, WRG and JWD underestimated the rain rate. There are much more significant discrepancies in rainfall durations from six instruments in the order of 3 to 86.2 %, the TBRG and WRG underestimated more than 50 % of rainfall duration substantially in the light rainfall (R <
15
20 mm h−1). ORG underestimated the rainfall duration for about 12.7 %, while the JWD and 2DVD overestimated the rainfall duration for more than 30 %. Compared with the TBRG/WRG with bad timeliness, optical instruments are sensitive to the light rainfall and small raindrops, their output can reflect the temoral rainfall event precisely, which could be used for rain monitoring with better performances.
20
The JWD and 2DVD had close agreement in DSD parameters whenRwas less than 15 mm h−1, while there are some discrepancies of number concentration of small and very large raindrops whenR was more than 15 mm h−1. The DSDs of JWD and 2DVD
that included overall rainfall agreed well with each other, while the JWD had a higher volume mean diameter, lower raindrop numbers and liquid water content than that of 25
AMTD
6, 519–546, 2013A comparison of rainfall measurements by multiple instruments
X. C. Liu et al.
Title Page
Abstract Introduction
Conclusions References
Tables Figures
◭ ◮
◭ ◮
Back Close
Full Screen / Esc
Printer-friendly Version
Interactive Discussion
Discussion
P
a
per
|
Dis
cussion
P
a
per
|
Discussion
P
a
per
|
Discussio
n
P
a
per
|
in the more large raindrops due to the shadow effect. Inaccuracy of small raindrops in the heavy rainfall by 2DVD should be handled carefully.
Simultaneous rainfall measurements by multiple instruments less than one year is far not sufficient; we still need to analyze longer-term experiments and measurements with the same and different types of instruments. During the ARM, various instruments 5
are now being operated at different climatic region; longer observations will provide more rainfall and DSDs and would allow us to evaluated the performances of multi-instruments for different rain intensities and different precipitation types.
Acknowledgements. This work is supported by the National Natural Science Foundation of
China (Grant No. 41076118, and 41205125). Data were obtained from the Atmospheric
Radi-10
ation Measurement (ARM) Program sponsored by the US Department of Energy, Office of Sci-ence, Office of Biological and Environmental Research, Climate and Environmental Sciences Division.
References
Baquero, M., Cruz-Pal, S., Bringi, V. N., and Chandrasekar, V.: Rain-Rate Estimate Algorithm
15
Evaluation and Rainfall Characterization in Tropical Environments Using 2DVD, Rain Gauges and TRMM data, in: Proceedings of the 2005 Geoscience and Remote Sensing Symposium, IGARSS’05, Seoul, Korea, 2005.
Caracciolo, C., Natali, S., Prodi, F., and Tagliavini, A.: Comparison of two disdrometers based on different principles, 27th EGS Conference, Nice, France, 2002.
20
Carbone, R. E. and Nelson, L. D.: The evolution of raindrop spectra in warm-based convective storms as observed and numerically modelled, J. Atmos. Sci., 35, 2302–2314, 1978. Habib, E., Krajewski, W. F., and Kruger, A.: Sampling errors of tippingbucket rain gauge
mea-surements, J. Hydrol. Eng., 6, 159–166, 2001.
Joss, J. and Gori, E. G.: Shapes of raindrop size distribution, J. Appl. Meteorol., 17, 1054–1061,
25
1987.
AMTD
6, 519–546, 2013A comparison of rainfall measurements by multiple instruments
X. C. Liu et al.
Title Page
Abstract Introduction
Conclusions References
Tables Figures
◭ ◮
◭ ◮
Back Close
Full Screen / Esc
Printer-friendly Version
Interactive Discussion
Discussion
P
a
per
|
Dis
cussion
P
a
per
|
Discussion
P
a
per
|
Discussio
n
P
a
per
|
Leijnse, H. and Uijlenhoet, R.: The effect of reported high-velocity small raindrops on in-ferred drop size distributions and derived power laws, Atmos. Chem. Phys., 10, 6807–6818, doi:10.5194/acp-10-6807-2010, 2010.
Nespor, V., Krajewski, W. F., and Kruger, A.: Wind-induced error of raindrop size distribution measurement using a two-dimensional video disdrometer, J. Atmos. Ocean. Tech., 17, 1483–
5
1492, 2000.
Nystuen, J. A.: Relative performance of automatic rain gauges under different rainfall conditions, J. Atmos. Ocean. Tech., 16, 1025–1043, 1999.
Nystuen, J. A., Proni, J. R., Black, P. G., and Wilkerson, J. C.: A Comparison of automatic rain gauges, J. Atmos. Ocean. Tech., 13, 62–73, 1996.
10
Sch ¨onhuber, M., Lammer, G., and Randeu, W. L.: One decade of imaging precipitation mea-surement by 2D-video-distrometer, Adv. Geosci., 10, 85–90, doi:10.5194/adgeo-10-85-2007, 2007.
Schuur, T. J., Ryzhkov, A. V., Zrnic, D. S., and Sch ¨onhuber, M.: Drop size distributions measured by a 2D video disdrometer: comparison with dual-polarization radar data, J. Appl. Meteorol.,
15
40, 1019–1034, 2001.
Sheppard, B. E. and Joe, P. I.: Comparison of raindrop size distribution measurements by a Joss–Waldvogel disdrometer, a pms 2dg spectrometer, and a poss doppler radar, J. Atmos. Ocean. Tech., 11, 874–887, 1994.
Smith, P. L., Liu, Z., and Joss, J.: A study of sampling-variability effects in raindrop size
obser-20
vations, J. Appl. Meteorol., 32, 1259–1269, 1993.
Testud, J., Oury, S., Black, R. A., Ameyenc, P., and Xiankang, D.: The concept of “normalized” distribution to describe raindrop spectra: a tool for cloud physics and cloud remote sensing, J. Appl. Meteorol., 40, 1118–1140, 2001.
Thurai, M., Bringi, V. N., and Petersen, W. A.: Rain microstructure retrievals using 2-D video
25
disdrometer and C-band polarimetric radar, Adv. Geosci., 20, 13–18, doi:10.5194/adgeo-20-13-2009, 2009.
Thurai, M., Petersen, W. A., Tokay, A., Schultz, C., and Gatlin, P.: Drop size distribu-tion comparisons between Parsivel and 2-D video disdrometers, Adv. Geosci., 30, 3–9, doi:10.5194/adgeo-30-3-2011, 2011.
30
AMTD
6, 519–546, 2013A comparison of rainfall measurements by multiple instruments
X. C. Liu et al.
Title Page
Abstract Introduction
Conclusions References
Tables Figures
◭ ◮
◭ ◮
Back Close
Full Screen / Esc
Printer-friendly Version
Interactive Discussion
Discussion
P
a
per
|
Dis
cussion
P
a
per
|
Discussion
P
a
per
|
Discussio
n
P
a
per
|
Tokay, A., Kruger, A., and Krajewski, W. F.: Comparison of drop size distribution measurements by impact and optical disdrometers, J. Appl. Meteorol., 40, 2083–2097, 2001.
Tokay, A., Wolff, D. B., Wolff, K. R., and Bashor, P.: Rain gauge and disdrometer measurements during the keys area microphysics project (KAMP), J. Atmos. Ocean. Tech., 20, 1460–1477, 2003.
5
Ulbrich, C. W.: Natural variations in the analytical form of the raindrop size distribution, J. Clim. Appl. Meteorol., 22, 1764–1775, 1983.
Vaisala, O.: Present Weather Detector PWD22 User’s Guide, M210543EN-B, available at: http: //www.vaisala.com/ (last access: November 2012), January 2004.
Wang, J., Fisher, B. L., and Wolff, D. B.: Estimating rain rates from tipping-bucket rain gauge
10
measurements, J. Atmos. Ocean. Tech., 25, 43–56, 2008.
Willis, P. T.: Functional fits to some observed dropsize distributions and parameterization of rain, J. Atmos. Sci., 41, 1648–1661, 1984.
Wolff, D. B., Marks, D. A., Amitai, E., Silberstein, D. S., Fisher, B. L., Tokay, A., Wang, J., and Pippitt, J. L.: Ground validation for the Tropical Rainfall Measuring Mission (TRMM), J. Atmos.
15
AMTD
6, 519–546, 2013A comparison of rainfall measurements by multiple instruments
X. C. Liu et al.
Title Page
Abstract Introduction
Conclusions References
Tables Figures
◭ ◮
◭ ◮
Back Close
Full Screen / Esc
Printer-friendly Version
Interactive Discussion
Discussion
P
a
per
|
Dis
cussion
P
a
per
|
Discussion
P
a
per
|
Discussio
n
P
a
per
|
Table 1.Main rainfall parameters of the used data set. TheTrain,Rmax,Raccdenote the rainfall duration, max rain rate, and rainfall accumulations.
Event Day TBRG WRG ORG PWD JWD 2DVD
Train Rmax Racc Train Rmax Racc Train Rmax Racc Train Rmax Racc Train Rmax Racc Train Rmax Racc
(UTC) (min) (mm h−1) (mm) (min) (mm h−1) (mm) (min) (mm h−1) (mm) (min) (mm h−1) (mm) (min) (mm h−1) (mm) (min) (mm h−1) (mm)
AMTD
6, 519–546, 2013A comparison of rainfall measurements by multiple instruments
X. C. Liu et al.
Title Page
Abstract Introduction
Conclusions References
Tables Figures
◭ ◮
◭ ◮
Back Close
Full Screen / Esc
Printer-friendly Version
Interactive Discussion
Discussion
P
a
per
|
Dis
cussion
P
a
per
|
Discussion
P
a
per
|
Discussio
n
P
a
per
|
Table 2.Bias of total rainfall accumulations between six instruments.
∆R (%) TBRG WRG ORG PWD JWD 2DVD
TBRG – 16.9 5.9 12.9 5.8 5.0
WRG 16.9 – 11.7 27.7 11.8 20.8
ORG 5.9 11.7 – 18.0 0 10.2
PWD 12.9 27.7 18.0 – 18.0 8.7
JWD 5.8 11.8 0 18.0 – 10.1
AMTD
6, 519–546, 2013A comparison of rainfall measurements by multiple instruments
X. C. Liu et al.
Title Page
Abstract Introduction
Conclusions References
Tables Figures
◭ ◮
◭ ◮
Back Close
Full Screen / Esc
Printer-friendly Version
Interactive Discussion
Discussion
P
a
per
|
Dis
cussion
P
a
per
|
Discussion
P
a
per
|
Discussio
n
P
a
per
|
Table 3.Bias of rainfall duration between six instruments.
∆R (%) TBRG WRG ORG PWD JWD 2DVD
TBRG – 3.2 76.8 79.8 86.2 84.3
WRG 3.2 – 77.5 80.5 86.6 84.9
ORG 76.8 77.5 – 13.1 40.5 32.6
PWD 79.8 80.5 13.1 – 31.6 22.4
JWD 86.2 86.6 40.5 31.6 – 11.8
AMTD
6, 519–546, 2013A comparison of rainfall measurements by multiple instruments
X. C. Liu et al.
Title Page
Abstract Introduction
Conclusions References
Tables Figures
◭ ◮
◭ ◮
Back Close
Full Screen / Esc
Printer-friendly Version
Interactive Discussion
Discussion
P
a
per
|
Dis
cussion
P
a
per
|
Discussion
P
a
per
|
Discussio
n
P
a
per
|
Table 4.Drop size distribution parameters of rainfall for different rainrate intervals.
Parameters R <5 5< R <15 15< R <30 R >30 Overall (mm h−1
) (mm h−1
) (mm h−1
) (mm h−1
)
M3 JWD 1.00×10³ 3.57×10³ 8.09×10³ 1.38×10⁴ 2.45×10³ (mm3m−3) 2DVD 1.06
×103 5.39×10³ 1.06×10⁴ 1.56×10⁴ 2.89×10³
M4 JWD 1.41×10
3 5.34
×103 1.40×10⁴ 2.59×10⁴ 3.87×10³
(mm4m−3
) 2DVD 1.70×10³ 8.79×10³ 2.01×10⁴ 3.23×10⁴ 5.15×10³
M6 JWD 4.28×10
3
1.68×10⁴ 5.65×10⁴ 1.23×10⁵ 1.40×10⁴ (mm6m−3) 2DVD 6.33
×103 3.10×10⁴ 9.07×10⁴ 1.62×10⁵ 2.17×10⁴
N0 JWD 6.98×10
4 4.78
×105 6.29×10⁵ 5.57×10⁵ 1.31×10⁵ (mm−1m−3) 2DVD 4.72
×104 9.99×10⁵ 1.33×10⁶ 2.93×10⁶ 2.13×10⁵
m JWD 2.27 3.99 5.23 5.48 3.23
(mm−1−m
m−3
) 2DVD 3.04 5.79 8.48 13.20 5.65
Λ JWD 4.46 5.35 5.34 5.05 4.58
(mm−1) 2DVD 4.41 6.00 6.58 8.33 5.42
Z JWD 36.32 42.24 47.52 50.88 41.47
AMTD
6, 519–546, 2013A comparison of rainfall measurements by multiple instruments
X. C. Liu et al.
Title Page
Abstract Introduction
Conclusions References
Tables Figures
◭ ◮
◭ ◮
Back Close
Full Screen / Esc
Printer-friendly Version
Interactive Discussion
Discussion
P
a
per
|
Dis
cussion
P
a
per
|
Discussion
P
a
per
|
Discussio
n
P
a
per
|
1
(a) Tipping bucket rain gauge (b) Weighing bucket rain gauge (c) Optical rain gauge
2
3
(d) Present weather detector (e) Joss-Waldvogel disdrometer (f) 2D video disdrometer
4
Fig. 1.Instruments for precipitation.(a) Tipping bucket rain gauge. (b)Weighing bucket rain gauge(c)Optical rain gauge.(d)Present weather detector.(e)Joss–Waldvogel disdrometer.
AMTD
6, 519–546, 2013A comparison of rainfall measurements by multiple instruments
X. C. Liu et al.
Title Page
Abstract Introduction
Conclusions References
Tables Figures
◭ ◮
◭ ◮
Back Close
Full Screen / Esc
Printer-friendly Version
Interactive Discussion
Discussion
P
a
per
|
Dis
cussion
P
a
per
|
Discussion
P
a
per
|
Discussio
n
P
a
per
|
100 101 102 100
101 102
Rain amount [mm,TBRG]
Rain amount [mm,WRG]
Number = 27 Corr Coeff = 0.9918 σ = 2.73 mm
100
101
102
100 101
102
Rain amount [mm,TBRG]
Rain amount [mm,ORG]
Number = 27 Corr Coeff = 0.9979 σ = 1.36 mm
(a) (b)
100
101
102
100 101
102
Rain amount [mm,TBRG]
Rain amount [mm,PWD]
Number = 27 Corr Coeff = 0.9038 σ = 10.83 mm
100
101
102
100 101
102
Rain amount [mm,TBRG]
Rain amount [mm,JWD]
Number = 27 Corr Coeff = 0.9973 σ = 1.87 mm
(c) (d)
100 101 102 100
101 102
Rain amount [mm,TBRG]
Rain amount [mm,2DVD]
Number = 27 Corr Coeff = 0.9588 σ = 5.86 mm
(e)
Figure 2. Comparisons of event rain amount by six instruments. The number, Corr Coeff,
σ
Fig. 2.Comparisons of event rain amount by six instruments. The number, Corr Coeff, andσ
AMTD
6, 519–546, 2013A comparison of rainfall measurements by multiple instruments
X. C. Liu et al.
Title Page
Abstract Introduction
Conclusions References
Tables Figures
◭ ◮
◭ ◮
Back Close
Full Screen / Esc
Printer-friendly Version
Interactive Discussion
Discussion
P
a
per
|
Dis
cussion
P
a
per
|
Discussion
P
a
per
|
Discussio
n
P
a
per
|
100
101
102
103
100 101
102
103
Rainfall duration [min,TBRG]
Rainfall duration [min,WRG]
Number = 27 Corr Coeff = 0.9718
σ = 8.4 min
100
101
102
103
100
101 102
103
Rainfall duration [min,TBRG]
Rainfall duration [min,ORG]
Number = 27 Corr Coeff = 0.8748
σ = 128.5 min
(a) (b)
100
101
102
103
100 101
102 103
Rainfall duration [min,TBRG]
Rainfall duration [min,PWD]
Number = 27 Corr Coeff = 0.8615
σ = 160.0 min
100
101
102
103
100 101
102 103
Rainfall duration [min,TBRG]
Rainfall duration [min,JWD]
Number = 27 Corr Coeff = 0.9298
σ = 219.5 min
(c) (d)
100 101 102 103 100
101
102
103
Rainfall duration [min,TBRG]
Rainfall duration [min,2DVD]
Number = 27 Corr Coeff = 0.5311
σ = 208.1 min
(e)
Figure 3. Comparisons of event rainfall duration by six instruments. The number, Corr Coeff, σ
Fig. 3.Comparisons of event rainfall duration by six instruments. The number, Corr Coeff, and
AMTD
6, 519–546, 2013A comparison of rainfall measurements by multiple instruments
X. C. Liu et al.
Title Page
Abstract Introduction
Conclusions References
Tables Figures
◭ ◮
◭ ◮
Back Close
Full Screen / Esc
Printer-friendly Version
Interactive Discussion
Discussion
P
a
per
|
Dis
cussion
P
a
per
|
Discussion
P
a
per
|
Discussio
n
P
a
per
|
10.50 11 11.5 12 12.5 13 13.5 14 14.5
20 40 60 80 100
Time [UTC]
Rain Rate [mm h
−1
]
TBRG WRG ORG PWD JWD 2DVD
1
(a) January 13th 2012
2
16.50 17 17.5 18 18.5 19
20 40 60 80 100
Time [UTC]
Rain Rate [mm h
−1
]
TBRG WRG ORG PWD JWD 2DVD
3
(b) March 2nd 2012
4
AMTD
6, 519–546, 2013A comparison of rainfall measurements by multiple instruments
X. C. Liu et al.
Title Page Abstract Introduction Conclusions References Tables Figures ◭ ◮ ◭ ◮ Back Close
Full Screen / Esc
Printer-friendly Version Interactive Discussion Discussion P a per | Dis cussion P a per | Discussion P a per | Discussio n P a per | 10−1 100 101 102 10−1 100 101 102
Rain rate [mm h−1
, Reference]
Rain rate [mm h
−1, TBRG]
Number = 241 Corr Coeff = 0.9259
σ = 5.77 mm h−1
10−1 100 101 102 10−1 100 101 102
Rain rate [mm h−1
, Reference]
Rain rate [mm h
−1, WRG]
Number = 241 Corr Coeff = 0.9811
σ = 3.59 mm h−1
(a) (b)
10−1 100 101 102 10−1 100 101 102
Rain rate [mm h−1
, Reference]
Rain rate [mm h
−1, ORG]
Number = 241 Corr Coeff = 0.9677
σ = 3.92 mm h−1
10−1 100 101 102 10−1 100 101 102
Rain rate [mm h−1, Reference]
Rain rate [mm h
−1, PWD]
Number = 241 Corr Coeff = 0.9583
σ = 5.27 mm h−1
(c) (d)
10−1 100 101 102 10−1 100 101 102
Rain rate [mm h−1, Reference]
Rain rate [mm h
−1
, JWD]
Number = 241 Corr Coeff = 0.9383
σ = 5.92 mm h−1
10−1 100 101 102 10−1 100 101 102
Rain rate [mm h−1, Reference]
Rain rate [mm h
−1, 2DVD]
Number = 241 Corr Coeff = 0.9749
σ = 3.94 mm h−1
(e) (f)
Figure 5. Comparison of individual instruments against the output from the reference σ
AMTD
6, 519–546, 2013A comparison of rainfall measurements by multiple instruments
X. C. Liu et al.
Title Page
Abstract Introduction
Conclusions References
Tables Figures
◭ ◮
◭ ◮
Back Close
Full Screen / Esc
Printer-friendly Version
Interactive Discussion
Discussion
P
a
per
|
Dis
cussion
P
a
per
|
Discussion
P
a
per
|
Discussio
n
P
a
per
|
16.50 17 17.5 18 18.5 19 0.5
1 1.5 2 2.5
Time [UTC]
Volume Mean Diameter [mm]
JWD 2DVD
1
(a) 2
16.5 17 17.5 18 18.5 19
100
101
102 103
104
Time [UTC]
Number
JWD 2DVD
3
(b) 4
16.50 17 17.5 18 18.5 19 1
2 3 4 5
Time [UTC]
Liquid Water Content [g m
−3]
JWD 2DVD
5
(c) 6
16.5 17 17.5 18 18.5 19
−40 −20 0 20 40 60
Time [UTC]
Z [dB]
JWD 2DVD
7
(d) 8
AMTD
6, 519–546, 2013A comparison of rainfall measurements by multiple instruments
X. C. Liu et al.
Title Page Abstract Introduction Conclusions References Tables Figures ◭ ◮ ◭ ◮ Back Close
Full Screen / Esc
Printer-friendly Version Interactive Discussion Discussion P a per | Dis cussion P a per | Discussion P a per | Discussio n P a per |
0 1 2 3 4 5 10−2 10−1 100 101 102 103 104 D [mm] N(D) [m −3 mm −1 ] JWD 2DVD R < 5 mm h−1
0 1 2 3 4 5 10−2 10−1 100 101 102 103 104 D [mm] N(D) [m −3 mm −1 ] JWD 2DVD 5 < R < 15 mm h−1
(a) (b)
0 1 2 3 4 5 10−2 10−1 100 101 102 103 104 D [mm] N(D) [m −3 mm −1 ] JWD 2DVD 15 < R < 30 mm h−1
0 1 2 3 4 5 10−2 10−1 100 101 102 103 104 D [mm] N(D) [m −3 mm −1 ] JWD 2DVD R > 30 mm h−1
(c) (d)
0 1 2 3 4 5 10−2 10−1 100 101 102 103 104 D [mm] N(D) [m
−3 mm −1]
JWD 2DVD Overall
(e)