Cognitive Improvement after Mild Traumatic
Brain Injury Measured with Functional
Neuroimaging during the Acute Period
Glenn R. Wylie1,2,3, Kalev Freeman4, Alex Thomas4, Marina Shpaner4, Michael OKeefe4, Richard Watts4, Magdalena R. Naylor4*
1Rocco Ortenzio Neuroimaging Center, Kessler Foundation, West Orange, NJ, United States of America,
2Department of Physical Medicine and Rehabilitation, Rutgers University Medical School, Newark, NJ, United States of America,3War Related Illness and Injury Study Center, Department of Veterans’Affairs, East Orange, NJ, United States of America,4Department of Psychiatry, University of Vermont, Burlington, VT, United States of America
*magdalena.naylor@uvm.edu
Abstract
Functional neuroimaging studies in mild traumatic brain injury (mTBI) have been largely lim-ited to patients with persistent post-concussive symptoms, utilizing images obtained months to years after the actual head trauma. We sought to distinguish acute and delayed effects of mild traumatic brain injury on working memory functional brain activation patterns<72 hours after mild traumatic brain injury (mTBI) and again one-week later. We hypothesized that clinical and fMRI measures of working memory would be abnormal in symptomatic mTBI patients assessed<72 hours after injury, with most patients showing clinical recovery (i.e., improvement in these measures) within 1 week after the initial assessment. We also hypothesized that increased memory workload at 1 week following injury would expose dif-ferent cortical activation patterns in mTBI patients with persistent post-concussive symp-toms, compared to those with full clinical recovery. We performed a prospective, cohort study of working memory in emergency department patients with isolated head injury and clinical diagnosis of concussion, compared to control subjects (both uninjured volunteers and emergency department patients with extremity injuries and no head trauma). The pri-mary outcome of cognitive recovery was defined as resolution of reported cognitive im-pairment and quantified by scoring the subject’s reported cognitive post-concussive symptoms at 1 week. Secondary outcomes included additional post-concussive symptoms and neurocognitive testing results. We enrolled 46 subjects: 27 with mild TBI and 19 con-trols. The time of initial neuroimaging was 48 (+22 S.D.) hours after injury (time 1). At follow up (8.7, + 1.2 S.D., days after injury, time 2), 18 of mTBI subjects (64%) reported moderate to complete cognitive recovery, 8 of whom fully recovered between initial and follow-up im-aging. fMRI changes from time 1 to time 2 showed an increase in posterior cingulate activa-tion in the mTBI subjects compared to controls. Increases in activaactiva-tion were greater in those mTBI subjects without cognitive recovery. As workload increased in mTBI subjects, activation increased in cortical regions in the right hemisphere. In summary, we found neu-roimaging evidence for working memory deficits during the first week following mild
OPEN ACCESS
Citation:Wylie GR, Freeman K, Thomas A, Shpaner M, OKeefe M, Watts R, et al. (2015) Cognitive Improvement after Mild Traumatic Brain Injury Measured with Functional Neuroimaging during the Acute Period. PLoS ONE 10(5): e0126110. doi:10.1371/journal.pone.0126110
Academic Editor:Linda Chao, University of California, San Francisco, UNITED STATES
Received:April 29, 2014
Accepted:March 29, 2015
Published:May 11, 2015
Copyright:© 2015 Wylie et al. This is an open access article distributed under the terms of the
Creative Commons Attribution License, which permits unrestricted use, distribution, and reproduction in any medium, provided the original author and source are credited.
Data Availability Statement:Most data relevant to this study are included within the paper. However, the UVM IRB will not allow the author to make clinical data publicly available to protect the confidentiality of patient information. Clinical data are available upon request from Magdalena Naylor.
Funding:This work was supported by an internal grant from the Department of Surgery at UVM to Dr. Freeman.
traumatic brain injury. Subjects with persistent cognitive symptoms after mTBI had in-creased requirement for posterior cingulate activation to complete memory tasks at 1 week following a brain injury. These results provide insight into functional activation patterns dur-ing initial recovery from mTBI and expose the regional activation networks that may be in-volved in working memory deficits.
Introduction
Traumatic Brain Injury (TBI) is a significant medical problem worldwide (e.g., [1]), with as many as 1.7 million people in the US sustaining a head injury each year [2]. Visits to emergency departments in the United States for TBI increased by nearly 30% between 2006–2010 [3]; the surge in visits may be due in part to increasing public awareness, but still represents an impor-tant medical problem. The majority (75%) of TBIs are mild (mTBI) [2], and not all individuals who sustain a head injury present to the emergency department. While it appears most individ-uals with mTBI will recover without lengthy post-concussive syndrome, there are currently no known clinical measurements that can predict which patient will experience persistent deleteri-ous outcomes including cognitive (e.g., attention, executive function, memory), emotional (e.g., depression, anxiety, irritability), somatic (e.g., headache, fatigue, dizziness, pain) and physical deficits [4].
There is a growing literature on the impact of mTBI on the brain using neuroimaging tools [5–17]. Much has been learned through the investigation of changes in the blood oxygen level dependent (BOLD) signal during task performance as well the investigation of changes in func-tional brain connectivity using the covariation in the BOLD signal from disparate brain re-gions. Much of the research into task-based brain activation has focused on working memory (WM) tasks, since working memory is one of the domains primarily affected by mTBI. Nota-bly, this‘mild’form of injury induces persisting cognitive dysfunction in approximately 15–20 percent of patients each year, exacting an enormous emotional and financial toll on society [18–21]. This work has led to mixed results, with some studies reporting hypoactivation in mTBI [22–24], others reporting hyperactivation [9,17,25,26], and still others reporting both hypo- and hyper-activation [8,27,28]. This heterogeneity in results may be due to differences in the tasks that have been used in these studies (see [29] for a review). Another observation that is emerging from the mTBI literature is the importance of the integrity of the‘default net-work’(DN), a network of brain areas that is more active when subjects are“at rest”than when engaged in a cognitive task [30–32]. Importantly, activity in the DN appears to change as a function of recovery such that as post-concussive symptoms abate, metrics of functional con-nectivity return to normal levels [32]. The core regions of the DN include posterior cingulate cortex (PCC)/precuneus, inferior parietal lobule and medial prefrontal/perigenual anterior cin-gulate (ACC) [33].
Our objective was to understand the effect of concussive head injury on working memory, at the earliest possible time point after a concussion and in the first week of recovery. We com-pared patients diagnosed with mTBI in the emergency department to controls using the N-back task for working memory [8] and sequential neuroimaging at two early time points after trauma (0–3 days and 7–10 days post-injury). All subjects completed the least demanding con-dition of this task (the 0-back concon-dition) at all time points. This task was used because it was sufficiently easy that all subjects were able to perform well, even immediately after sustaining an mTBI. Furthermore, low-load working memory tasks like the 0-back have been associated with hypoactivation in the mTBI literature [29], though this is not always the case (as noted above). Additionally, subjects completed additional, and more demanding, conditions of this task at the second time point (the 1-back and 2-back conditions). We hypothesized that clinical and fMRI measures of working memory would be abnormal in mTBI patients immediately after injury, but these measures would improve in those patients with clinical recovery within 1 week. Regarding the fMRI measures, we specifically predicted that the mTBI group would show hypoactivation on the 0-back task immediately after injury. We also hypothesized that increased memory workload at 1 week following injury would expose different activation pat-terns in those mTBI patients with persistent symptoms, compared to those with full clinical recovery.
Methods
Study Design and Setting
This was a prospective cohort study performed in a single tertiary care academic medical center with a level 1 trauma center and 60,000 annual emergency department patient visits. The Uni-versity of Vermont’s Institutional Review Board (IRB) approved this study and written in-formed consent was obtained from all subjects prior to enrollment.
Study Population
Research staff screened emergency department patients for the study’s inclusion and exclusion criteria. Eligible patients were those aged 18–60 years old who presented to the emergency de-partment with isolated head injury, and medical diagnosis of a concussion based on standard emergency department criteria of Glasgow Coma Scale (GCS)>14 at the time of injury. For
purposes of the study, we defined an isolated head injury as head trauma with an injury severity score (ISS) for any other organ system<2 (i.e.,“moderate”severity on a scale of 1 to 6, minor
Clinical Data Collection and Processing
Initial assessments were completed by structured interviews performed by research staff, from review of emergency department charts, discussion with the patient’s physician, and evaluation of subjects while in the emergency department. Additional details on symptoms were also ac-quired from questionnaires and computer based assessments. Follow-up assessment was per-formed by a Research Associate at the time of repeat MRI and ImPACT testing Study data were collected and managed using REDCap electronic data capture tools hosted at UVM [34].
fMRI task and stimuli
The N-back working memory task was used, at both Time 1 and Time 2; however, at Time 1 only the easiest condition (0-back) was used while at Time 2 three conditions were included (the 0-back, 1-back and 2-back conditions). All subjects were trained and checked for profi-ciency (correctly responding to all targets) by research staff prior to completing the tasks in the MRI scanner. The tasks were composed of series of letters that were presented on a projector screen, which the subject could see through a mirror mounted on the MRI’s head coil. Instruc-tions for the tasks were as follows: 0-Back:“please respond when the letter you see matches the letter B (different letters were used at Time 1 and Time 2);”1-Back:“please respond when the letter you see matches the letter you saw one letter back;”2-Back:“please respond when the let-ter you see matches the letlet-ter you saw two letlet-ters back.”Subjects only responded to the letters when they met the above criteria and did so by pressing a button on a controller with their right index finger. When letters did not meet the above criteria subjects were asked not to re-spond. Each task lasted for approximately 3 minutes and a block design was used in which there were three blocks of the task (32 sec each) interleaved with blocks of rest (32 sec). The tasks were programed using E-Prime.
MRI acquisition
Brain MRI data was acquired on a Philips Achieva 3.0 Tesla (Philips Healthcare, Best, Nether-lands) scanner using an 8-channel head coil. T1-weighted images were acquired using a 3D in-version recovery spoiled gradient echo technique (TE/TR/TI/flip angle = 3.7ms/8.1ms/ 1008ms/8° with a SENSE factor of 1.5) to generate the Magnetization Prepared Rapid Acquisi-tion Gradient Echo (MPRAGE) image. A sagittal acquisiAcquisi-tion matrix of 240x240x160 provided whole-brain coverage with an isotropic 1mm spatial resolution with a scan time of less than 8 minutes. The BOLD signal was captured with a T2sequence (TE/TR/flip angle = 35ms/2000
ms/90°) with an in-plane resolution of 3 x 3 mm, and a slice thickness of 3.8 mm. For each of the n-back runs, 90 volumes were acquired (prior to the acquisition of these 90 volumes, an ad-ditional four were acquired (and discarded) to ensure steady-state magnetization).
Outcome measures
more than usual, drowsiness, sensitivity to light, sensitivity to noise, feeling dazed or stunned, irritability, sadness, nervousness, feeling more emotional than normal, numbness or tingling, feeling slowed down, feeling mentally foggy, difficulty concentrating, difficulty remembering, visual problems. Subjects rated each of these symptoms on a Likert scale ranging from 0 (the symptom was not experienced at all) to 6 (the symptom was the worst they had ever experi-enced). Among these symptoms, we defined cognitive symptoms as difficulty concentrating, difficulty remembering, feeling mentally foggy, feeling slowed down, drowsiness, fatigue and sleeping more than usual as previously defined by factor analysis [35]. The primary outcome of clinical recovery for individual patients, was defined as resolution of reported cognitive symptoms prior to time 2; other symptoms and ImPACT results were reported as secondary outcomes.
Primary Data Analysis
All variables were summarized descriptively. The primary outcome of clinical recovery was as-sessed by determining the number of post-concussive symptoms at time 2. We report the mean number of symptoms for controls and mTBI subjects, with standard deviations, and the esti-mated magnitude of difference between groups with 95% confidence interval for this differ-ence. We also report the mean and standard deviation of post-concussive symptoms between the subgroups of recovered and non-recovered subjects, along with the difference in means be-tween these subgroups, with the 95% confidence interval. Secondary outcomes of neurocogni-tive testing results, were reported in the same fashion for both the experimental groups and subgroups. Statistical calculations were performed with SPSS (PASW Statistics 18, release 18.0.2).
fMRI Data Analysis
All images were preprocessed using Analysis of Functional Neuro-Images (AFNI) [36]. The re-alignment, co-registration and normalization were done in a single transform. This was accom-plished by (1) calculating and saving the parameters necessary for realignment (i.e., the spatial co-registration of all images in each time-series to the first image of the series). Next, (2) the pa-rameters necessary to co-register the first image in each time-series with the high resolution MPRAGE were calculated and saved. Third, (3) the MPRAGE image was warped into standard space, and the warping parameters were saved. Finally, the transforms necessary to realign, co-register and warp the data into standard space were combined and applied to the functional time-series data in a single transformation. The images were then smoothed, using an 8 mm3 Gaussian smoothing kernel, and scaled to the mean intensity across time-points. The data were then deconvolved, using a boxcar function in which each condition was represented by a re-gressor (motion parameters and two polynomial rere-gressors [to model signal drift] were includ-ed as regressors of no interest). The boxcar function was convolvinclud-ed with a gamma variate hemodynamic response function prior to fitting it in the model. Group-level statistics were per-formed using ANOVAs. All group-level statistical maps were thresholded using both the alpha level and cluster size (extent of activation). The alpha level was set at p<0.01 and the cluster
Results
Demographics
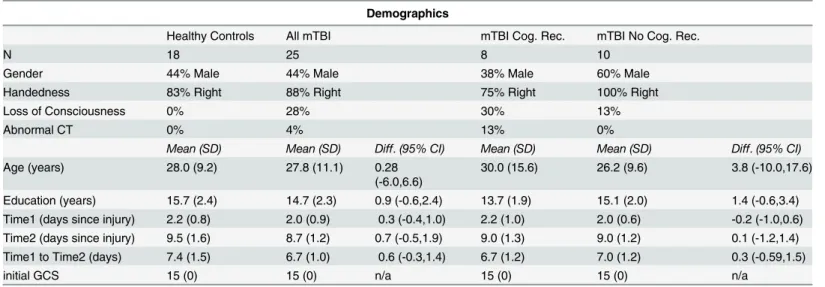
Participants consisted of 27 mild TBI patients, 10 orthopedic controls and 9 healthy controls (Table 1). Head CT was performed on 12 of the 30 mTBI subjects. One subject had a subtle, small area of intraparachymal hemorrhage. This subject was not excluded. She did not require surgery and recovered uneventfully. Of the entire sample, two mTBI patients and one healthy control did not return for their follow up scan and were therefore excluded from the sample. The mTBI patients were enrolled in the study within 72 hours of injury and while the research MRI scanner was available, and returned for a second scan 1 week later. No additional, focal le-sions were identified upon qualitative radiological review of MR images in any of the subjects. Of the 25 mTBI patients eight mTBIs reported complete recovery from all cognitive symptoms between scan 1 and scan 2, ten mTBIs reported minimal recovery by the completion of the sec-ond scan, and the remainder (seven) reported moderate recovery. In the analyses below that compare recovered mTBIs to non-recovered mTBIs, only the eight mTBIs who had symptoms at Time1 and who recovered fully by Time 2 and the 10 mTBIs who reported minimal recovery by Time 2 were included. By including only the two‘tails’of the distribution of recovery in this way (the recovered and non-recovered), we sought to maximize the difference associated with recovery. There were no differences between groups on any of the demographic variables (see Table 2for additional demographic information).
Table 1. Demographics of the groups.
Demographics
Healthy Controls All mTBI mTBI Cog. Rec. mTBI No Cog. Rec.
N 18 25 8 10
Gender 44% Male 44% Male 38% Male 60% Male
Handedness 83% Right 88% Right 75% Right 100% Right
Loss of Consciousness 0% 28% 30% 13%
Abnormal CT 0% 4% 13% 0%
Mean (SD) Mean (SD) Diff.(95% CI) Mean (SD) Mean (SD) Diff.(95% CI)
Age (years) 28.0 (9.2) 27.8 (11.1) 0.28
(-6.0,6.6)
30.0 (15.6) 26.2 (9.6) 3.8 (-10.0,17.6)
Education (years) 15.7 (2.4) 14.7 (2.3) 0.9 (-0.6,2.4) 13.7 (1.9) 15.1 (2.0) 1.4 (-0.6,3.4) Time1 (days since injury) 2.2 (0.8) 2.0 (0.9) 0.3 (-0.4,1.0) 2.2 (1.0) 2.0 (0.6) -0.2 (-1.0,0.6) Time2 (days since injury) 9.5 (1.6) 8.7 (1.2) 0.7 (-0.5,1.9) 9.0 (1.3) 9.0 (1.2) 0.1 (-1.2,1.4) Time1 to Time2 (days) 7.4 (1.5) 6.7 (1.0) 0.6 (-0.3,1.4) 6.7 (1.2) 7.0 (1.2) 0.3 (-0.59,1.5)
initial GCS 15 (0) 15 (0) n/a 15 (0) 15 (0) n/a
doi:10.1371/journal.pone.0126110.t001
Table 2. Additional demographic information.
Setting of Injury
Motor vehicle crash Sports Fall from standing Fall from height Assault Other
All mTBI 4% 52% 24% 4% 8% 8%
mTBI Cog. Rec. 0% 63% 37% 0% 0% 0%
mTBI No Cog. Rec. 10% 20% 20% 10% 20% 20%
Clinical Outcomes and Predictive Power of Clinical Measures
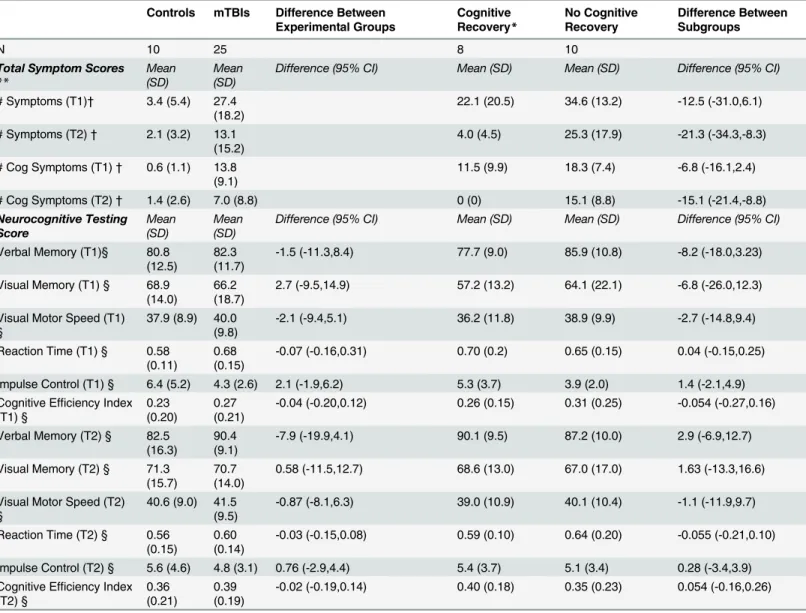
The number of post-concussive symptoms at time 2 was significantly higher in mTBI subjects compared to controls as expected. In comparison of subjects with cognitive recovery to those with no cognitive recovery (primary outcome), there were no differences in demographics, ini-tial symptoms or neurocognitive measurements (verbal memory, visual memory, visuo-motor speed, reaction time [RT], impulse control, and cognitive efficiency index) at the initial time point. Because only one subject had an abnormal CT scan, and structural MRI did not reveal additional lesions, none of these clinical measures provided additional predictive power in de-termining the primary outcome. The secondary outcomes of neurocognitive results at time 2 were similar at both time points for those subjects with and without resolution of cognitive symptoms as shown by the overlapping 95% confidence intervals for each of these measures (seeTable 3).
Extremity Injured controls vs. Healthy Controls (HC)
We first compared the two groups of Controls to one another to ensure that there were no dif-ferences between these two Control groups. This was done by comparing the 0-back data at Time1 and Time2 (in separate t-tests). No differences were found in either behavioral accuracy or in the imaging data. The RTs for extremity injured controls were faster on the 0-back task at both time points (p<0.04 and p<0.03 for Time1 and Time2 respectively); however, because
this difference suggested that the information processing of the extremity injured controls was (if anything) more efficient than the other HCs (rather than the reverse), and because their ac-curacy was comparable, and because their RTs were not different on the 1-back and 2-back tasks, we felt that this difference was likely due merely to random chance rather than to a sys-tematic difference between the groups. Therefore in all subsequent analyses, these two groups of Controls were pooled to form a single Healthy Control (HC) group.
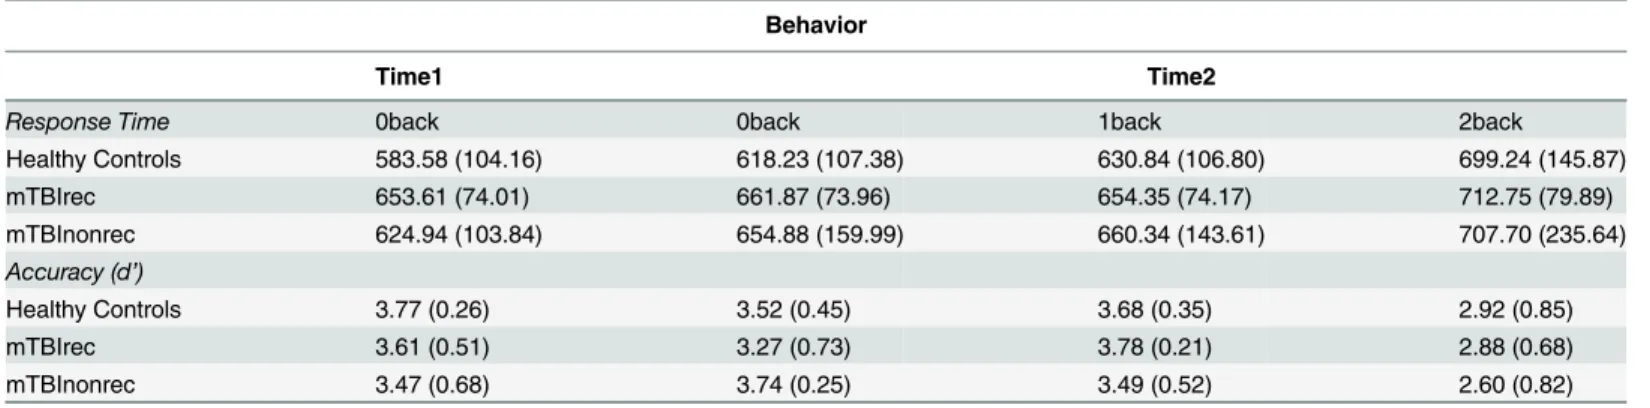
Behavior
For both response time (RT) and accuracy (d’), we conducted two ANOVAs. Because the accu-racy data was not normally distributed, it was first log-transformed to assure normality. The first compared 0-back performance across time. This was a 2 X 3, mixed between- and within-subjects ANOVA with time as the within-within-subjects factor (Time 1 vs. Time 2) and group as the between-subjects factor (HC, mTBIrec, mTBInonrec). For both RT and d’, none of the main ef-fects or interactions were significant (seeTable 3).
The next analysis interrogated task difficulty by comparing the three levels of n-back work-ing memory load across the three groups at Time2 (seeTable 4). This was a 3 x 3 mixed be-tween- and within- subjects ANOVA, with load as the within-subjects factor (0-back, 1-back, 2-back) and group as the between-subjects factor (as before). For both RT and d’, a Green-house-Geisser correction for non-sphericity was used (based on Mauchly’s test of sphericity). In the RT data, there was a main effect of load (F(1.57,50.14) = 8.89, p<0.001). Paired t-tests
showed that this main effect resulted from subjects responding with longer latencies on the 2-back than on the 1-back (t(34) = 3.59, p<0.001), while the difference between 0-back and
1-back was not reliably different. For d’, the overall pattern of results was the same: a main ef-fect of working memory load (F(1.33, 41.21) = 12.76, p<0.0001) and no other effects or
inter-actions. Furthermore, as in the RT data, the effect of load was due to subjects being less accurate on the 2-back than on the 1-back (t(34) = 4.13, p<0.0001), while the difference
MRI Data
mTBI vs. Healthy Controls, change over time. This 2 X 2 ANOVA, with factors of group
(mTBI vs. HC) and time (Time 1 vs. Time 2), was conducted using 3dLME.R, a script distribut-ed with the AFNI suite of image analysis tools that implements the R statistical analysis soft-ware. Only the 0-back data was included since only these data were collected at both time points. There was a main effect of Time in several areas including superior frontal gyrus, inferi-or frontal gyrus, insula and inferiinferi-or parietal lobule (seeTable 5). In all cases, this was because Table 3. Clinical outcomes. Symptom and neurocognitive testing scores for control, mTBI and cognitive recovery subject subgroups.
Controls mTBIs Difference Between Experimental Groups Cognitive Recovery* No Cognitive Recovery Difference Between Subgroups
N 10 25 8 10
Total Symptom Scores
**
Mean (SD)
Mean (SD)
Difference (95% CI) Mean (SD) Mean (SD) Difference (95% CI)
# Symptoms (T1)† 3.4 (5.4) 27.4 (18.2)
22.1 (20.5) 34.6 (13.2) -12.5 (-31.0,6.1)
# Symptoms (T2)† 2.1 (3.2) 13.1 (15.2)
4.0 (4.5) 25.3 (17.9) -21.3 (-34.3,-8.3)
# Cog Symptoms (T1)† 0.6 (1.1) 13.8 (9.1)
11.5 (9.9) 18.3 (7.4) -6.8 (-16.1,2.4)
# Cog Symptoms (T2)† 1.4 (2.6) 7.0 (8.8) 0 (0) 15.1 (8.8) -15.1 (-21.4,-8.8)
Neurocognitive Testing Score Mean (SD) Mean (SD)
Difference (95% CI) Mean (SD) Mean (SD) Difference (95% CI)
Verbal Memory (T1)§ 80.8 (12.5)
82.3 (11.7)
-1.5 (-11.3,8.4) 77.7 (9.0) 85.9 (10.8) -8.2 (-18.0,3.23)
Visual Memory (T1) § 68.9 (14.0)
66.2 (18.7)
2.7 (-9.5,14.9) 57.2 (13.2) 64.1 (22.1) -6.8 (-26.0,12.3)
Visual Motor Speed (T1) §
37.9 (8.9) 40.0 (9.8)
-2.1 (-9.4,5.1) 36.2 (11.8) 38.9 (9.9) -2.7 (-14.8,9.4)
Reaction Time (T1) § 0.58 (0.11)
0.68 (0.15)
-0.07 (-0.16,0.31) 0.70 (0.2) 0.65 (0.15) 0.04 (-0.15,0.25)
Impulse Control (T1) § 6.4 (5.2) 4.3 (2.6) 2.1 (-1.9,6.2) 5.3 (3.7) 3.9 (2.0) 1.4 (-2.1,4.9) Cognitive Efficiency Index
(T1) §
0.23 (0.20)
0.27 (0.21)
-0.04 (-0.20,0.12) 0.26 (0.15) 0.31 (0.25) -0.054 (-0.27,0.16)
Verbal Memory (T2) § 82.5 (16.3)
90.4 (9.1)
-7.9 (-19.9,4.1) 90.1 (9.5) 87.2 (10.0) 2.9 (-6.9,12.7)
Visual Memory (T2) § 71.3 (15.7)
70.7 (14.0)
0.58 (-11.5,12.7) 68.6 (13.0) 67.0 (17.0) 1.63 (-13.3,16.6)
Visual Motor Speed (T2) §
40.6 (9.0) 41.5 (9.5)
-0.87 (-8.1,6.3) 39.0 (10.9) 40.1 (10.4) -1.1 (-11.9,9.7)
Reaction Time (T2) § 0.56 (0.15)
0.60 (0.14)
-0.03 (-0.15,0.08) 0.59 (0.10) 0.64 (0.20) -0.055 (-0.21,0.10)
Impulse Control (T2) § 5.6 (4.6) 4.8 (3.1) 0.76 (-2.9,4.4) 5.4 (3.7) 5.1 (3.4) 0.28 (-3.4,3.9) Cognitive Efficiency Index
(T2) §
0.36 (0.21)
0.39 (0.19)
-0.02 (-0.19,0.14) 0.40 (0.18) 0.35 (0.23) 0.054 (-0.16,0.26)
N.B., At baseline recovered subjects did not differ from non-recovered subjects in symptom or neurocognitive scores
*Cognitive recovery was defined as resolution of cognitive symptoms (difficulty concentrating, difficulty remembering, feeling mentally foggy, feeling slowed down, drowsiness, fatigue and sleeping more than usual)
**Total of 22 post-concussive symptoms, including those defined as cognitive symptoms
†Significant at p<0.001 between Controls and mTBIs § no significance between recovered and non-recovered.
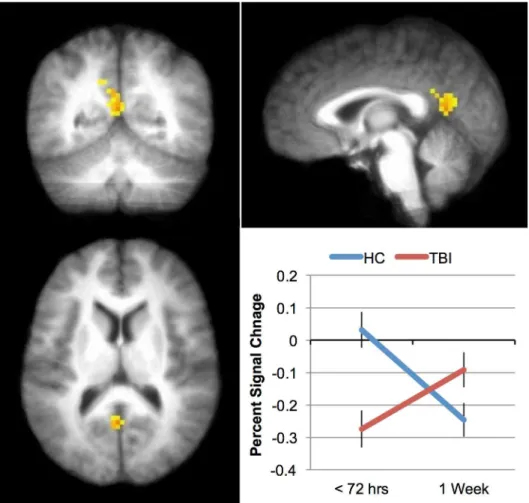
the activation was greater at Time 1 than at Time 2. The main effect of Group was not reliable in any brain area. However, there was an interaction between Group and Time in the posterior cingulate cortex (seeTable 5andFig 1).
Recovery vs. non-Recovery. In the analyses that specifically investigated recovery, we
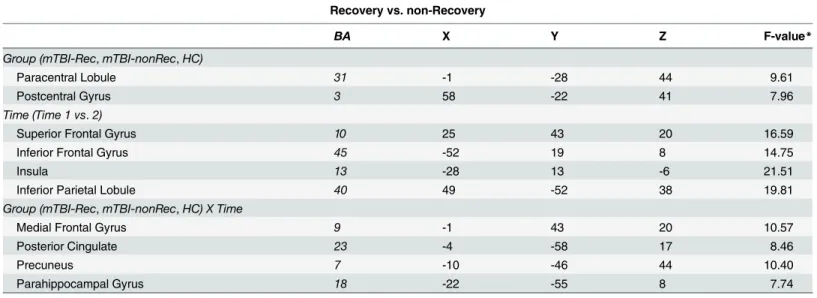
compared those who made a good recovery (8 mTBIs) to those who made minimal or no re-covery (10 mTBIs). This 3 X 2 ANOVA, with factors of group (mTBI-Rec, mTBI-nonRec, HC) and time (Time 1 vs. Time 2) was similar to the analysis above. As in the previous analysis, only the 0-Back data was analyzed. There was a main effect of Group in both the paracentral lobule and precentral gyrus (seeTable 6), and in both cases this was due to more activation in the HC and mTBI-Rec than the mTBI-nonRec (the HC and mTBI-Rec groups did not differ). There was also a main effect of Time in superior and inferior frontal areas, the insula and in in-ferior parietal areas (seeTable 6). In all cases, this was because subjects showed more activation at Time 1 than at Time 2. Finally, asTable 6andFig 2show, there was an interaction between Group and Time in four regions: medial prefrontal, posterior cingulate, parahippocampal gyrus and precuneus. The activation across the three groups for the medial prefrontal area is shown inFig 2: while the HCs and the mTBI-Rec show a comparable pattern of activation, the activation seen in the mTBI-nonRec over time is markedly different (the pattern of activation seen for the other areas was substantially the same).
Table 4. Behavioral performance on the N-Back task performed in the scanner (mean, S.D.).
Behavior
Time1 Time2
Response Time 0back 0back 1back 2back
Healthy Controls 583.58 (104.16) 618.23 (107.38) 630.84 (106.80) 699.24 (145.87)
mTBIrec 653.61 (74.01) 661.87 (73.96) 654.35 (74.17) 712.75 (79.89)
mTBInonrec 624.94 (103.84) 654.88 (159.99) 660.34 (143.61) 707.70 (235.64)
Accuracy (d’)
Healthy Controls 3.77 (0.26) 3.52 (0.45) 3.68 (0.35) 2.92 (0.85)
mTBIrec 3.61 (0.51) 3.27 (0.73) 3.78 (0.21) 2.88 (0.68)
mTBInonrec 3.47 (0.68) 3.74 (0.25) 3.49 (0.52) 2.60 (0.82)
doi:10.1371/journal.pone.0126110.t004
Table 5. Brain regions showing reliable activation in the analysis of mTBI vs. HCs (B.A. = Brodmann’s area).
mTBI vs. Healthy Controls, change over time
BA X Y Z F-value*
Time (Time 1 vs.2)
Superior Frontal Gyrus 10 25 46 23 18.19
Superior Frontal Gyrus 9 -25 37 32 14.98
Inferior Frontal Gyrus 45 -52 19 8 14.14
Insula 13 -28 13 -6 17.95
Inferior Parietal Lobule 40 49 -52 38 15.90
Group (mTBI vs.HC) X Time (Time 1 vs.2)
Posterior Cingulate 23 -1 -55 14 11.78
*the F-value is for the voxel of maximal intensity in each cluster.
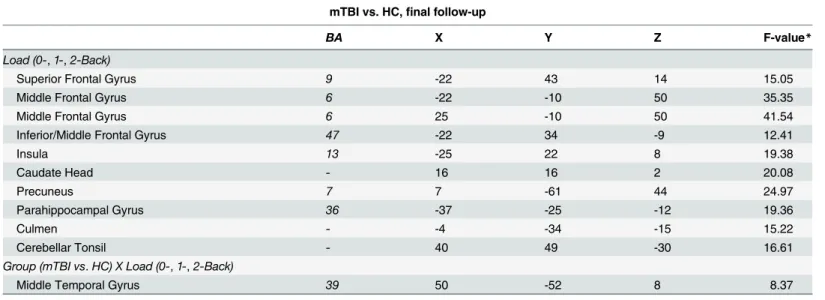
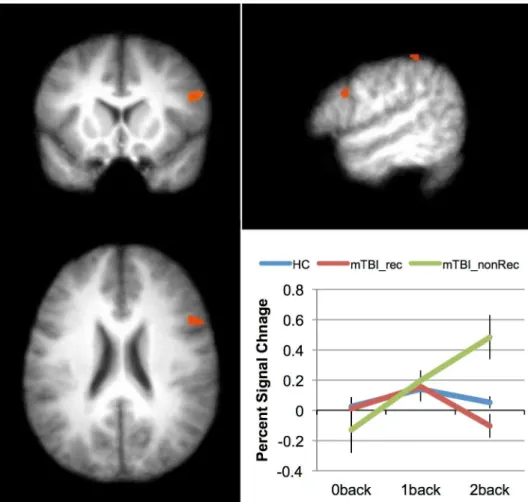
mTBI vs. Healthy Control, final follow-up. We investigated the differential effect of task difficulty (working memory load) across the two Groups (mTBI vs. HC) with a 2 X 3 ANOVA. The factors were group (mTBI vs. HC) and load (0-, 1-, 2-back). Because all three loads were used only at Time 2, only data from this time point was included in this analysis. Of the main effects, only the effect of Load was reliable (seeTable 7). The main effect of Load was seen in the expected fronto-parietal network, including superior and middle frontal areas, parietal areas (precuneus), as well as basal ganglia (caudate) and cerebellar regions. While there was no main effect of Group, a significant group difference was found for the 2-back, with the only area to show an interaction between group and load was in the middle temporal gyrus (see Table 7andFig 3). As can be seen in the plot inFig 3, the interaction resulted from individuals with mTBI increasing the activation in this area across the three levels of load; the HCs, in con-trast, decreased the activation in this area as the N-Back task became more difficult. This may be due to differential strategies employed by the two groups, with mTBIs increasingly relying on long-term memory structures while HCs rely more heavily on other (likely frontal) structures.
Group X Load analysis as a function of recovery. The above analysis was rerun, but with
the mTBI group divided into those who showed good recovery vs. those who did not. The Fig 1. Differences in activation patterns between mTBI and healthy controls over time.The interaction between Group (TBI vs. HC) and Time (Time 1 vs. Time 2) during 0-back task was significant in the posterior cingulate cortex (PCC). The inset graph shows the percent signal change. Error bars represent the standard error of the mean (SEM).
factors were the same, but the factor of group had three levels (mTBI-Rec, mTBI-nonRec, HC) rather than two. As in the above analysis, there were no areas that showed a main effect of group. Furthermore, the effect of Load was found in largely the same set of areas as in the above analysis (seeTable 8). No areas showed an interaction. However, when the cluster-level threshold was relaxed from 39 contiguous voxels to 30, two areas emerged: inferior frontal gyrus, and inferior parietal lobe. These can be seen inFig 4andTable 8.
Discussion
In this study, we set out to better understand the consequences of mild TBI on brain function, focusing on the first week after injury. We scanned individuals with mTBI twice: first within 72 hours of their injury to capture acute changes, and then 7–10 days later to assess recovery. This is the first study to our knowledge to longitudinally investigate working memory within the first week on injury in mTBI patients. We also differentiated between those patients who re-ported cognitive recovery, and those with persistent cognitive symptoms. Demographics, initial symptoms, neurocognitive measures at time 1, CT scans, and structural MRI, did not provide any predictive power to discriminate the primary outcome of recovery at 1 week. The failure of standard clinical assessment to identify those individuals at risk for post-concussive syndrome highlights the urgency of the current work.
While there is a growing body of work investigating working memory in TBI [5–17], much of this work has examined chronic injury, with scans acquired months—often years—after the injury has occurred. Much can be learned from this work (e.g., the reorganization of the nodes in the working memory network following insult); however, it is unclear from this work wheth-er the reorganization that is seen in chronic samples is qualitatively similar to acute changes in brain function. The results of the current study show a pattern of results that is qualitatively similar to this previous work in individuals who do not recover at 1 week after injury (Fig 4): increased activation in the right [5,13], often prefrontal [6], cortex when the activation of indi-viduals who have sustained a TBI is compared with controls. However, this pattern is not Table 6. Brain regions showing reliable activation in the analysis of mTBI-Rec vs. mTBI-nonRec vs. HCs. (B.A. = Brodmann’s area).
Recovery vs. non-Recovery
BA X Y Z F-value*
Group (mTBI-Rec,mTBI-nonRec,HC)
Paracentral Lobule 31 -1 -28 44 9.61
Postcentral Gyrus 3 58 -22 41 7.96
Time (Time 1 vs.2)
Superior Frontal Gyrus 10 25 43 20 16.59
Inferior Frontal Gyrus 45 -52 19 8 14.75
Insula 13 -28 13 -6 21.51
Inferior Parietal Lobule 40 49 -52 38 19.81
Group (mTBI-Rec,mTBI-nonRec,HC) X Time
Medial Frontal Gyrus 9 -1 43 20 10.57
Posterior Cingulate 23 -4 -58 17 8.46
Precuneus 7 -10 -46 44 10.40
Parahippocampal Gyrus 18 -22 -55 8 7.74
*the F-value is for the voxel of maximal intensity in each cluster.
evident in individuals who do recover. Thus, these data both replicate and extend previous findings.
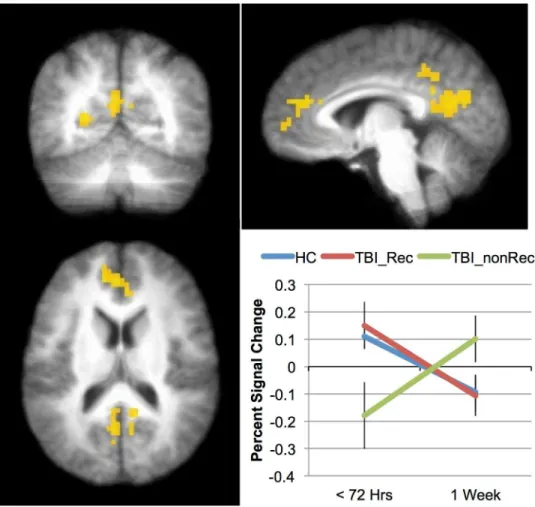
While the replication of previous results in an acute sample is encouraging, the data from the 0-back task collected within 72 hours of injury is perhaps more important (Fig 2). These data show that areas of the‘default network’(DN) (posterior cingulate cortex (PCC) and medi-al prefrontmedi-al cortex (MPFC)) appear to predict outcome in this sample. The DN is a set of re-gions that have been shown to be significantly more active when subjects are at rest (or engaged in a task with low cognitive load) than when they are engaged in effortful processing (e.g., [33,37], and while the DN is comprised of more brain regions than the PCC and MPFC, these two regions appear to be most reliably associated with it. In the TBI literature, DN activity has been shown to predict recovery by Han et al. [32] in US Military personnel when the initial scan was acquired approximately 30 days after the injury rather than within 72 hours, as here. Therefore, the current work suggests that the changes evident in the DN occur shortly after the injury, and that the pattern of changes have the potential to be predictive of recovery. When the activation in these areas was low during the 0-back task (hypoactivation), individuals with a mild TBI did not recover; when activation in these areas was relatively high during the 0-back task, individuals with mTBI did recover. This result raises the possibility that the activation in Fig 2. Indices of recovery over the first week post-injury.Areas showing an interaction between Group (TBI_Rec, TBI_nonRec, HC) and Time (Time 1 vs. Time2) included posterior cingulate and medial frontal cortices (yellow). The inset graph shows the interaction in the medial frontal region. Error bars represent standard error of the mean (SEM).
the DN may eventually be useful to identify individuals who will require more intensive reha-bilitation after mTBI.
While any interpretation of these findings must remain highly speculative, it is possible that hypoactivation of the DN is a signal that the brain has to work harder to accomplish even the relatively simple 0-back task. This interpretation is suggested by work such as Singh and Faw-cett [38], who showed that the DN deactivates as a function of task load: as a task becomes more difficult, subjects deactivate their DN. It is therefore tempting to conclude that the mTBIs in our sample who showed hypoactivation in their DNs and did not recover had to ex-pend more cognitive resources on the 0-back task than the subjects who were able to maintain activation in their DNs and later recovered. Why this would be so is not possible to know in the current sample, but is likely to be a fruitful avenue of future work.
One seemingly surprising result from the comparison of the 0-back data across time (72 hours after injury vs. 1 week after injury) is that the activation appears to decrease in the DN across time in the HCs and mTBIs who recovered. Given that one might expect the task to be-come‘easier’with practice, one would expect the DN activation to increase. This is because prior research has shown that DN activity decreases as tasks become more difficult (and, con-versely, increases as tasks become easier) (e.g., [38]). However, the comparison of the 0-back task at the two time-points in the current study is complicated by the fact that at Time 2 (1 week after injury) all three n-back tasks were administered in randomized order. Thus, the 0-back task at Time 2 was qualitatively different from the 0-back task at Time 1 because of the effect of context. At Time 2, subjects had had experience of 1-back and 2-back as well as 0-back, and therefore the responses appropriate for the other n-back tasks (1-back and 2-back) had to be inhibited during the performance of the 0-back task. This change in task context may explain why the activation in the DN was less at Time 2 than at Time 1 for the HCs and for the mTBIs who recovered. This hypothesis does not explain why activation increased in the DN for the mTBIs who did not recover, and further work is required to fully understand this.
One of the strengths of our study is a highly characterized TBI population. We enrolled sub-jects in the emergency department and performed structured interviews and neurocognitive testing at the bedside. At initial presentation after head injury, our research staff was able to Table 7. Brain regions showing an interaction between Group and Load at 1 week post injury.
mTBI vs. HC,final follow-up
BA X Y Z F-value*
Load (0-,1-,2-Back)
Superior Frontal Gyrus 9 -22 43 14 15.05
Middle Frontal Gyrus 6 -22 -10 50 35.35
Middle Frontal Gyrus 6 25 -10 50 41.54
Inferior/Middle Frontal Gyrus 47 -22 34 -9 12.41
Insula 13 -25 22 8 19.38
Caudate Head - 16 16 2 20.08
Precuneus 7 7 -61 44 24.97
Parahippocampal Gyrus 36 -37 -25 -12 19.36
Culmen - -4 -34 -15 15.22
Cerebellar Tonsil - 40 49 -30 16.61
Group (mTBI vs.HC) X Load (0-,1-,2-Back)
Middle Temporal Gyrus 39 50 -52 8 8.37
*the F-value is for the voxel of maximal intensity in each cluster.
Fig 3. Differences in activation patterns between patients and controls in response to increased working memory load.The area showing an interaction between Group (mTBI vs. HC) and Load (0back, 1back, 2back) at Time 2 (the middle temporal gyrus). The inset graph shows this interaction. The error bars represent the standard error of the mean (SEM).
doi:10.1371/journal.pone.0126110.g003
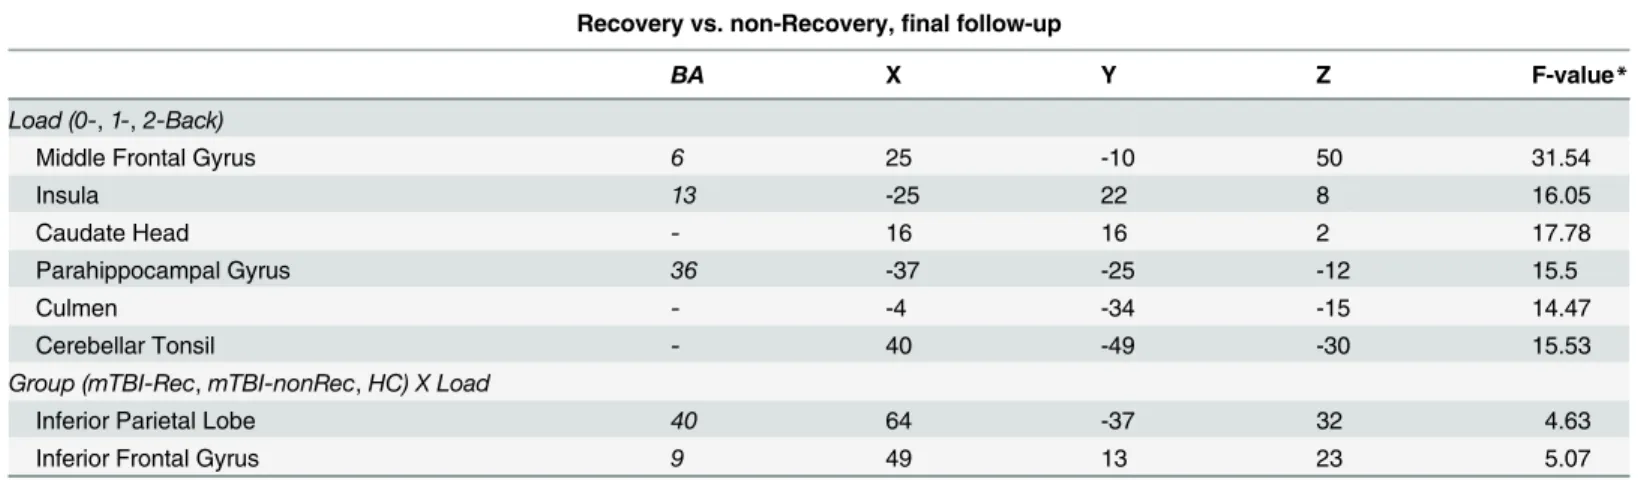
Table 8. Brain regions showing an interaction between Group and Load at 1 week post injury.
Recovery vs. non-Recovery,final follow-up
BA X Y Z F-value*
Load (0-,1-,2-Back)
Middle Frontal Gyrus 6 25 -10 50 31.54
Insula 13 -25 22 8 16.05
Caudate Head - 16 16 2 17.78
Parahippocampal Gyrus 36 -37 -25 -12 15.5
Culmen - -4 -34 -15 14.47
Cerebellar Tonsil - 40 -49 -30 15.53
Group (mTBI-Rec,mTBI-nonRec,HC) X Load
Inferior Parietal Lobe 40 64 -37 32 4.63
Inferior Frontal Gyrus 9 49 13 23 5.07
*the F-value is for the voxel of maximal intensity in each cluster.
ascertain reliable information about the event, which is subject to recall bias in other studies that have enrolled patients at later time points. We performed comprehensive clinical evalua-tions at follow-up to provide characterization of functional recovery in the early phase after mTBI (a comprehensive clinical evaluation was also performed at initial presentation). A sec-ond strength is the early neuroimaging obtained by bringing emergency department patients directly to a research magnet. This study design allowed us to obtain a large series of MRIs with corresponding clinical information during the early (<1 week) time period after mTBI. It is
only through obtaining data at multiple time points that the mechanisms of functional recov-ery can be inferred.
Our exclusion criteria might be considered less stringent than other studies, because we en-rolled all adult emergency department patients with mTBI, only excluding past history of TBI requiring surgical intervention, psychiatric condition within the last year, or active alcohol/ drug intoxication. The less stringent exclusion criteria might also be considered a strength of our study because it makes our results more generalizable to the larger population of emergen-cy department patients with heads injures.
Despite our attempts to include a diverse population of mTBI patients, our sample may not represent the whole mild traumatic brain injury population. We did not include children or older adults (our cutoff was 60 years of age). Individuals with alcohol and/or drug intoxication Fig 4. Indices of recovery as a function of increased memory load.Areas showing an interaction between Group (mTBI-Rec, mTBI-nonRec, HC) and Load (0back, 1back, 2back). The inset graph shows the interaction for the inferior frontal region. Error bars represent the standard error of the mean (SEM).
also make up a significant portion of emergency medicine trauma cases, but were not repre-sented in this study.
Additionally, we were unable to capture the“true”initial time point after injury, and the timing of the first MRI varied between 11 hours and 72 hours after trauma. Functional recovery after brain injury may begin to occur immediately, and the earliest changes in cortical activa-tion patterns would not be detected with our study design. The injury mechanisms were vari-able and although we documented the patient’s report of the mechanism, the actual injury parameters (such as impact angle and force, which can be measured through linear accelerom-eters in a cap or helmet) are unknown. Another limitation is that the outcome measure of clini-cal recovery was based on patient report. This may be problematic, because patients may have deficits that are not apparent to them, but only manifested on neurocognitive testing. In fact, our secondary outcomes of neurocognitive testing did not reveal significant differences in cog-nitive performance in patients who reported cogcog-nitive recovery compared to those who did not. Without pre-injury neurocognitive testing the results of tests obtained after injury can only be compared to standardized databases and tracked over time. However, inasmuch as pre-injury testing was not available on the individuals in this study, we felt that the patient’s report of cognitive improvement and resolution of symptoms was the most valid clinical
outcome measure.
While the findings reported here are encouraging, they are just the first step towards pre-dicting recovery in mTBI. Few clinics have the facilities to scan every patient who presents with a mTBI, and even fewer have the resources to do so. Future work will be to develop inexpen-sive, sensitive, diagnostic measures that correlate with changes in brain activation, and that can be easily administered in clinical settings to predict recovery.
Conclusions
We describe patterns of brain activation during working memory tasks in the acute and sub-acute phases after mTBI. Normalization of activation patterns in the posterior cingulate cortex, a major node of the default network [33], corresponded to clinical recovery. Additionally, stronger engagement of working memory resulted in increased, possibly compensatory, re-cruitment of right-lateralized frontal and parietal regions in patients who did not recover 1 week after the injury. Our results provide critical insight into functional activation of working memory networks during the early phase of recovery after mTBI.
Author Contributions
Conceived and designed the experiments: MRN GW KF MS RW. Performed the experiments: AT MS. Analyzed the data: GW KF AT MO. Contributed reagents/materials/analysis tools: RW. Wrote the paper: GW KF AT MS MO RW MRN.
References
1. Das A, Botticello AL, Wylie GR, Radhakrishnan K. Neurologic disability: a hidden epidemic for India. Neurology. 2012; 79(21):2146–7. Epub 2012/11/22. doi:10.1212/WNL.0b013e3182752cdbPubMed PMID:23170012; PubMed Central PMCID: PMC3511929.
2. Faul MX L, Wald MM, Coronado VG. Traumatic Brain Injury in the United States: Emergency Depart-ment Visits, Hospitalizations and Deaths 2002–2006. Centers for Disease Control and Prevention, Na-tional Center for Injury Prevention and Control. 2010;Atlanta (GA).
4. Arciniegas DB, Anderson CA, Topkoff J, McAllister TW. Mild traumatic brain injury: a neuropsychiatric approach to diagnosis, evaluation, and treatment. Neuropsychiatric disease and treatment. 2005; 1 (4):311–27. Epub 2008/06/24. PubMed PMID:18568112; PubMed Central PMCID: PMC2424119.
5. Christodoulou C, DeLuca J, Ricker JH, Madigan NK, Bly BM, Lange G, et al. Functional magnetic reso-nance imaging of working memory impairment after traumatic brain injury. J Neurol Neurosurg Psychia-try. 2001; 71(2):161–8. Epub 2001/07/19. PubMed PMID:11459886; PubMed Central PMCID: PMC1737512.
6. Hillary FG, Medaglia JD, Gates K, Molenaar PC, Slocomb J, Peechatka A, et al. Examining working memory task acquisition in a disrupted neural network. Brain. 2011; 134(Pt 5):1555–70. Epub 2011/05/ 17. awr043 [pii]doi:10.1093/brain/awr043PubMed PMID:21571783.
7. Kasahara M, Menon DK, Salmond CH, Outtrim JG, Tavares JV, Carpenter TA, et al. Traumatic brain in-jury alters the functional brain network mediating working memory. Brain Inj. 2011; 25(12):1170–87. Epub 2011/09/22. doi:10.3109/02699052.2011.608210PubMed PMID:21932994.
8. McAllister TW, Flashman LA, McDonald BC, Saykin AJ. Mechanisms of working memory dysfunction after mild and moderate TBI: evidence from functional MRI and neurogenetics. J Neurotrauma. 2006; 23(10):1450–67. Epub 2006/10/06. doi:10.1089/neu.2006.23.1450PubMed PMID:17020482.
9. McAllister TW, Sparling MB, Flashman LA, Guerin SJ, Mamourian AC, Saykin AJ. Differential working memory load effects after mild traumatic brain injury. Neuroimage. 2001; 14(5):1004–12. Epub 2001/ 11/08. doi:10.1006/nimg.2001.0899 S1053-8119(01)90899-7[pii]. PubMed PMID:11697932.
10. Newsome MR, Scheibel RS, Steinberg JL, Troyanskaya M, Sharma RG, Rauch RA, et al. Working memory brain activation following severe traumatic brain injury. Cortex. 2007; 43(1):95–111. Epub 2007/03/06. PubMed PMID:17334210.
11. Palacios EM, Sala-Llonch R, Junque C, Roig T, Tormos JM, Bargallo N, et al. White matter integrity re-lated to functional working memory networks in traumatic brain injury. Neurology. 2012; 78(12):852–60. Epub 2012/02/22. WNL.0b013e31824c465a [pii]doi:10.1212/WNL.0b013e31824c465aPubMed PMID:22345222.
12. Perlstein WM, Cole MA, Demery JA, Seignourel PJ, Dixit NK, Larson MJ, et al. Parametric manipulation of working memory load in traumatic brain injury: behavioral and neural correlates. J Int Neuropsychol Soc. 2004; 10(5):724–41. Epub 2004/08/26. doi:10.1017/S1355617704105110S1355617704105110 [pii]. PubMed PMID:15327720.
13. Ricker JH, Hillary FG, DeLuca J. Functionally activated brain imaging (O-15 PET and fMRI) in the study of learning and memory after traumatic brain injury. J Head Trauma Rehabil. 2001; 16(2):191–205. Epub 2001/03/29. PubMed PMID:11275578.
14. Sanchez-Carrion R, Fernandez-Espejo D, Junque C, Falcon C, Bargallo N, Roig T, et al. A longitudinal fMRI study of working memory in severe TBI patients with diffuse axonal injury. Neuroimage. 2008; 43 (3):421–9. Epub 2008/09/06. S1053-8119(08)00906-3 [pii]doi:10.1016/j.neuroimage.2008.08.003 PubMed PMID:18771738.
15. Turner GR, McIntosh AR, Levine B. Prefrontal Compensatory Engagement in TBI is due to Altered Functional Engagement Of Existing Networks and not Functional Reorganization. Front Syst Neurosci. 2011; 5:9. Epub 2011/03/18. doi:10.3389/fnsys.2011.00009PubMed PMID:21412403; PubMed Cen-tral PMCID: PMC3048219.
16. Wilde EA, Newsome MR, Bigler ED, Pertab J, Merkley TL, Hanten G, et al. Brain imaging correlates of verbal working memory in children following traumatic brain injury. Int J Psychophysiol. 2011; 82(1):86–
96. Epub 2011/05/14. S0167-8760(11)00132-2 [pii]doi:10.1016/j.ijpsycho.2011.04.006PubMed PMID:21565227; PubMed Central PMCID: PMC3277449.
17. McAllister TW, Saykin AJ, Flashman LA, Sparling MB, Johnson SC, Guerin SJ, et al. Brain activation during working memory 1 month after mild traumatic brain injury: a functional MRI study. Neurology. 1999; 53(6):1300–8. Epub 1999/10/16. PubMed PMID:10522888.
18. Edna TH, Cappelen J. Late post-concussional symptoms in traumatic head injury. An analysis of fre-quency and risk factors. Acta neurochirurgica. 1987; 86(1–2):12–7. PubMed PMID:3618301.
19. Ingebrigtsen T, Waterloo K, Marup-Jensen S, Attner E, Romner B. Quantification of post-concussion symptoms 3 months after minor head injury in 100 consecutive patients. Journal of neurology. 1998; 245(9):609–12. PubMed PMID:9758300.
20. McGarry LJ, Thompson D, Millham FH, Cowell L, Snyder PJ, Lenderking WR, et al. Outcomes and costs of acute treatment of traumatic brain injury. The Journal of trauma. 2002; 53(6):1152–9. doi:10. 1097/01.TA.0000025801.33552.71PubMed PMID:12478043.
22. Chen JK, Johnston KM, Collie A, McCrory P, Ptito A. A validation of the post concussion symptom scale in the assessment of complex concussion using cognitive testing and functional MRI. J Neurol Neurosurg Psychiatry. 2007; 78(11):1231–8. doi:10.1136/jnnp.2006.110395PubMed PMID: 17371902; PubMed Central PMCID: PMC2117618.
23. Gosselin N, Bottari C, Chen JK, Petrides M, Tinawi S, de Guise E, et al. Electrophysiology and function-al MRI in post-acute mild traumatic brain injury. J Neurotrauma. 2011; 28(3):329–41. doi:10.1089/neu. 2010.1493PubMed PMID:21309680.
24. Mayer AR, Mannell MV, Ling J, Elgie R, Gasparovic C, Phillips JP, et al. Auditory orienting and inhibition of return in mild traumatic brain injury: a FMRI study. Human brain mapping. 2009; 30(12):4152–66. doi:10.1002/hbm.20836PubMed PMID:19554558; PubMed Central PMCID: PMC2787969.
25. Jantzen KJ, Anderson B, Steinberg FL, Kelso JA. A prospective functional MR imaging study of mild traumatic brain injury in college football players. AJNR American journal of neuroradiology. 2004; 25 (5):738–45. PubMed PMID:15140712.
26. Lovell MR, Pardini JE, Welling J, Collins MW, Bakal J, Lazar N, et al. Functional brain abnormalities are related to clinical recovery and time to return-to-play in athletes. Neurosurgery. 2007; 61(2):352–9; dis-cussion 9–60. doi:10.1227/01.NEU.0000279985.94168.7FPubMed PMID:17762748.
27. Chen JK, Johnston KM, Petrides M, Ptito A. Recovery from mild head injury in sports: evidence from se-rial functional magnetic resonance imaging studies in male athletes. Clinical journal of sport medicine: official journal of the Canadian Academy of Sport Medicine. 2008; 18(3):241–7. doi:10.1097/JSM. 0b013e318170b59dPubMed PMID:18469565.
28. Pardini JE, Pardini DA, Becker JT, Dunfee KL, Eddy WF, Lovell MR, et al. Postconcussive symptoms are associated with compensatory cortical recruitment during a working memory task. Neurosurgery. 2010; 67(4):1020–7; discussion 7–8. doi:10.1227/NEU.0b013e3181ee33e2PubMed PMID: 20881565; PubMed Central PMCID: PMC2998066.
29. Bryer EJ, Medaglia JD, Rostami S, Hillary FG. Neural recruitment after mild traumatic brain injury is task dependent: a meta-analysis. J Int Neuropsychol Soc. 2013; 19(7):751–62. doi:10.1017/ S1355617713000490PubMed PMID:23656706.
30. Mayer AR, Mannell MV, Ling J, Gasparovic C, Yeo RA. Functional connectivity in mild traumatic brain injury. Human brain mapping. 2011; 32(11):1825–35. doi:10.1002/hbm.21151PubMed PMID: 21259381; PubMed Central PMCID: PMC3204375.
31. Stevens MC, Lovejoy D, Kim J, Oakes H, Kureshi I, Witt ST. Multiple resting state network functional connectivity abnormalities in mild traumatic brain injury. Brain imaging and behavior. 2012; 6(2):293–
318. doi:10.1007/s11682-012-9157-4PubMed PMID:22555821.
32. Han K, Mac Donald CL, Johnson AM, Barnes Y, Wierzechowski L, Zonies D, et al. Disrupted modular organization of resting-state cortical functional connectivity in U.S. military personnel following concus-sive 'mild' blast-related traumatic brain injury. Neuroimage. 2014; 84:76–96. doi:10.1016/j.neuroimage. 2013.08.017PubMed PMID:23968735; PubMed Central PMCID: PMC3849319.
33. Buckner RL, Andrews-Hanna JR, Schacter DL. The brain's default network: anatomy, function, and rel-evance to disease. Annals of the New York Academy of Sciences. 2008; 1124:1–38. doi:10.1196/ annals.1440.011PubMed PMID:18400922.
34. Harris PA, Taylor R, Thielke R, Payne J, Gonzalez N, Conde JG. Research electronic data capture (REDCap)—a metadata-driven methodology and workflow process for providing translational research informatics support. Journal of biomedical informatics. 2009; 42(2):377–81. Epub 2008/10/22. doi:10. 1016/j.jbi.2008.08.010PubMed PMID:18929686; PubMed Central PMCID: PMC2700030.
35. Lau B, Lovell MR, Collins MW, Pardini J. Neurocognitive and symptom predictors of recovery in high school athletes. Clinical journal of sport medicine: official journal of the Canadian Academy of Sport Medicine. 2009; 19(3):216–21. doi:10.1097/JSM.0b013e31819d6edbPubMed PMID:19423974.
36. Cox RW. AFNI: software for analysis and visualization of functional magnetic resonance neuroimages. Comput Biomed Res. 1996; 29(3):162–73. Epub 1996/06/01. S0010480996900142 [pii]. PubMed PMID:8812068.
37. Greicius MD, Krasnow B, Reiss AL, Menon V. Functional connectivity in the resting brain: a network analysis of the default mode hypothesis. Proceedings of the National Academy of Sciences of the Unit-ed States of America. 2003; 100(1):253–8. doi:10.1073/pnas.0135058100PubMed PMID:12506194; PubMed Central PMCID: PMC140943.