QUANTIFYING LAND USE/COVER CHANGE AND LANDSCAPE FRAGMENTATION
IN DANANG CITY, VIETNAM: 1979-2009
N. H. K. Linh a,b, S. Erasmi a, M. Kappas a
a Dept. of Cartography, GIS & Remote Sensing, Georg-August-University Goettingen, Goldschmidtstr 5, 37077 Goettingen, Germany – (nlinh, serasmi, mkappas)@uni-goettingen.de
b
Faculty of Land Resources & Agricultural Environment, Hue University of Agriculture & Forestry, 102 Phung Hung, Hue City, Vietnam
Commission VIII, WG VIII/8
KEY WORDS: Land use/cover, Landsat, ASTER, change detection, radiometric normalization
ABSTRACT:
Studying temporal changes of land use and land cover (LULC) from satellite images has been conducted in Vietnam several years. However, few studies have been done to consider seriously the relationship between LULC changes and the fragmentation of landscape. Hence, analysing the changes of LULC and landscape pattern helps revealing the interactions between anthropogenic factors and the environment, through which planning actions could be effectively supported. The present study aimed to examine these changes in the surroundings of Danang City, Vietnam from 1979 to 2009 based on Landsat Multi-Spectral Scanner (MSS), Landsat Enhanced Thematic Mapper Plus (ETM+) and ASTER satellite images. The Multivariate Alteration Detection (MAD) approach was employed for processing and postclassification change detection, from which key landscape indices were applied by using FRAGSTATS. The results showed that during the whole study period, there was a notable decrease of forestland, shrub, agriculture and barren while urban areas expanded dramatically. Further spatial analysis by using landscape metrics underlined the evidence of changes in landscape characteristics with an increase in total number of patches and patch density while the mean patch area decreased during the span of 30 years. Consequently, the landscape structure of Danang city became more fragmented and heterogeneous.
1. INTRODUCTION
Urbanization is believed one of the most prevalent anthropogenic causes of the losing arable land, devastating habitats, and the decline in natural vegetation cover (Dewan and Yamaguchi, 2009). As a consequence, rural areas have been converted into urban areas with an unprecedented rate and making a noted effect on the natural functioning of ecosystems (Turner, 1994). Consequently, a profound understanding of land use change is very important to have a proper land use planning and sustainable development policies (Braimoh and Onishi, 2007).
According to Myint and Wang (2006), to fulfil such a sustainable urban development, urban and regional planners have to summarise from numerous decisions. However, these decisions must be extracted from huge data sources which represent physical, biological and social parameters of urban areas in the continued spectrum of spatial and temporal domains. Hence, it is important to have an effective spatial dynamic tool, which is used to understand urban land-use and land-cover change (LULC) for predicting future change. Compared with various methods used to collect land use data, remote satellite technologies has proven its capacity in providing accurate and timely information on the geographic distribution of land use, especially for regional size areas (Sun
et al., 2009). With the support of Geographical Information Systems (GIS), satellite images can effectively estimate and analyse changes and LULC trends (Hathout, 2002).
Due to the fact that the rapid LULC change of one certain area is the driving force of change in ecological environment, which is continuously transforming landscape structure, thereby a need for comprehensive assessing and analyzing the change in
landscape at broad scales is required. Importantly, understanding the changes in spatial contribution of landscape pattern helps revealing the critical implication of complex relationship between anthropogenic factor and environment (Ning et al., 2010). To describe fragmentation and spatial distribution, a range of landscape metrics was calculated for each land use/cover class from satellite classification results by FRAGSTATS (Kamusoko and AniYa, 2006).
After the adoption of the “DOI MOI” policy in economy of the national assembly in 1986, Danang city has developed in many aspects. In addition, it was separated from Quang Nam Province in 1997 and has officially become an administration unit that directly belongs to the government. Since then, Danang city has asserted as the important position in nation level and the crucial factor of the main region economy of Middle area. This has caused the incessant land use/cover change in Danang for over past 20 years. Through exploring the land use map extracted from satellite data of different periods, the aims of the present study were to detect, quantify and characterise the changes of land use/cover and landscape fragmentation in Danang region.
2. STUDY AREA
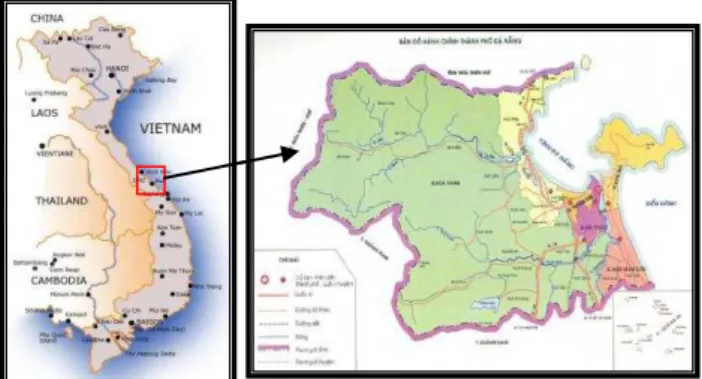
Danang city is located in Middle Central of Viet Nam, between the 15°55’19” to 16°13’20”N and 107°49’11” to 108°20’20”E (Figure 1). It is a long-stretching narrow region and well known as a dynamic city of the Key Economic Zone in central Viet Nam. The area consists of hills and mountains in the northwest and the Eastern Sea in the east. The altitude varies from 400m to 1524m above sea level; next to is the upland with low mountains and the delta takes ¼ areas in the southeast; it covers an area of 1,283.42km2, including Hoang Sa island district of 305 km2.
Figure 1. General location of Danang city, Vietnam (http://www.myvietnam.info/)(http://www.danang.gov.vn/) Climate of Danang city is in the zone of typical tropical monsoon. The average annual temperature is about 26oC, average rainfall is about 2,505mm per year and average humidity is 83.4%. There are two main seasons annually: the wet (August-December) and the dry (January-July). In 2009, the total population is about 887,070 and the population density is 906.7 persons per km2. Danang city is known as one of the most densely populated and urbanized area in Vietnam. With the economy development and population increasing, the local LULC in Danang city has changed seriously.
3. DATA AND METHOD
3.1 Data sources and Image preprocessing
Landsat and ASTER imagery were used for this study. The following criteria were considered for choosing proper data: (1) the images should be long time enough for detecting the land use change; (2) study area should not have cloud cover. Unfortunately, the study area is located near coastal. Due to the influence of weather, there are not many data satisfied both conditions. The images always have some thick cloud cover or haze. In addition, the study area is not entirely contained within one scene of Landsat either ASTER. Therefore, having acquisition images near anniversary dates for changing detection as Jensen mentioned (2005) was unavailable. In this study, three periods of satellite images were selected to classify study area: Landsat-3 MSS July 24, 1979; Landsat-7 ETM+ March 04 and April 14, 2003 (download free at
http://earthexplorer.usgs.gov/ and http://glovis.usgs.gov/ ); and
ASTER April 02, 2009. The details of data were described in Table 1. For this study, the reference data were also used, included: (1) topographic map 2001, at scale of 1/50.000; (2) land use maps in 1997, 2003 and 2010, at scale of 1/25.000. Because Landsat and ASTER imagery were collected at level 1T and 1B respectively, geometric correction do not require. However, images were acquired at different spatial resolution and projections. Therefore, all images were first rectified to Universal Transverse Mercator (UTM) coordinate system, Datum WGS 84, Zone 48 North for matching the geographic projection of the reference data. Images were also co-registered together within 25 well distributed GCPs (ground control points) and polynomial 1sd by means of OrthoEngineprovided by PCI Geomatica 10.3 software. RMS <0.5 was received. In addition, Nearest Neighbour resampling was set for not changing heavily the radiometric characteristic of image. In this study, the iteratively re-weighted multivariate alteration detection (IR-MAD) transformation was used for automatic radiometric
normalization for all images by means of ENVI 4.3 software; see (Canty, 2010, A. A. Nielsen et al., 1998, Canty and Nielsen, 2008). ASTER 02/04/2009 was chosen as reference image. However, this image does not cover all the region of study area, therefore a subset of 1800x1100 pixels with 30m spatial resolution including 968.17km2 was created for all images for further studying. This territory was chosen to ensure the specific study area was in the analysis image. Besides the requirement of the same dimension, images must have the same spectral resolution. Hence, the composite of standard false colours was used for this study: Landsat MSS (754); Landsat TM/ETM+ (432); ASTER (321).
3.2 LULC classification and Change detection
Six land use/cover classes were defined for image classification based on the modified Anderson land use/cover scheme level I (Anderson et al., 1976), included: (1) water, (2) forest, (3) shrub, (4) agriculture, (5) barren and (6) urban land. Anderson classification scheme was chosen because of the major land use/cover classes using images with differences in spatial resolution, which are Landsat MSS, Landsat ETM+ and ASTER. Supervised classification using maximum likelihood approach in ENVI 4.7 was individually applied for each image of study area to classify land use/cover. Maximum likelihood algorithm was preferred because this rule is considered to have accurate results because it has more accurate results than other algorithms (Mengistu D. A. and Salami A. T., 2007, Reis, 2008, Diallo Y. et al., 2009).
Because of various image acquisition dates, training areas for the images of the years 1979, 2003 and 2009 were different during the classification. In addition, the training areas were verified by references data. As the next step, post-classification comparison change detection algorithm was selected to detect changes in LULC from 1979 to 2009 in study area in order to minimize the problem in radiometric calibration of imagery of two different dates. For comparison of the classification results of two dates, a change detection matrix was created based on pixel-by-pixel (Jensen, 2005). Thereby, each type of from-to LULC change is identified.
3.3 Landscape fragmentation
To quantify landscape structure of this study, FRAGSTATS was applied because this spatial statistic program offers a comprehensive choice of landscape metrics. This program was created by decision maker, forest manager and ecologists therefore it is appropriate for analyzing landscape fragmentation or describing characteristics of landscape, components of those landscapes (Keleş et al., 2008). However, landscape patterns were complicated; hence, to clarify the relationship of spatial pattern and process it cannot use single metric alone (Ning et al., 2010, Esbah et al., 2009).
Based on the scale of study area (i.e. the district level) and its characteristic as well, eight related landscape metrics were selected: (1) total class area, (2) percentage of landscape, (3) number of patches, (4) largest patch index, (5) average size of patches, (6) mean patch shape, (7) proximity index, (8) Euclidean nearest distance, (9) Interspersion and juxtaposition index, (10) Shannon’s diversity index, (11) Shannon's evenness index. A brief description of those landscape metrics used in study was given in Table 2. Those descriptions could be also found at user’s guide of FRAGSTATSTM
(McGarigal, 2002).
Type of sensor Spatial resolution
(m)
Band Date Path Row Average cloud coverage (%)
Landsat-3 MSS 68 4-8 July 24, 1979 134 49 20
Landsat-7 ETM+ 30 1-5, 7 March 04, 2003 125 49 34.65 *
30 1-5,7 April 14, 2003 124 49 0.34
ASTER 15 1-3 April 02, 2009 - - 4
(* Although the average cloud coverage of Landsat-7 ETM+ is very high, there is almost no cloud in study area at that time). Table 1. Characteristics of satellite data used in study area
Index (unit) Description
CA (ha) Class area
PLAND Percentage of landscape
NP Number of patches
LPI (%) The percentage of the landscape comprised by the largest patch
AREA_MN (ha)
Average size of patches
SHAPE_MN (ha)
Mean patch shape complexity weighted by patch area, based on shortest edge-to-edge distance
PROX_MN (m)
Average proximity index for all patches in a class
ENN_MN(m) Mean Euclidean nearest neighbour distance
IJI (%)
Interspersion and juxtaposition index measures the juxtaposition of a focal patch class with all other classes
SHDI Shannon’s diversity index is amount of patch per individual;
SHEI
Shannon's evenness index is the observed level of diversity divided by the maximum possible diversity for a given patch richness
Table 2. Landscape pattern metrics description (McGarigal, 2002, Keleş et al., 2008)
4. RESULTS AND DISCUSSION
4.1 Land Use/ Cover Changes
Before doing any other interpretations, thematic LULC maps (1979, 2003 and 2009) were assessed their accuracy through four measurable means of error matrix: overall accuracy, producer’s accuracy, user’s accuracy and Kappa coefficient. A total of 300 stratified random pixels was taken for each LULC map and then checked with reference data. According to the accuracy assessment results of classified maps, the overall accuracy for Landsat MSS 1979, Landsat ETM+ 2003 and ASTER 2009 was 92.15%, 84.44% and 89.00% respectively; the Kappa Coefficient of those maps reached at 0.9021, 0.7534 and 0.8005, respectively. Collating with the minimum 85% accuracy stipulated by the Anderson classification scheme for satellite-derived LULC maps, these statistics were adequate for continuously studying (Anderson et al., 1976, Kamusoko and AniYa, 2006).
The LULC maps of study area were generated for all three years (Figure 3) and classification area statistics were summarised in table 3. The classified areas were measured by multiplying the number of pixel with spatial resolution of remote data (i.e. 30m), in which the pixel number was determined after applying postclassification analysis. And then
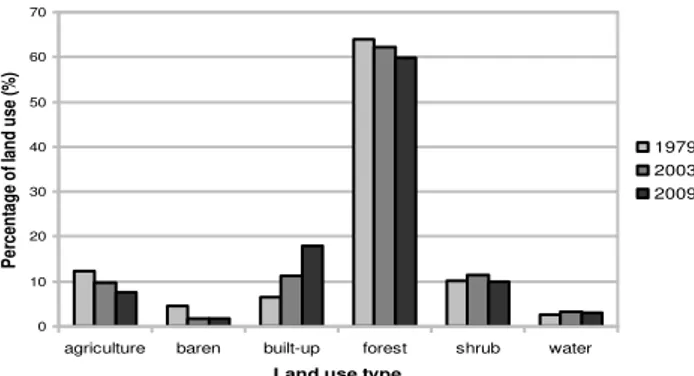
changes were defined based on the difference of pixel number between two dates. Based on Figure 2, forest and urban areas were the dominant LULC classes in spatial distribution pattern. Accordingly, forest area was counted for about 64%, 62.2% and 59.8% of the total area in 1979, 2003 and 2009 respectively; meanwhile urban area was occupied 6.5%, 11.3% and 17.9% of the total area in 1979, 2003 and 2009 respectively. The surface water body covers about 2.5%, 3.3% and 3.1% of the total region study in 1979, 2003 and 2009, respectively. The results also showed that from 1979 to 2009 LULC units under shrub, agriculture and barren decreased from 10.1% to 9.9%, 12.4% to 7.5% and 4.5% to 1.8%, respectively.
0 10 20 30 40 50 60 70
agriculture baren built-up forest shrub water
Land use type
P
er
ce
n
ta
g
e
o
f l
an
d
u
se
(%
)
1979 2003 2009
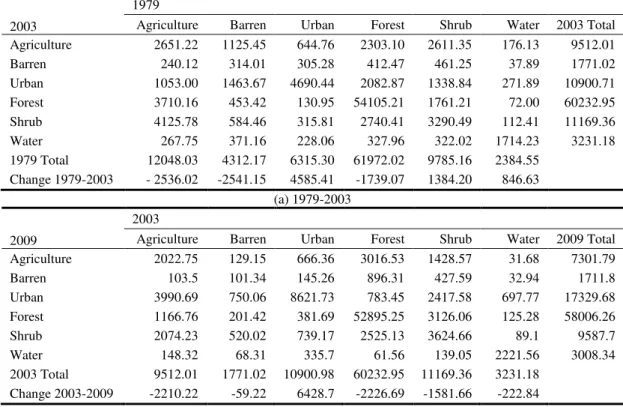
Figure 2. Areas land use/cover classes of Danang city To provide a further comprehensive calculation in losing and gaining among the six LULC classes, the from-to change matrix of land use/cover in Danang city were created in three intervals, 1979-2003, 2003-2009 and 1979-2009(Table 4). In cross tabulation, unchanged pixels were located along the major diagonal of the matrix while conversion values of classes were arranged in descending order. As can be seen from the Tables 3 and 4, there were small differences of area coverage of a particular class because of used different spatial resolutions for calculating LULC change from 2003 to 2009. In fact, the 2009 ASTER image was resampled to a spatial resolution of 30m.
LULC class
1979 2003 2009
Area
(ha) (%)
Area
(ha) (%)
Area
(ha) (%)
Agri-culture 12048.0 12.4 9512.0 9.8 7294.7 7.5
Barren 4312.2 4.5 1771.0 1.8 1708.9 1.8
Urban 6315.3 6.5 10900.7 11.3 17298.5 17.9
Forest 61972.0 64.0 60233.0 62.2 57936.2 59.8
Shrub 9785.2 10.1 11169.4 11.5 9575.8 9.9
Water 2384.6 2.5 3231.2 3.3 3003.6 3.1
Total 96817.2 100 96817.2 100 96817.7 100
Table 3. Results of and use/cover classification for 1979, 2003 and 2009 images
Figure 3. Land use/cover maps of Danang city area
2003
1979
Agriculture Barren Urban Forest Shrub Water 2003 Total
Agriculture 2651.22 1125.45 644.76 2303.10 2611.35 176.13 9512.01
Barren 240.12 314.01 305.28 412.47 461.25 37.89 1771.02
Urban 1053.00 1463.67 4690.44 2082.87 1338.84 271.89 10900.71
Forest 3710.16 453.42 130.95 54105.21 1761.21 72.00 60232.95
Shrub 4125.78 584.46 315.81 2740.41 3290.49 112.41 11169.36
Water 267.75 371.16 228.06 327.96 322.02 1714.23 3231.18
1979 Total 12048.03 4312.17 6315.30 61972.02 9785.16 2384.55 Change 1979-2003 - 2536.02 -2541.15 4585.41 -1739.07 1384.20 846.63
(a) 1979-2003
2009
2003
Agriculture Barren Urban Forest Shrub Water 2009 Total
Agriculture 2022.75 129.15 666.36 3016.53 1428.57 31.68 7301.79
Barren 103.5 101.34 145.26 896.31 427.59 32.94 1711.8
Urban 3990.69 750.06 8621.73 783.45 2417.58 697.77 17329.68
Forest 1166.76 201.42 381.69 52895.25 3126.06 125.28 58006.26
Shrub 2074.23 520.02 739.17 2525.13 3624.66 89.1 9587.7
Water 148.32 68.31 335.7 61.56 139.05 2221.56 3008.34
2003 Total 9512.01 1771.02 10900.98 60232.95 11169.36 3231.18 Change 2003-2009 -2210.22 -59.22 6428.7 -2226.69 -1581.66 -222.84
(b) 2003-2009
Table 4. Matrices of land use/cover changes in Danang city, Vietnam in hectares During 1979-2003, results showed that agriculture, barren
and forestry decreased strongly while urban area, shrub and water body increased, notably the raising of urban area. Table 4(a) indicated that the expansion of urban area was the most dramatic changes in the region, which was the result of promptly growing up of economic after applying “DOI MOI” policy. Based on statistic, 4585.41ha of urbanized area in this period was calculated, which was nearly as large as the coverage of urban area in 1979, thus representing an increase
of 73%. Analysing the component of the conversion of growth in urban area, 42.6% was converted from forestry, 25.3% from barren and 22.3% from shrub. The coverage of water body between 1979 and 2003 was significant difference because of the construction of two new reservoirs in study area. In second period, from 2003 to 2009, urban area was the only one which continuously increased, whereas the other classes decreased. Statistic from Table 4(b) showed the amount of urbanized area as 6428.7ha. The increase of urban area could be represented
2009
1979
Agriculture Barren Urban Forest Shrub Water 2009 Total
Agriculture 1777.5 969.21 122.85 2407.23 1943.91 74.34 7301.79
Barren 361.44 72.18 91.71 937.17 236.07 8.37 1711.8
Urban 2915.55 1930.23 5126.58 3872.61 2789.73 626.58 17329.68
Forest 3817.62 236.88 295.92 51499.8 1945.35 100.89 58006.26
Shrub 2881.62 749.79 456.84 2851.29 2549.16 83.61 9587.7
Water 291.33 348.12 204.93 345.06 317.7 1467.36 3008.34
1979 Total 12048.03 4312.17 6315.57 61972.02 9785.16 2384.55 Change 1979-2009 -4746.24 -2600.37 11014.11 -3965.76 -197.46 623.79
(c) 1979-2009
Table 4. Matrices of land use/cover changes in Danang city, Vietnam in hectares (continued) as 59% of its 2003 area by 2009. Of the area that urban got
from 2003 to 2009, 51.7% was converted from agriculture and 26.1% from shrub. In the span of 30 years, the coverage of urban area has incessantly increased from 6315.57ha in 1979 to 17329.68ha in 2009, thus representing an increase of 174.4% (11014.11ha).
Table 4(c) indicated that the increasing of urban area in Danang city mainly came from about 32.4%, 25.4%, 25.3% and 17.5% of forestry, agriculture, shrub and barren area, respectively. Based on Figure 3, the difference of spatial distribution of urban area could be clearly observed by the years. In 1979, the urban area dispersedly located along the costal line. By 2003, this area was expanded more concentrated along coastal zone and moved toward Sontra peninsula. From 2003 to 2009, the urban expansion changed the direction from costal toward in land.
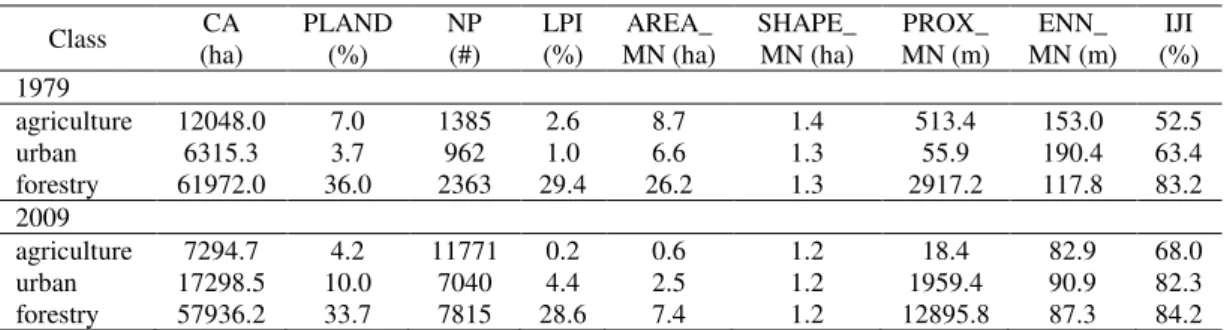
4.2 Fragmentation Analyses
From LULC maps in 1979 and 2009, three most changing classes (agriculture, urban and forest) were chosen to compute spatial landscape matrices at class level by means of FRAGSTATS software (Table 5). In Danang city, forestry area presented as the dominance class of landscape because its percentage of total area is largest. The statistic of forestry showed that the percentage of landscape (PLAND) index decreased from 36 to 33.7, while the number of patches (NP) increased from 2363 to 7815 during the whole period from 1979 to 2009. This combination result suggested the breaking up of forestry areas into smaller parcels. This was supported by the largest patch index (LPI - decreased from 29.4 to 28.6) and the mean patch area (AREA_MN – decreased from 26.2 to 7.4). The values of mean shape index (SHAPE_MN) of forestry for the 1979 and the 2009 were over than 1, exposing that the average forestry patch shape was non-square and there was no significant difference in shape index values.
The increasing of mean proximity index (PROX_MN, defined by 200m) from 2917.2 to 12895.8 indicated that forested patches in 2009 became more contiguous in spatial distribution than in 1979. This was asserted once again by the decreasing of mean nearest neighbour distance (ENN_MN) from 117.8 to 87.3 and the interspersion and juxtaposition index (IJI) from 83.2 to 84.2. In regards to agriculture area during the period 1979-2009, the number of patches (NP) increased from 1385 to 11771, the mean patch area (AREA_MN) decreased from 8.7 to 0.6 and the mean proximity (PROX_MN) decreased from 513.4 to 18.4. These values revealed that the 2009 agriculture patches were more isolated than the 1979 patches.
The spatial analysis of urban areas showed the significant increasing of the percentage of landscape index (PLAND) from 6315.3 to 17298.5, the number of patches (NP) from 962 to 7040, the largest patch index (LPI) from 1.0 to 4.4. These indexes evidenced that the expansion of urban areas also concentrated on existent urban. Finally, the growth of mean proximity (PROX_MN) from 55.9 to 1959.4 and of the interspersion and juxtaposition index (IJI) from 63.4 to 84.2 indicated that urban class distributed a more landscape configuration in 2009 than in 1979.
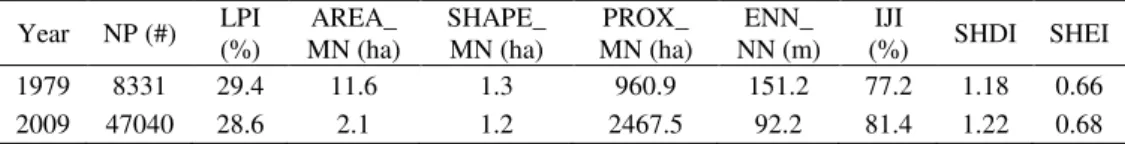
The comprehension analysis in landscape level showed the evidence of fragmentation of landscape with the increasing of total number of patches from 8331 to 47040 while the mean patch area decreased from 11.6 to 2.1 during the whole study period. In addition, both Shannon’s diversity and evenness indices in 2009 were greater than in 1979, showing the slight increase of the landscape heterogeneity and evenness. The decrease of mean nearest-neighbour distance (ENN_MN) from 151.2 to 92.2 whereas the mean proximity index (PROX_MN) became higher revealed that patches tended less isolated. Besides, interspersion and juxtaposition index (IJI) from 77.2 to 81.3 indicated a trend towards the uniform configuration of landscape.
Class CA
(ha)
PLAND (%)
NP (#)
LPI (%)
AREA_ MN (ha)
SHAPE_ MN (ha)
PROX_ MN (m)
ENN_ MN (m)
IJI (%) 1979
agriculture 12048.0 7.0 1385 2.6 8.7 1.4 513.4 153.0 52.5
urban 6315.3 3.7 962 1.0 6.6 1.3 55.9 190.4 63.4
forestry 61972.0 36.0 2363 29.4 26.2 1.3 2917.2 117.8 83.2
2009
agriculture 7294.7 4.2 11771 0.2 0.6 1.2 18.4 82.9 68.0
urban 17298.5 10.0 7040 4.4 2.5 1.2 1959.4 90.9 82.3
forestry 57936.2 33.7 7815 28.6 7.4 1.2 12895.8 87.3 84.2
Table 5. Metrics of landscape structure for selected indices at the class level, 1979 and 2009
Year NP (#) LPI (%)
AREA_ MN (ha)
SHAPE_ MN (ha)
PROX_ MN (ha)
ENN_ NN (m)
IJI
(%) SHDI SHEI
1979 8331 29.4 11.6 1.3 960.9 151.2 77.2 1.18 0.66
2009 47040 28.6 2.1 1.2 2467.5 92.2 81.4 1.22 0.68
Table 6. Metrics of landscape structure for selected indices at the landscape level, 1979 and 2009 5. CONCLUSIONS
By using the remote sensing and GIS techniques, this paper describes the analysis of LULC and landscape change in the Danang region, Vietnam during the period 1979-2009. The analysis carried out found that a notable decrease of agriculture, forest, barren and shrub because of conversion to urban land during the span of 30 years has taken place. For further understanding, key landscape indices were set for three main classes to perform the different changes in landscape structure in the surroundings of Danang city. The dynamic change of class indices revealed the break-up of this area into smaller patches. However, except agriculture, patches of forestry and urban tended to have a uniform landscape configuration. Accordingly, urban area showed the expansion in a concentrated way.
6. ACKNOWLEDGEMENT
The author is grateful to Prof. Dr Martin Kappas and Dr Stefan Erasmi for their support and helpful comments on an earlier draft of this paper. The author thanks also Dr. Mort Canty for providing IDL extensions used for this study. References
A. A. Nielsen, Conradsen, K. & Simpson, J., 1998. Multivariate alteration dectection (MAD) and MAF postprocessing in multispectral, bitemporal image data: new approaches to change detection studies,
Remote Sensing of Environment, 64, 1-19.
Anderson, J.R., Hardy, E.E., Roach, J. & Witmer, R.E., 1976. A land use/cover classification system for use with remote sensor data, US Geological Survey Professional 964: Sious Falls, SD.
Braimoh, A.K. & Onishi, T., 2007. Geostatistical techniques for incorporating spatial correlation into land use change models, International Journal of Applied Earth Observation and Geoinformation, 9, 438. Canty, M.J., 2010. Image analysis, classification and change
detection in remote sensing with algorithms for ENVI/IDL, Second edn, Vol., pp. Pages, Taylor and Francis.
Canty, M.J. & Nielsen, A.A., 2008. Automatic radiometric normalization of multitemporal satellite imagery with the iteratively re-weighted MAD transformation, Remote Sensing of Environment,
112, 1025-1036.
Dewan, A.M. & Yamaguchi, Y., 2009. Land use and land cover change in Greater Dhaka, Bangladesh: Using remote sensing to promote sustainable urbanization,
Applied Geography, 29, 390-401.
Diallo Y., Hu G. & Wen X., 2009. Applications of Remote Sensing in Land Use/Land Cover Change Detection in Puer and Simao Counties, Yunnan Province,
Journal of American Science, 5, 157-166.
Esbah, H., Deniz, B., Kara, B. & Kesgin, B., 2009. Analyzing landscape changes in the Bafa Lake Nature Park of
Turkey using remote sensing and landscape structure metrics, Environmental Monitoring and Assessment,
165, 617-632.
Hathout, S., 2002. The use of GIS for monitoring and predicting urban growth in East and West St Paul, Winnipeg, Manitoba, Canada, Journal of Environmental Management, 66, 229-238.
http://www.danang.gov.vn/ Retrieved 10/04/2010, from
http://www.danang.gov.vn/TabID/76/CID/711/ItemID/8
743/default.aspx.
http://www.myvietnam.info/ Retrieved 20/12/2011, from
http://www.myvietnam.info/
Jensen, J.R., 2005. Introductory digital image processing: a remote sensing perspective, 3nd edn, Vol., pp. Pages, 3nd Edition, NJ: Prentice-Hall.
Kamusoko, C. & AniYa, M., 2006. Land use/cover change and landscape fragmentation analysis in the Bindura district, Zimbabwe, Land Degradation and Development, 18, 221-233.
Keleş, S., Sivrikaya, F., Çakir, G. & Köse, S., 2008. Urbanization and forest cover change in regional directorate of Trabzon forestry from 1975 to 2000 using landsat data,
Environmental Monitoring and Assessment, 140, 1-14. McGarigal, K., SA Cushman, MC Neel, and E Ene, 2002.
FRAGSTATS: Spatial Pattern Analysis Program for Categorical Maps. Computer software program produced by the authors at the University of Massachusetts, Amherst. Available at the following web site:
http://www.umass.edu/landeco/research/fragstats/fragsta
ts.html.
Mengistu D. A. & Salami A. T., 2007. Application of remote sensing and GIS inland use/land cover mapping and change detection in a part of south western Nigeria,
African Journal of Environmental Science and Technology, 1, 99-109.
Myint, S.W. & Wang, L., 2006. Multicriteria decision approach for land use land cover change using Markov chain analysis and a cellular automata approach, Canadian of Remote Sensing, 32, 390-404.
Ning, J., Liu, G., Liu, Q. & Xie, C., 2010. Land use change and ecological environment evolution in Taihu Lake Basin.
in International Conference on Geoinformatics 18th, 2010 ed Yu Liu, A. C., Beijing, China.
Reis, S., 2008. Analyzing Land Use/Land Cover Changes Using Remote Sensing and GIS in Rize, North-East Turkey,
Sensors, 8, 6188-6202.
Sun, Z., Ma, R. & Wang, Y., 2009. Using Landsat data to determine land use changes in Datong basin, China,
Environmental Geology, 57, 1825-1837.
Turner, B.L., 1994. Local faces, global flows: The role of land use and land cover in global environmental change, Land Degradation and Development, 5, 71-78.