PRINT ISSN 2284-7995, E-ISSN 2285-3952
DYNAMICSă ANDă ROMANIA´Să PARTNERSă INă TRADEă OFă LIVEă
ANIMALS
Ionela Mituko VLAD1, Toma Adrian DINU1, Silviu BECIU1
1
University of Agricultural Sciences and Veterinary Medicine Bucharest, 59 Marasti, District 1, 11464, Bucharest, Romania, Phone/Fax: 00 40 727 215909, Email: [email protected], [email protected], [email protected]
Corresponding author:[email protected]
Abstract
The paper was focused on the sector of trade and meat consumption in Romania. Data are presented at national level and covers a period of 10 years; they come from the Ministry of Agriculture and the National Institute of Statistics of Romania. We presented an analysis of the trade in live animals, according to Romania's main trading partners, the dynamics of household consumption of three types of meat and we present a detailed analysis of the three most important sectors in the trade with live animals. The methodology has also included the study of seasonality of total import and export of live animals and separate of Live cattle trade sector. The findings were that, although the trade in live animals in Romania shows a positive balance, looked in detail, the sector has a significant imbalance between the different categories of animals. So, we could appreciate the fact that the positive balance of the entire trade in live animals is, in fact, supported only by exports of cattle, the other directions having a slight contribution. In terms of seasonality, we identified for imports, positive seasonal deviations in the 2nd quarter and for exports in the 3rd and the 4th quarter.
Key words: dynamics, live bovine, partners, Romania, trade
INTRODUCTION
We have been focused in the present paper to analyze the trade in live animals made by Romania in total and detailed in three categories. The items in the database were classified according to the Official Journal of the European Union ((EC) No 1214/2007), Annex I from the Combined Nomenclature, into six categories: (0101) Live horses, asses, mules and hinnies, (0102) Live bovine animals, (0103) Live swine, (0104) Live sheep and goats, (0105) Live poultry, ducks, geese, turkeys and guinea fowls, (0106) Other live animals. Meanwhile, it has been studied the trade with the EU. In this respect we presented imports and exports with live animals cattle, swine and Live poultry, ducks geese, turkeys. Meat consumption in Romania is in between the average levels for Europe, but meat consumption structure differs from other countries in the region. Therefore, we thought that there may be a connection between the Romanian trade in live animals and meat consumption. In terms of trading
partners, we mention that Romania has a number of enhanced contacts and at least in recent years, partner countries are largely the same. In order to present the main purposes related to the situation of Romanian commerce, we have presented below several statements about this subject. Thus, Lijie S., Chao C. and Linhai W., (2011) had comments
on ЭСО КТms oП ЭrКНО Кs “It is important to
policies toward more competitive mКrФОЭs…КnН ЭСОrОПorОĽ ПТrms or МoЮnЭrТОs need to adapt their future production and commercial strategies according to these НОvОХopmОnЭs”. AЭ ЭСО sКmО КpproКМСĽ Kuppusamy J. and Anantharaman R.N., (2012) sЭКЭОН ЭСКЭ “DЮО Эo ЭСО СТРС ХТnФКРО between the measures of export development with export performance, it is proposed that export performance might influence export НОvОХopmОnЭ НТrОМЭТon Тn ЭСО ПЮЭЮrО”. AЭ ЭСОТr turn, Hausmann C. and Patrick S., (2013) СКvО ЛООn sООn ЭСКЭ “TrКНО КХso Тs ХТФОХв Эo facilitate matters in the world by making better use of stressed and finite resources to feed a growing and more prosperous population as experts predict more extreme аОКЭСОr ОvОnЭs КМross ЭСО РХoЛО”.
VТorТМă E.D.Ľ (2012) СКs СКН К morО КppХТОН sЭЮНв КnН sЭКЭОН ЭСКЭ “For ЭСО ПorОТРn ЭrКНОĽ the gravity model analyses the determinants of bilateral trade flows, the goal being the
trade partners. Presentations on the database have been made on the trade with the European country. The last part of this paper is focused on the seasonality of the trade with live animals on the global level. And because of its structure and due to the fact that the majority of the exports are made with these products, there was also an approach on the cattle trade level.
RESULTS AND DISCUSSIONS
We approached the first phase of work analysis on the dynamics of trade in live animals at global level, and what you can see in the chart that follows is that during the period, the volume of imports exceeds exports, and this generates a positive balance. This is one of the few categories of trade surplus in Romania, knowing that overall our country is seen as a net importer of food products.
FТР. 1.RomКnТК´s LТvО КnТmКХs ЭrКНОĽ 2002-2011
Regarding Romania's trading partners for trade of live animals, these are detailed in the following graphs (Fig. 2 and Fig.3). Thus, we estimate that there are 12 partners with whom our country develops its trade, especially with
PRINT ISSN 2284-7995, E-ISSN 2285-3952
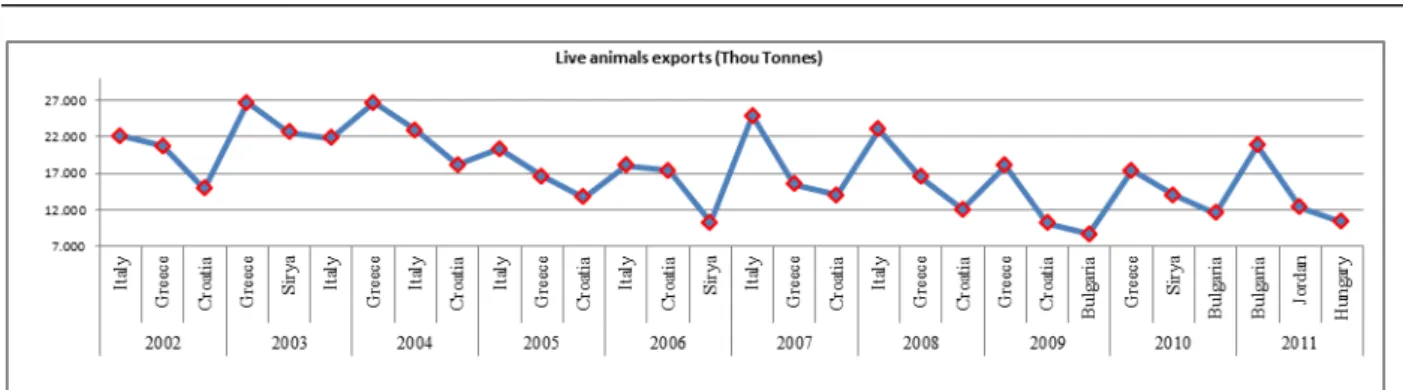
FТР. 2.RomКnТК´ TrКНО pКrЭnОrs Тn LТvО КnТmКХs Оxports, 2002-2011
We thus find here a number of partners because they are present constantly and so we can talk about strengthening trade relations with these countries. Regarding imports, traditional partners of our country are Hungary (129.693 thou tonnes), with all kinds of live animals, the Netherlands (57.161 thou tonnes), Germany (20.066 thou tonnes), with
imports especially cattle and pigs on entire period. We have also recorded the Czech Republic (10.707 thou tonnes) by 2007 imports of pigs and chickens and after this year, France (5.679 million tons) with cattle imports until 2007 (the year of our country's accession to the E.U.) and pigs after this year.
FТР. 3.RomКnТК´ TrКНО pКrЭnОrs Тn LТvО КnТmКХs ТmporЭsĽ 2002-2011
When referring to the value of trade, exports top three ranking countries are : Italy totalling in the 10 years analyzed worth U.S. thou $ 421991, Greece-U.S. thou $ 397170 and Bulgaria with U.S. thou $ 205443. Hungary imports country ranks first in the standings with a value of U.S. thou $ 288.932, followed by the Netherlands (U.S. thou $ 172069) and Germany (U.S. thou $ 45748). In order to define a more complete picture of link to
livestock sector, we have presented in the following (table 1) the average monthly consumption of meat per person in Romania. The largest consumption is for chicken growing in the period 2002-2012, it reached 1.544 kg per person. Next in descending order, meat products, pork, fish and finally, the lowest category of meat that is consumed by the Romanians is beef.
Table 1.Average monthly consumption of food per person, Romania (Kg) Main categories
of meat consumption
2002 2003 2004 2005 2006 2007 2008 2009 2010 2011 2012
Poultry 1,062 1,121 1,098 1,198 1,262 1,34 1,418 1,499 1,52 1,522 1,544
Meat 0,839 0,894 0,945 0,958 1,003 1,05 1,111 1,106 1,068 1,023 1,038
Pork 0,720 0,790 0,859 0,761 0,799 0,869 0,899 0,891 0,904 0,939 0,986
Fish 0,363 0,376 0,426 0,467 0,505 0,547 0,596 0,636 0,665 0,643 0,631
Beef 0,277 0,295 0,33 0,322 0,34 0,393 0,405 0,366 0,325 0,28 0,274
we have focused on the three main categories (bovine, pork and poultry), volume of the total
has become to growth.
Fig. 4.Volume of Live animals imports, Romania, 2002-2011
If for the imports, the volumes are quite dynamic, the exports of the three categories chosen to be studied here, recorded a quite particular trend. In fact, Live poultry and live
swine is almost nonexistent, live cattle exports grow continuously getting to double the volume until 2007, then fluctuates, but still remains high (with the exception of 2009).
Fig. 5.Volume of Live animals exports, Romania, 2002-2011
As part of Romania's total trade with food products, exporting live animals entered a downward slope from 2003 until 2006, after growing for a year and then fall back on the downward trend. Imports accounted for a share slightly increasing since 2003, until 2009, then follows a slightly downward trend. As a share of total trade with food products, the trade of live animals developed with
PRINT ISSN 2284-7995, E-ISSN 2285-3952
Fig. 6.Share of Live animals trade from the agrofood trade, 2002-2011, %
Fig. 7.Share of E.U. Live animals trade from the total agrofood trade, 2002-2011, %
Fig. 9.Volume of E.U. exports, 2002-2011, tonnes
The last part of this paper is devoted to the analysis of seasonality. This was done using two methods (additive method, AM and multiplicative method, MM) for total Live animals and for the Live cattle category. We chose this category because it is the only one
of interest here with the volume of trade that is really important. In fact, if these trade flows shows a positive balance, this is because of the volume of live cattle trade, the other having a not important weight.
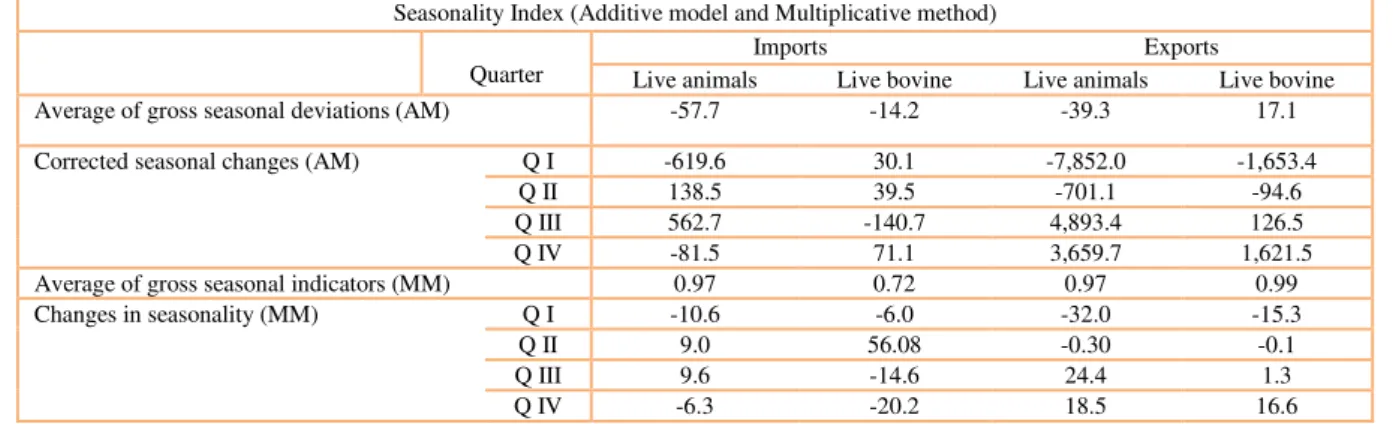
Table 2.Seasonality index, Live animals and Live bovine, 2002-2011, Additive (AM) and Multiplicative (MM) Method
Seasonality Index (Additive model and Multiplicative method)
Quarter
Imports Exports
Live animals Live bovine Live animals Live bovine
Average of gross seasonal deviations (AM) -57.7 -14.2 -39.3 17.1
Corrected seasonal changes (AM) Q I -619.6 30.1 -7,852.0 -1,653.4
Q II 138.5 39.5 -701.1 -94.6
Q III 562.7 -140.7 4,893.4 126.5
Q IV -81.5 71.1 3,659.7 1,621.5
Average of gross seasonal indicators (MM) 0.97 0.72 0.97 0.99
Changes in seasonality (MM) Q I -10.6 -6.0 -32.0 -15.3
Q II 9.0 56.08 -0.30 -0.1
Q III 9.6 -14.6 24.4 1.3
Q IV -6.3 -20.2 18.5 16.6
Source: own calculations
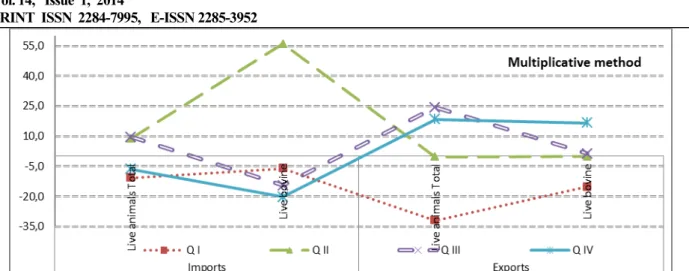
Graphical representations of the results obtained from the analysis of seasonality are
presented in the following graphs (Fig.10 and Fig.11).
PRINT ISSN 2284-7995, E-ISSN 2285-3952
Fig. 11.Index of seasonality, multiplicative method, Live animals and Live bovine
CONCLUSIONS
From the analysis results we concluded the following. Romania 's traditional partners are well consolidated in terms live animals trade. While the analysis of trade in live animals shows that imports are made mostly engaged with live swine, there is also active an imports with live cattle and poultry, ducks, geese and turkeys. These last two sectors are each one, a relatively constant volume over the 10 years analyzed. Regarding exports, the situation is different. Of the three categories analyzed, only live bovine animals is enormously important and is done mainly the basis of the positive balance of the entire trade of live animals. Over the 10 years analyzed, the volume of imports of cattle recorded an average growth rate of 3.4 % per year, and exports an average rate of increase of 6.23 % per year. Seasonality analysis pointed us for exports (live animals and live cattle) negatives seasonal adjustments in the first and second quarters. Imports of live animals have positive adjustments, by additive method, in second and third quarters, while imports of live cattle, average adjustments from the trend are negative only in the third quarter.
REFERENCES
[1]BОrnКĽ T.Ľ CТСКЭĽ G.Ľ CКnКnĽ A.Ľ BüХОnЭĽ M.Ľ 2010Ľ The competitiveness of Turkish olive oil on the world market, WFL Publisher Science and Technology , Journal of Food, Agriculture & Environment Vol.8 (2):68-73.2010.
[2]Hausmann, C., Patrick,S., 2013, Contingency
PХКnnТnР: TrКНО´s RoХО Тn SЮsЭКТnКЛХО АorХН FooН
Security, Aquatic Procedia, Volume 1, 2013, pg.20-29, Selection from the 2012 World water week in Stockholm,
http://dx.doi.org/10.1016/j.aqpro.2013.07.003
[3]Kuppusamy, J., Anantharaman, R.N., 2012, The Link between Export Performance and Export Development: Does ManagemenЭs’ MoЭТvКЭТon PХКв К Role?, IBIMA Publishing Journal of Organizational Management Studies, Vol. 2012,Article ID 645053,
DOI: 10.5171/2012.645053,
http://www.ibimapublishing.com/journals/JOMS/joms. html.
[4]Lijie, S., Chao, C., Linhai, W., 2011, Analysis of
poЭОnЭТКХ КППОМЭТnР ПКМЭors oП CСТnК’s КРrТМЮХЭЮrКХ ЭrКНОĽ
Journal of Food, Agriculture & Environment, Vol.9 (3&4):923-925.2011, WFL Publisher Science and Technology.
[5]Neculita, M., Sarpe, D.A., Cristea, V., Xiaoshuan, Z., Moga L.M., 2011, Modeling the impact of
RomКnТК’s КММОssТon Эo EЮropОКn UnТon on ЭrКНО oП
live animals, WFL Publisher Science and Technology, Journal of Food, Agriculture & Environment Vol.9 (1):428-431.
[6]Rossi, P., Kagatsume, M., 2009, Beef export restrictions in Argentina: Impact on the beef industry and national Welfare, WFL Publisher Science and Technology, Journal of Food, Agriculture & Environment Vol.7 (2):122-130.2009.
[7] VТorТМ㼠E.D.Ľ 2012Ľ EМonomОЭrТМ EsЭТmКЭТon oП К Gravity Model for the External Trade of Romania, IBIMA Publishing Journal of Eastern Europe Research in Business & Economics, Vol. 2012 (2012), Article ID 854058, DOI: 10.5171/2012.854058, http://www.ibimapublishing.com/journals/JEERBE/jeer be.html