Comparison of Genetic and Epigenetic
Alterations of Primary Tumors and Matched
Plasma Samples in Patients with Colorectal
Cancer
Elisa Danese1*, Anna Maria Minicozzi2☯, Marco Benati1☯, Martina Montagnana1, Elisa Paviati1, Gian Luca Salvagno1, Gabriel Lima-Oliveira1, Milena Gusella3, Felice Pasini4, Giuseppe Lippi5, Gian Cesare Guidi1
1Laboratory of Clinical Biochemistry, Department of Life and Reproduction Sciences, University Hospital of Verona, Verona, Italy,2National Centre for Bowel Research and Surgical Innovation (NCBRSI), Academic Surgical Unit, Barts and The London NHS Trust, Queen Mary University of London, London, United Kingdom, 3Oncology Department, Laboratory of Pharmacology and Molecular Biology, Rovigo General Hospital, Trecenta, Rovigo, Italy,4Department of Medical Oncology, Rovigo Hospital, Rovigo, Italy,5Laboratory of Clinical Chemistry and Hematology, Academic Hospital of Parma, Parma, Italy
☯These authors contributed equally to this work. *[email protected]
Abstract
Background
Although recent advances in circulating DNA analysis allow the prediction of tumor ge-nomes by noninvasive means, some challenges remain, which limit the widespread intro-duction of cfDNA in cancer diagnostics. We analyzed the status of the two best
characterized colorectal cancer (CRC) genetic and epigenetic alterations in a cohort of CRC patients, and then compared the degree to which the two patterns move from tissue to plasma in order to improve our understanding of biology modulating the concordance be-tween tissues and plasma methylation and mutation profiles.
Methods
Plasma and tumor tissues were collected from 85 patients (69±14 years, 56 males).KRAS andSEPT9status was assessed by allele refractory mutation system quantitative PCR and quantitative methylation-specific PCR, respectively. Six of the most common point muta-tions at codon 12 and 13 were investigated forKRASanalysis.
Results
KRASmutations andSEPT9promoter methylation were present in 34% (29/85) and in 82%
(70/85) of primary tumor tissue samples. Both genetic and epigenetic analyses of cfDNA re-vealed a high overall concordance and specificity compared with tumor-tissue analyses. Patients presenting with both genetic and epigenetic alterations in tissue specimens (31.8%, 27/85) were considered for further analyses. The median methylation rates in
a11111
OPEN ACCESS
Citation:Danese E, Minicozzi AM, Benati M, Montagnana M, Paviati E, Salvagno GL, et al. (2015) Comparison of Genetic and Epigenetic Alterations of Primary Tumors and Matched Plasma Samples in Patients with Colorectal Cancer. PLoS ONE 10(5): e0126417. doi:10.1371/journal.pone.0126417
Academic Editor:Anthony W.I. Lo, Queen Mary Hospital, HONG KONG
Received:February 11, 2015
Accepted:April 1, 2015
Published:May 6, 2015
Copyright:© 2015 Danese et al. This is an open access article distributed under the terms of the Creative Commons Attribution License, which permits unrestricted use, distribution, and reproduction in any medium, provided the original author and source are credited.
Data Availability Statement:All relevant data are within the paper.
Funding:The authors have no support or funding to report.
tumour tissues and plasma samples were 64.5% (12.2–99.8%) and 14.5% (0–45.5%),
re-spectively. The medianKRASmutation load (for matched mutations) was 33.6% (1.8–
86.3%) in tissues and 2.9% (0–17.3) in plasma samples. The plasma/tissue (p/t) ratio of
SEPT9methylation rate was significantly higher than the p/t ratio ofKRASmutation load,
es-pecially in early stage cancers (p=0.0108).
Conclusion
The results of this study show a discrepant rate of epigenetic vs. genetic alterations moving from tissue to plasma. Many factors could affect mutation cfDNA analysis, including both presence of tumor clonal heterogeneity and strict compartmentalization ofKRASmutation profile. The present study highlights the importance of considering the nature of the alter-ation when analyzing tumor-derived cfDNA.
Introduction
Evidence that tumor specific genetic and epigenetic alterations can be detected in circulating DNA extracted from plasma of cancer patients has shown promise for improving early diagno-sis, prognostication and disease monitoring. The overarching goal of utilizing cell free DNA as a biomarker entails medical practice optimization, personalized medicine development, and quality of life improvement due to the minimal invasiveness of blood testing. However, the au-thentication of actual clinical validity of various cell-free DNA (cfDNA) alterations as putative cancer biomarkers in clinical practice remains challenging [1]. The leading issue is currently represented by the fact that circulating DNA fragments carrying tumor specific alterations rep-resent a variable and generally small fraction of the total circulating DNA, thus generating a high variability in the concordance rate between alteration patterns detectable in tissue of pri-mary tumors and corresponding plasma.
The factors influencing the quantitative as well as the qualitative changes of cfDNA with re-spect to tissues of cancer patients are many and not yet fully explored so far. However, efforts during the last decade have led to important advances.
By evaluating the methylation pattern of thePCDH10gene in tissue and plasma of patients
with colorectal cancer (CRC) we have recently demonstrated that the methylation rate detected in plasma increased with enhanced methylation rate in tumour tissues only in early-stage can-cers, whereas this correlation was apparently lost in advanced cancers. Moreover, we showed that the degree of cfDNA methylation was associated with some characteristics of cfDNA, such as its concentration and integrity, and that these correlations varied in strength and direction in parallel with the tumour stage [2].
In the last two years two independent research groups showed that the possibility to detect tumor specific cfDNA in plasma of CRC patients largely depends on the sensitivity of the PCR-based method for short mutated sequences [3–5], thus emphasizing the importance of mini-mizing the assay length when analyzing highly fragmented cfDNA, such as in the setting of cancer patients.
According to this evidence, different technical and biological aspects should be considered when analysing the variable concordance between tissue and plasma alterations in cancer pa-tients, not least the nature of the underlying alterations.
Both epigenetic and genetic alterations are well-known aberrations involved in colorectal carcinogenesis. Given their enormous potential as biomarkers in CRC diagnosis, staging, prog-nosis and response to treatment, they have been extensively investigated in the last decade. However, a critical comparison of their status in tissue and cfDNA is lacking. Therefore, this study was aimed to analyze the status of the two best characterized genetic and epigenetic alter-ations of CRC (i.e.,KRASmutation andSEPT9promoter methylation) in a cohort of CRC
pa-tients, in order to improve our understanding of the biological aspects modulating the concordance between tissues and plasma methylation and mutation profiles. Then, we also compared the degree to which the genetic and the epigenetic patterns move from tissue to plasma.
Material and Methods
Patients and Samples
The study cohort included 85 consecutive patients undergoing surgery for CRC at the Univer-sity Hospital of Verona (Italy) between January 2010 and December 2010. Blood specimens were collected before surgical resection. Tumor samples were obtained during surgery, imme-diately frozen in liquid nitrogen and stored at -80°C. Histological diagnosis and tumor stage were assessed according to the 2000 World Health Organization (WHO) classification system for tumors of digestive system and the American Joint Committee on Cancer (AJCC) staging system, respectively [8]. Only patients with primary colorectal adenocarcinomas untreated with neoadjuvant radio-chemotherapy were included in the study. All subjects gave a written consent for being enrolled in this investigation. The study was approved by the local ethical committee (Department of Life and Reproduction Sciences, University of Verona) and per-formed in accord with the Helsinki Declaration of 1975. Clinical information was obtained from medical records.
DNA isolation from plasma and tissue samples
Blood samples were collected in 7 mL EDTA tubes and processed within 1 h after collection. After double centrifugation (800g for 10 min centrifugation, followed by separation and a sec-ond 1600g for 10 min centrifugation), plasma was separated, stored in aliquots and frozen at–
80°C until processing. DNA was extracted from plasma and fresh frozen tissue sections using the QIAamp DNA Blood midi kit and the Gentra Purgene Kit (Qiagen, Hilden,
Germany), respectively.
cfDNA concentration and Integrity index
cfDNA fragmentation was assessed by calculating the DNA integrity index as previously de-scribed [2]. In brief, it was determined by calculating the ratio of larger (247 bp) versus shorter (115 bp) targets of the consensus sequence of human ALU repeats. The ALU-qPCR result ob-tained with ALU115 primers was also used to quantify total DNA.
Methylation specific PCR (MSP)
Bisulfite-modified DNA was used as template for Real-Time PCR using a Sybr green-based quantitative MSP. Primers for MSP were designed to specifically amplify either a bisulfite-sen-sitive, unmethylated strand or a bisulfite-resistant, methylated strand on theSEPT9gene
pro-moter region. The web-based software MethPrimer (http://itsa.ucsf.edu/urolab/MethPrimer) was used to select a specific CpG island, which was recently found as the most vulnerable to methylation changes in the adenoma-carcinoma sequence [9].
The sequences of the primer sets were as follows: M-Fo:TTATTATGTCGGATTTCGCGGTTAAC
M-Rev:AAAATCCTCTCCAACACGTCCG
U- Fo:TAGTTATTATGTTGGATTTTGTGGTTAATG
U- Re:CAAAATCCTCTCCAACACATCCAC(M: methylated, U: unmethylated).
The CpGenome Universal Methylated DNA (Chemicon, Millipore Billerica, MA, USA) was used as 100% methylated (positive) control, whereas DNA extracted from peripheral blood mononuclear cells of normal individuals was used as unmethylated (negative) control.
The PCR reaction mixture was prepared in a final volume of 20μl, consisting of the follow-ing concentrations: 0.375μM of forward and reverse primers, 250μM of each dNTP (GE Healthcare, Little Chalfont, UK), 1× HotStart Buffer (Qiagen), 2.5 mM MgCl2, 1.5 units Hot-Start polymerase (Qiagen), 2μM SYTO 9 (Invitrogen, Life Technologies, Carlsbad, CA), and 1×ROX reference dye (Invitrogen), 3μl of bisulfite-modified DNA.
The PCR amplification was performed with precycling heat activation of DNA polymerase at 95°C for 10 min, followed by 40 cycles of denaturation at 95°C for 30 sec, annealing at 64°C for 30 sec and extension at 72°C for 30 sec. An ABI Prism 7500 Sequence Detection System (Applied Biosystems—Foster City, CA, USA) was used.
The PCR product was run on 2% agarose gel to confirm product size and specificity of PCR, and then visualized under UV light. A band of 110 bp was considered as diagnostic of methyla-tion status, whereas a band of 114 bp was considered as diagnostic of unmethylamethyla-tion status.
KRAS mutation analysis
DNA extracted from tissue and plasma samples was subjected to an allele refractory mutation system qPCR (ARMS-qPCR) for detection of six of the most common mutations in codons 12 and 13 of theKRASgene (G12A, G12D, G12V, G12S, G12C, and G13A). DNA was
ampli-fied in a 25μl reaction mixture containing 0.25μM of each amplification primer, 200μM of each dNTP (GE Healthcare, Little Chalfont, UK), 1× HotStart Buffer (Qiagen, Hilden, Ger-many), 2 mM MgCl2, 2 units HotStart polymerase (Qiagen, Hilden, Germany), 2μM SYTO 9
(Invitrogen, Life Technologies, Carlsbad, CA), 1×ROX reference dye (Invitrogen) and 25 ng DNA. The primer sequences have been previously described elsewhere [10], with the exception of the common reverse primer which has been re-designed in order to shorten the amplicons of both codon 12 (90 bp) and codon 13 (85 bp) (originally of 149 and 144 bp in length). The re-sulting sequence was as follows:TGTTGGATCATATTCGTCCACA.
The PCR amplification was performed with precycling heat activation of DNA polymerase at 95°C for 10 min, followed by 40 cycles of denaturation at 95°C for 30 sec, annealing at 64°C for 30 sec and extension at 72°C for 30 sec, in a ABI Prism 7500 Sequence Detection System (Applied Biosystems—Foster City, CA, USA). The PCR product of mutated samples was run on 2% agarose gel to confirm the presence of the specific bands.
Quantitative analysis and analytical performance
and Ctunmet denote threshold cycles specific for the methylated and unmethylated states, whereas Mut and WT refer to mutated and wild-type alleles, respectively. The proportions (%) of methylation rate or mutation load detected in plasma compared to those detected in tissues were expressed as plasma/tissue ratio (p/t ratio).
The median of at least two replicate measurements was calculated for each sample, and then used for statistical analysis. Predefined quality criteria were set, such that measurements with Ct values greater than 38 cycles were excluded.
Since it has been observed that the sensitivity of cfDNA assays can be increased by shorten-ing the size of amplicons [5,6], primers for both analyses were designed to allow the amplifica-tion of products smaller than 120 bp. The intra-assay imprecision for the methylaamplifica-tion test was 9%. The lower limit of detection of methylated DNA for the MSP assays (assessed using serial dilutions of the Universal Methylated DNA) was 1.5%.
The intra-assay imprecision for theKRASanalyses ranged between 2% and 8%, depending
on the type of mutation. Cell line DNA admixtures containing the mutation of interest in a normal DNA background were used to evaluate the limit of detection and amplified in the same instrument runs to act as positive controls. The analytical sensitivity of ARMS-qPCR was below 2%, as previously reported [12].
Statistical analysis
Normality distribution was checked with the Shapiro-Wilk test and continuous variables were reported as median (range) or mean±SD, when appropriate. Statistical analyses and plotting of data were performed using GraphPad Prism (GraphPad Software Inc., San Diego, CA). The di-agnostic performance of cfDNA analysis was compared with tumor-tissue analysis (the current gold standard) for its sensitivity and specificity in distinguishing between mutated/hyper-methylated and nonmutated/non mutated/hyper-methylated individuals. The predictive positive and negative predictive values were also calculated with Fisher’s exact test. The rate of concordance between tissue and plasma profiles was determined with agreement test (and values presented as weighted kappa (k) ± standard error). Differences between continuous variables were analyzed by using the Mann-Whitney U test. Correlations were tested with the Spearman correlation. Values of p<0.05 were considered statistically significant.
Results
Fifty six of 85 patients initially evaluated for their potential inclusion in the study were men, the remaining women (mean age 69±14 years). The tumor stage distribution was as follows: 15 patients were at stage I (17.6%), 35 at stage II (41%), 24 at stage III (28.2%) and the remaining 11 at stage IV (12.9%). Twenty nine out of 85 tumor tissue samples (34%) were positive for one of the sixKRASmutations that we have tested. Of these, 22 tumor tissues showed matched
mu-tations in plasma samples. Overall, cfDNA analysis showed 89.4% (76/85) concordance for
KRASdetection with tumor-tissue analysis (k = 0.753±0.077, p<0.0001). There were nine
dis-cordant results among the 85 samples examined. Five results showed a WT genotype for
KRAS-tested mutations by cfDNA analysis, whereas tumor-tissue analysis showed aKRAS
G13D mutation (n = 2), aKRASG12D mutation (n = 2) or aKRASG12V mutation (n = 1).
Two patients (both at stage II) displayed aKRASG12S and a G12A mutation by plasma
analy-sis, but were determined as WT by tumor-tissue testing. Finally, two patients (both with ad-vanced metastatic CRC) exhibited unmatched mutations between tissue and plasma.
TheSEPT9promoter methylation was present in 82.3% (70/85) of primary tumor tissue
±0.092, p<0.0001). Discordant results only concerned patients with aberrant methylation of
SEPT9in tissue samples and unmethylated plasma samples (n = 12).
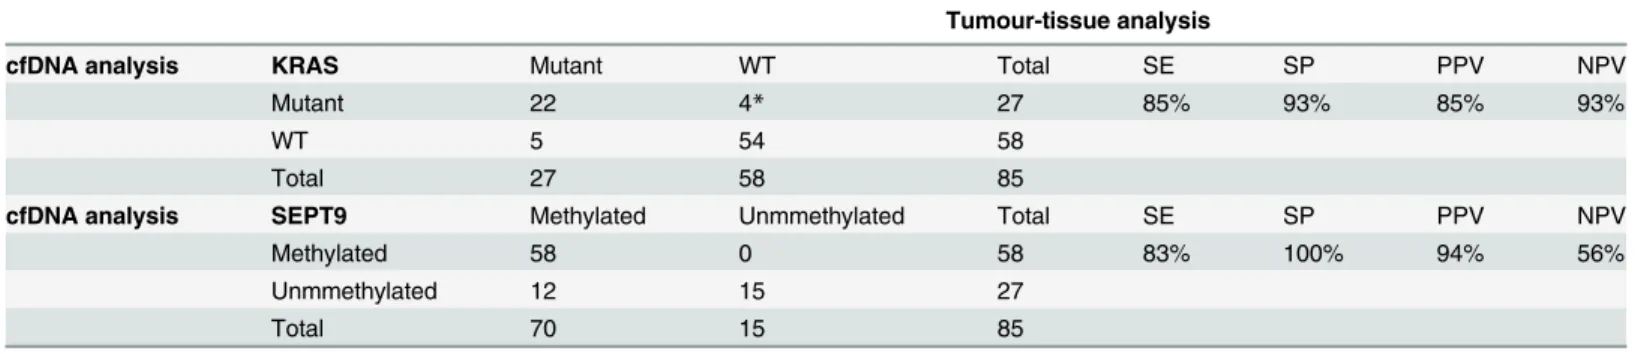
The distribution of positive and negative samples in tissue and plasma is shown inTable 1, along with the analytical performance of cfDNA analyses.
After exclusion of two patients with differentKRASgenotype in tissue and plasma, the 27
patients (81.5% male) displaying both genetic and epigenetic alterations in tissue specimens (31.8%, 27/85) were considered for further quantitative analyses. In these patients the rate of concordance between tissue and plasma was 93% (25/27) for the epigenetic alteration and 81% (22/27) for theKRASmutation analysis (i.e., two cfDNA samples were negative for the
methyl-ation ofSEPT9and five were negative for the presence ofKRASmutations). Among the
differ-ent KRAS mutations that we have tested, the G12V substitution was the most represdiffer-ented (n = 11), followed by G12D (n = 7) and G13D (n = 7). Finally, one sample exhibited the G12A mutation, whereas the G12S was found in another. Overall, 74% and 26% of mutation sites were located in codons 12 and 13, respectively.
The medianSEPT9methylation rates in tumour tissues and plasma samples were 64.5%
(12.2–99.9%) and 14.5% (0–45.5%), respectively. The medianKRASmutation load was 33.6%
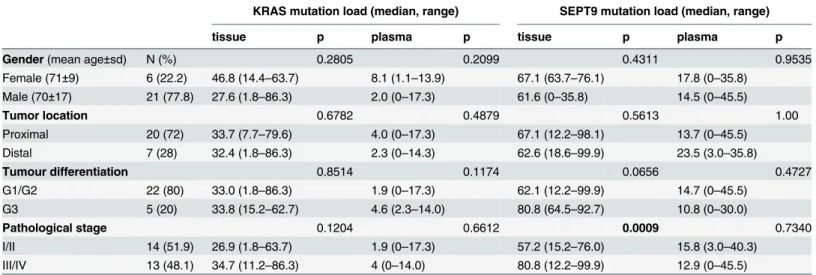
(1.8–86.3%) in tissues and 2.9% (0–17.3%) in plasma samples. Quantitative data for both ge-netic and epigege-netic alterations according to different clinical pathological characteristics is summarized inTable 2. No significant associations were found with gender, primary tumor site and differentiation status in both tumour tissues and plasma samples. In terms of patholog-ical stage classification, the median methylation rate ofSEPT9was significantly higher in
ad-vanced-stage cancer tissues than in the early stage tissues. A statistically significant correlation was found in between tissue and plasmaSEPT9methylation rate (r = 0.407, p = 0.035), whereas
no association was found between tissue and plasmaKRASmutation load (r = 0.092,
p = 0.651).
Additional analyses were performed on p/t ratio ofKRASmutation load andSEPT9
methyl-ation rate, to identify potential differences between genetic and epigenetic degree of transition from tissue to plasma. The p/t ratio ofSEPT9methylation rate was significantly higher than
the p/t ratio ofKRASmutation load (24.2% vs 7.9%, p = 0.0228), both parameters showing a
wide spectrum of values (range 0–72.9% forSEPT9p/t ratio and 0–62.6% forKRASp/t ratio).
This finding was almost entirely attributable to the large discrepancy between genetic and epi-genetic p/t ratios detectable in early stage cancers (p = 0.0108), since the difference in advanced stage cancers was no longer significant (p = 0.6806) (Fig 1). The concentration of cfDNA in
Table 1. Concordance between tumor-tissue analysis and cfDNA analysis (n = 85).
Tumour-tissue analysis
cfDNA analysis KRAS Mutant WT Total SE SP PPV NPV
Mutant 22 4* 27 85% 93% 85% 93%
WT 5 54 58
Total 27 58 85
cfDNA analysis SEPT9 Methylated Unmmethylated Total SE SP PPV NPV
Methylated 58 0 58 83% 100% 94% 56%
Unmmethylated 12 15 27
Total 70 15 85
*: two out of these four patients presented unmatched mutations in tissue and plasma: they showed KRAS G12V mutations by plasma analysis and were determined either G12D or G13D by tumor tissue analysis.
cfDNA: cell-free DNA; WT: wild type; SE: sensitivity; SP: specificity; PPV: positive predictive value; NPV: negative predictive value.
early stages CRC patients (median 30.6 ng/mL, 4.6–66.8) was lower than that in advanced stage patients (80.2 ng/mL, 31.0–195.0; p = 0.0001). The cfDNA was also found to be more fragmented (integrity index: 0.36, 0.0.7–0.85 vs 0.63, 0.33–0.95; p = 0.0163). No significant as-sociations were found between cfDNA parameters and genetic or epigenetic alterations, except for a weak correlation between cfDNA integrity index andKRASmutation load in advanced
cancers (r = 0.572, p = 0.040).
Discussion
Although the use of cfDNA as potential surrogate of cancer genome has been originally sug-gested more than 30 years ago [13], and the role of liquid biopsy has been evaluated for its pre-dictive and prognostic value in a number of settings with promising results, cfDNA-based cancer tests have not been developed for clinical use so far.
Table 2. Associations between SEPT9 methylation rate and KRAS mutation load in tissue and plasma samples according to clinicopathological parameters of CRC patients (n = 27).
KRAS mutation load (median, range) SEPT9 mutation load (median, range)
tissue p plasma p tissue p plasma p
Gender(mean age±sd) N (%) 0.2805 0.2099 0.4311 0.9535
Female (71±9) 6 (22.2) 46.8 (14.4–63.7) 8.1 (1.1–13.9) 67.1 (63.7–76.1) 17.8 (0–35.8)
Male (70±17) 21 (77.8) 27.6 (1.8–86.3) 2.0 (0–17.3) 61.6 (0–35.8) 14.5 (0–45.5)
Tumor location 0.6782 0.4879 0.5613 1.00
Proximal 20 (72) 33.7 (7.7–79.6) 4.0 (0–17.3) 67.1 (12.2–98.1) 13.7 (0–45.5)
Distal 7 (28) 32.4 (1.8–86.3) 2.3 (0–14.3) 62.6 (18.6–99.9) 23.5 (3.0–35.8)
Tumour differentiation 0.8514 0.1174 0.0656 0.4727
G1/G2 22 (80) 33.0 (1.8–86.3) 1.9 (0–17.3) 62.1 (12.2–99.9) 14.7 (0–45.5)
G3 5 (20) 33.8 (15.2–62.7) 4.6 (2.3–14.0) 80.8 (64.5–92.7) 10.8 (0–30.0)
Pathological stage 0.1204 0.6612 0.0009 0.7340
I/II 14 (51.9) 26.9 (1.8–63.7) 1.9 (0–17.3) 57.2 (15.2–76.0) 15.8 (3.0–40.3)
III/IV 13 (48.1) 34.7 (11.2–86.3) 4 (0–14.0) 80.8 (12.2–99.9) 12.9 (0–45.5)
doi:10.1371/journal.pone.0126417.t002
Fig 1. Differences between plasma/tissue methylation rate and mutation load in early and advanced cancer stages.
The high degree of fragmentation coupled with the low blood concentration make cfDNA a challenging analyte under a technical perspective. Moreover, the still uncertain kinetics of tumor-related cfDNA release into the bloodstream and the genetic composition changes dur-ing progression both contribute to make cfDNA a”hard to read”analyte, even under a biologi-cal perspective.
The results of our study, other than confirming that liquid biopsy predicts alterations of tumor tissues, are consistent with the hypothesis that some differences may exist among the rate at which genetic and epigenetic alterations move from tissue to plasma.
In order to make results less vulnerable to technical interference and make genetic and epi-genetic data reliable and directly comparable, we adopted a number of methodological expedi-ents adapted from recent publications. First, the analysis was performed in plasma since this biological matrix represents a better source of cfDNA than serum [1,6]. Then, we used relative short amplicons for both determinations, and this was due to the fact that the length of the fragment may influence the sensitivity of detecting mutation and methylation[5,14,15]. We have also assured a high level of sensitivity of the epigenetic assay by targeting a specific CpG island, which has been recently found to display the highest susceptibility to methylation changes in the adenoma-carcinoma sequence [9]. Finally, according to the American Society for Clinical Oncology and National Comprehensive Cancer Network (NCCN), a high level of detection rate has been obtained forKRASmutation analysis by targeting hotspots in codon 12
and 13, which are known to account for approximately 95% of all mutations [16].
In the present study, a methylation specific qPCR and an ARMS-qPCR based methods were used forSEPT9methylation andKRASmutation analyses, respectively. Due to important
tech-nological advances, new methods such as digital PCR [17], Inteplex qPCR [14] BEAMing tech-nology [18], MethyLight quantitative or MethyLight digital PCR [19] and new deep sequences approaches [20] are now available, thus allowing absolute quantification of mutant or methyl-ated alleles at very low frequencies and with lower imprecision than those reported here. How-ever, the assays that we used in this study are more widely available in clinical laboratories, and are also characterized by optimal sensitivity, being able to detect at least 2% alteration in a nor-mal background [21]. Even more importantly, the analytical performance of genetic and epige-netic assays were very similar in terms of sensitivity and precision, thus allowing direct comparison of data from different alterations.
The first part of the study, performed on the entire cohort of 85 CRC patients, substantially confirmed previous evidence that analysis ofKRASandSEPT9in plasma may be seen as a
reli-able alternative to the tissue. The status ofKRASis generally used as predictive marker of
re-sponse to established epidermal growth factor receptor (EGFR) inhibitors due to the fact that mutantKRASis associated with resistance to anti-EGFR monoclonal antibody immunotherapy
with agents such as centuximab or panitumumab [22,23]. Conversely, aberrant methylation in the promoter region of theSEPT9gene has been convincingly proposed as sensitive and
specif-ic biomarker for early non-invasive diagnosis of CRC [24].
By following the suggestions recently proposed by Wasserkort and coauthors [9], and thus targeting a specific CpG island on the promoter of theSEPT9gene, we found a very high
num-ber of hypermetylated tissues samples (82%), to a higher extent than previously reported in the literature (usually ranging between 78 and 81%) [25]. The results obtained in matched plasma samples revealed high global concordance (86%) and specificity (100%) compared with tu-mour-tissue analysis. In the same sample, aKRASmutation was detected in 34% of patients, in
specificity constantly lower than 80% [27–29]. As an exception, only two recent studies re-ported values of specificity comprised between 95.3% [30] and 98% [14].
In the second part of the study, we analysed the rate of concordance between tissue and plasma mutation load and methylation rate, and results obtained with the two assays were then compared. In the subgroup of 27 patients harbouring tissue genetic and epigenetic alterations, theKRASmutation load varied from 1.8% to 86.3% (almost 48-fold), thus showing a higher
interindividual heterogeneity than theSEPT9methylation rate, which varied from 12.2% to
99.9% (i.e., approximately 8-fold). In the transition from tissue to plasma, five samples became WT for the mutation status and two were no longer hypermethylated. The degree of methyla-tion moving from tissue to plasma was almost 3 times higher than the rate of mutamethyla-tion load as resulting from the comparison of the two p/t ratios (24.2% vs 7.9% for p/t ratio ofSEPT9
meth-ylation rate andKRASmutation load, respectively). In agreement with recent reports, this
find-ing might be explained by the intratumoral heterogeneity of the primary tumour, which preferentially impairs genetic rather than epigenetic analysis [7,31]. Nevertheless, since the discrepancy found between the two p/t ratios is exclusively attributable to data obtained in early stage cancers whereas clonal evolution usually occurs when metastasis is developing, the tumour clonality would only partially explain our findings [32].
For theKRASanalysis, comparable values of mutation load were obtained between early
and advanced cancers in both tissue (26.9% vs 34.7%) and plasma samples (1.9% vs 4%), so that the p/t analysis did not reveal significant difference according to tumour stages (8.6% vs 7.3%). Conversely, a statistical significant difference was found for theSEPT9methylation
analysis between p/t ratio in early and advanced cancers (33.8% vs 19.0%, p = 0.0108). This var-iance was entirely attributable to a discrepancy in the methylation rate detected in tissues (57.2% vs 80.8%, p = 0.0009), since no differences were found in plasma samples (15.8% vs 12.9% for early vs advanced stages). Thus, the transition of DNA harbouring the epigenetic al-teration into the circulation in early stage cancers is seemingly more consistent than the transi-tion of DNA harbouring aKRASmutation. According with the most recent literature data, this
evidence could be interpreted as resulting from differences in tissue types involvement previ-ously observed for CRC genetic and epigenetic signatures [33]. In particular, while theSEPT9
aberrant methylation originates in epithelial cells and is then rapidly transferred to stromal cells [9], theKRASmutations harboured by epithelial compartment are not shared by stromal
cells [34]. Accordingly, the molecular cross-talk between tumour epithelium and stroma occur-ring for theSEPT9epigenetic alteration might facilitate the transition of aberrant DNA from
primary tumour to the circulation.
In addition, the overall lower degree of mutation load with respect to the methylation rate detected in CRC tissues (26.9% vs 57,2% in early stage cancers) might have contributed to en-hance the dilution effect of wild type-KRASDNA in the circulation.
In conclusion, the results of the present study confirm that cfDNA analysis represents a suit-able strategy for comprehensive analysis of tumor genetic and epigenetic profiles, even using routine methods. Most importantly, we provided first evidence that the rate to which tumour derived cfDNA can be detected into the circulation not only depends on the sensitivity of methods used and complexity of release kinetics, but also on the nature of the single alteration. In an era characterized by increasing use of comprehensive gene expression studies of solid tu-mours to elucidate the complexity of tumour tissues and heterogeneity of cell phenotypes, our study emphasizes the need to better characterize cancer-specific genetic and epigenetic signa-tures according to different tumour compartments, so that the significance and clinical value of cfDNA assessment can be ultimately improved.
but may also become the first choice for both genetic and epigenetic tumour characterization by providing a better overall portrait of malignant diseases [5,14,29,30].
Author Contributions
Conceived and designed the experiments: ED AMM GL GCG. Performed the experiments: ED MB EP. Analyzed the data: ED GL MM. Contributed reagents/materials/analysis tools: AMM MG FP GLS GLO. Wrote the paper: ED MB GL.
References
1. Jung K, Fleischhacker M, Rabien A. Cell-free DNA in the blood as a solid tumor biomarker—a critical
appraisal of the literature. Clin Chim Acta. 2010; 411: 1611–1624 doi:10.1016/j.cca.2010.07.032
PMID:20688053
2. Danese E, Minicozzi AM, Benati M, Montagnana M, Paviati E, Salvagno GL, et al. Epigenetic alteration: new insights moving from tissue to plasma—the example of PCDH10 promoter methylation in
colorec-tal cancer. Br J Cancer. 2013; 109: 807–813 doi:10.1038/bjc.2013.351PMID:23839493
3. Mouliere F, El Messaoudi S, Gongora C, Guedj AS, Robert B, Del Rio M, et al. Circulating Cell-Free DNA from Colorectal Cancer Patients May Reveal High KRAS or BRAF Mutation Load. Transl Oncol. 2013; 6: 319–328. PMID:23730412
4. Mouliere F, Messaoudi SE, Pang D, Dritschilo A, Thierrya AR. Multi-marker analysis of circulating cell-free DNA toward personalized medicine for colorectal cancer. Molecular Oncology 2014, in press 5. Andersen RF, Spindler KL, Brandslund I, Jakobsen A, Pallisgaard N. Improved sensitivity of circulating
tumor DNA measurement using short PCR amplicons. Clin Chim Acta. 2015; 439: 97–101 doi:10.
1016/j.cca.2014.10.011PMID:25446878
6. Heitzer E, Ulz P, Geigl JB. Circulating Tumor DNA as a Liquid Biopsy for Cancer. Clin Chem. 2015; 61: 112–123. doi:10.1373/clinchem.2014.222679PMID:25388429
7. Ignatiadis M, Dawson SJ. Circulating tumor cells and circulating tumor DNA for precision medicine: dream or reality? Ann Oncol. 2014; 25: 2304–2313 doi:10.1093/annonc/mdu480PMID:25336116
8. Edge SB, Compton CC. The American Joint Committee on Cancer: the 7th edition of the AJCC cancer staging manual and the future of TNM. Ann Surg Oncol 2010; 17: 1471–1474 doi:
10.1245/s10434-010-0985-4PMID:20180029
9. Wasserkort R, Kalmar A, Valcz G, Spisak S, Krispin M, Toth K, et al. Aberrant septin 9 DNA methylation in colorectal cancer is restricted to a single CpG island. BMC Cancer. 2013; 13:398 doi: 10.1186/1471-2407-13-398PMID:23988185
10. Yanus GA, Belyaeva AV, Ivantsov AO, Kuligina ESh, Suspitsin EN, Mitiushkina NV, et al. Pattern of clinically relevant mutations in consecutive series of Russian colorectal cancer patients. Med Oncol. 2013; 30: 686 doi:10.1007/s12032-013-0686-5PMID:23943423
11. Visani M, de Biase D, Baccarini P, Fabbri C, Polifemo AM, Zanini N, et al. Multiple KRAS mutations in pancreatic adenocarcinoma: molecular features of neoplastic clones indicate the selection of divergent populations of tumor cells. Int J Surg Pathol. 2013; 21: 546–552. doi:10.1177/1066896912475073
PMID:23426962
12. Ellison G, Donald E, McWalter G, Knight L, Fletcher L, Sherwood J, et al. A comparison of ARMS and DNA sequencing for mutation analysis in clinical biopsy samples. J Exp Clin Cancer Res. 2010; 29: 132. doi:10.1186/1756-9966-29-132PMID:20925915
13. Leon SA, Shapiro B, Sklaroff DM, Yaros MJ. Free DNA in the serum of cancer patients and the effect of therapy. Cancer Res 1977; 37: 646–650 PMID:837366
14. Thierry AR, Mouliere F, El Messaoudi S, Mollevi C, Lopez-Crapez E, Rolet F, et al. Clinical validation of the detection of KRAS and BRAF mutations from circulating tumor DNA. Nat Med. 2014; 20: 430–435.
doi:10.1038/nm.3511PMID:24658074
15. Mouliere F, Robert B, Arnau Peyrotte E, Del Rio M, Ychou M, Molina F, et al. High fragmentation char-acterizes tumourderived circulating DNA. PLoS One. 2011; 6: e23418. doi:10.1371/journal.pone. 0023418PMID:21909401
16. Gonzalez de Castro D, Angulo B, Gomez B, Mair D, Martinez R, Suarez-Gauthier A, et al. A comparison of three methods for detecting KRAS mutations in formalin-fixed colorectal cancer specimens. Br J Cancer. 2012; 107: 345–351. doi:10.1038/bjc.2012.259PMID:22713664
18. Diehl F, Schmidt K, Choti MA, Romans K, Goodman S, Li M, et al. Circulating mutant DNA to assess tumor dynamics. Nat Med. 2008; 14: 985–990. doi:10.1038/nm.1789PMID:18670422
19. Redshaw N, Huggett JF, Taylor MS, Foy CA, Devonshire AS. Quantification of epigenetic biomarkers: an evaluation of established and emerging methods for DNA methylation analysis. BMC Genomics. 2014; 15: 1174. PMID:25539843
20. Newman AM, Bratman SV, To J, Wynne JF, Eclov NC, Modlin LA, et al. An ultrasensitive method for quantitating circulating tumor DNA with broad patient coverage. Nat Med. 2014; 20: 548–554. doi:10.
1038/nm.3519PMID:24705333
21. Ellison G, Donald E, McWalter G, Knight L, Fletcher L, Sherwood J, et al. A comparison of ARMS and DNA sequencing for mutation analysis in clinical biopsy samples. J Exp Clin Cancer Res. 2010; 29: 132. doi:10.1186/1756-9966-29-132PMID:20925915
22. Lièvre A, Bachet JB, Le Corre D, Boige V, Landi B, Emile JF, et al. KRAS mutation status is predictive of response to cetuximab therapy in colorectal cancer. Cancer Res. 2006; 66: 3992–3995. PMID:
16618717
23. Amado RG, Wolf M, Peeters M, Van Cutsem E, Siena S, Freeman DJ, et al. Wild-type KRAS is required for panitumumab efficacy in patients with metastatic colorectal cancer. J Clin Oncol. 2008; 26: 1626–1634
doi:10.1200/JCO.2007.14.7116PMID:18316791
24. Grützmann R, Molnar B, Pilarsky C, Habermann JK, Schlag PM, Saeger HD, et al. Sensitive detection of colorectal cancer in peripheral blood by septin 9 DNA methylation assay. PLoS One. 2008; 3: e3759 doi:10.1371/journal.pone.0003759PMID:19018278
25. He Q, Chen HY, Bai EQ, Luo YX, Fu RJ, He YS, Jiang J, Wang HQ. Development of a multiplex Methy-Light assay for the detection of multigene methylation in human colorectal cancer. Cancer Genet Cyto-genet. 2010; 202: 1–10. doi:10.1016/j.cancergencyto.2010.05.018PMID:20804913
26. Deschoolmeester V, Boeckx C, Baay M, Weyler J, Wuyts W, Van Marck E, et al. KRAS mutation detec-tion and prognostic potential in sporadic colorectal cancer using high-resoludetec-tion melting analysis. Br J Cancer. 2010; 103: 1627–1636. doi:10.1038/sj.bjc.6605959PMID:20959826
27. Trevisiol C, Di Fabio F, Nascimbeni R, Peloso L, Salbe C, Ferruzzi E, et al. Prognostic value of circulat-ing KRAS2 gene mutations in colorectal cancer with distant metastases. Int J Biol Markers. 2006; 21: 223–228. PMID:17177160
28. Ryan BM, Lefort F, McManus R, Daly J, Keeling PW, Weir DG, Kelleher D. A prospective study of circu-lating mutant KRAS2 in the serum of patients with colorectal neoplasia: strong prognostic indicator in postoperative follow up. Gut. 2003; 52: 101–108. PMID:12477769
29. Spindler KL, Pallisgaard N, Vogelius I, Jakobsen A. Quantitative cell-free DNA, KRAS, and BRAF muta-tions in plasma from patients with metastatic colorectal cancer during treatment with cetuximab and iri-notecan. Clin Cancer Res. 2012; 18: 1177–1185. doi:10.1158/1078-0432.CCR-11-0564PMID:
22228631
30. Yen LC, Yeh YS, Chen CW, Wang HM, Tsai HL, Lu CY, et al. Detection of KRAS oncogene in peripher-al blood as a predictor of the response to cetuximab plus chemotherapy in patients with metastatic colo-rectal cancer. Clin Cancer Res. 2009; 15: 4508–4513. doi:10.1158/1078-0432.CCR-08-3179PMID:
19549774
31. Gerlinger M, Rowan AJ, Horswell S, Larkin J, Endesfelder D, Gronroos E, et al. Intratumor heterogene-ity and branched evolution revealed by multiregion sequencing. N Engl J Med. 2012; 366: 883–892.
doi:10.1056/NEJMoa1113205PMID:22397650
32. Yates LR, Campbell PJ. Evolution of the cancer genome. Nat Rev Genet. 2012; 13: 795–806. doi:10.
1038/nrg3317PMID:23044827
33. Abba M, Laufs S, Aghajany M, Korn B, Benner A, Allgayer H. Look who's talking: deregulated signaling in colorectal cancer. Cancer Genomics Proteomics. 2012; 9: 15–25. PMID:22210045
34. Baloglu H, Yigit N. Stromal cells do not share KRAS mutations that the epithelial component harbors in colorectal carcinomas. Cancer Lett. 2011; 308: 118–121. doi:10.1016/j.canlet.2011.04.021PMID: