Validation of a regionalized
optometric scale for preschool
children: nursing contribution
VALIDAÇÃO DE ESCALA OPTOMÉTRICA REGIONALIZADA PARA PRÉ-ESCOLARES: CONTRIBUIÇÃO DA ENFERMAGEM
VALIDACIÓN DE UNA ESCALA OPTOMÉTRICA REGIONALIZADA PARA PREESCOLARES: CONTRIBUCIÓN DE LA ENFERMERÍA
1 Nurse. PhD. Adjunct Professor at The Federal University of Acre. Rio Branco, AC, Brazil. [email protected] 2 Nurse. PhD. Full Professor at The Federal University of Ceará. Coordinator of the Eye Health Project /CNPq. Fortaleza, CE, Brazil. [email protected] 3 Statistician. PhD. Adjunct Professor at State
O
RIGINAL
A
R
TICLE
RESUMO
Desenvolveu-se escala de figuras regiona-lizadas (RAD). Objetivou-se validar a esca-la, avaliar a correlação entre os coeficien-tes da acuidade visual, verificar a associa-ção entre os testes e verificar a concordân-cia das medidas. Este é um estudo de vali-dação de tecnologia, experimental, aleató-rio, triplo-cego, com 246 escolares. Enquan-to a sensibilidade foi 88,6 RAD1 e 85,7 RAD2 para o olho direito (OD) e 78,6 e 92,9 para o esquerdo (OE), a especificidade do OD foi 95,3 RAD 1 e 98,1 RAD2 e do OE 97,7 e 98,6, respectivamente. Quanto ao valor preditivo positivo, RAD1 foi 75,6 OD e 81,5 OE e RAD2 88,2 OD e 89,7 OE. Já o valor preditivo negativo em RAD1 foi de 98,0 OD e 97,3 OE e em RAD2 97,6 OD e 99,1 OE. Para correlação e associação no OD e OE, o valor considerado de p = 0,0001. O Alfa de Crombachfoi 0,929. Houve significância entre o critério padrão e a escala.
DESCRITORES: Criança.
Acuidade visual. Estudos de validação. Enfermagem. Oftalmologia.
Rosane Arruda Dantas1, Lorita Marlena Freitag Pagliuca2,Paulo César de Almeida3
ABSTRACT
A regionalized figure scale (RAD) was de-veloped. The objective was to validate the scale, evaluate the correlation between the visual acuity coefficients, verify the associa-tion between the tests, and verify the agree-ment between the measures. This is a triple-blind, experimental, random technology validation study performed on 246 stu-dents. Sensitivity was 88.6 RAD1 and 85.7 RAD2 for the right eye (RE), and 78.6 and 92.9 for the left eye (LE), whereas RE speci-ficity was 95.3 RAD1 and 98.1 RAD2, and, 97.7 and 98.6 for the LE, respectively. As for the positive predictive value, RAD1 was 75.6 RE and 81.5 LE, and RAD2 88.2 RE and 89.7 LE. The negative predictive value in RAD1 was 98.0 RE and 97.3 LE, and in RAD2 97.6 RE and 99.1 LE. For the correlation and as-sociation in the RE and LE, p=0.0001. Cronbach’s Alpha was 0.929. A statistically significant relation was found between the standard criterion and the scale.
KEY WORDS: Child.
Visual acuity. Validation studies. Nursing.
Ophthalmology.
RESUMEN
Se desarrolló una escala de figuras regionalizadas (RAD). Los objetivos fueron: validar la escala; evaluar la correlación en-tre los coeficientes de la acuidad visual; verificar la asociación entre las pruebas; y, verificar la concordancia de las medidas. Se trata de un estudio de validación de tecno-logía, experimental, aleatorio, triple ciego, con 246 escolares. En lo que se refiere a la sensibilidad fue 88,6 RAD1 y 85,7 RAD2 para el ojo derecho (OD), 78,6 y 92,9 para el izquierdo (OE), la especificidad del OD fue 95,3 RAD 1 y 98,1 RAD2 y del OE 97,7 y 98,6. En lo que se refiere al valor predictivo posi-tivo, RAD1 fue 75,6 OD y 81,5 OE y RAD2 88,2 OD y 89,7 OE. Ya el valor predictivo negativo en RAD1 fue de 98,0 OD y 97,3 OE y en RAD 2 97,6 OD y 99,1 OE. Para correla-ción y asociacorrela-ción en el OD y OE, p = 0,0001. El Alfa de Cronbachfue de 0,929. Hubo significancia entre el criterio estándar y la escala.
DESCRIPTORES: Niño.
Agudeza visual. Studios de validación. Enfermería.
INTRODUCTION
The optometric scale is a measure used in clinical oph-thalmologic exams and in screenings to determine visual acuity. Acuity is identified through the recognition of sym-bols, referred to as optotypes, which can be letters, num-bers, or pictures submitted to optical adaptations to per-form this role. Optotypes are organized in decreasing or-der. In this way, those of equal size are presented on the same horizontal line, and correspond to one vision coeffi-cient, expressed in the form of a fraction. Acuity is deter-mined by the fraction of the last line on which the indi-vidual identified all the optotypes.
It is clear that each optotype is important to achieve a trustworthy exam result. For this reason, it is established that, to identify the optotype, individuals should know the object that they see. In the case of illiterate adults and chil-dren, it is common to use a picture scale, since symbolic learning takes place before literacy. To obtain exam effi-ciency, the pictures should be regionalized and a good test result will depend on, among other conditions, the selec-tion of adequate pictures, since one is only able to assign meaning to what is read when one knows the object or has the underlying information that would contribute to an as-sociation with memory data.
This is a relevant issue and this aspect has been ad-dressed in current studies, which is the case of a study per-formed to associate the performance of the Sonksen Pic-ture Guide to Visual Function (SPGVF) with visual acuity and sensitive contrast. According to the results, acuity was more important for recognition of pictures than for the sensitive contrast(1). Furthermore, as observed, visual acu-ity does not depend on the optic resolution by the optical system only. It goes beyond and requires the capacity to understand what is seen and, subsequently, to inform(2).
Some studies evidence the difficulties faced when per-forming the test with an image scale, like the one adapted for the Cabury-Amazonas region, because many mistake the moon for a canoe and others did not know the Brazil-ian flag(3).
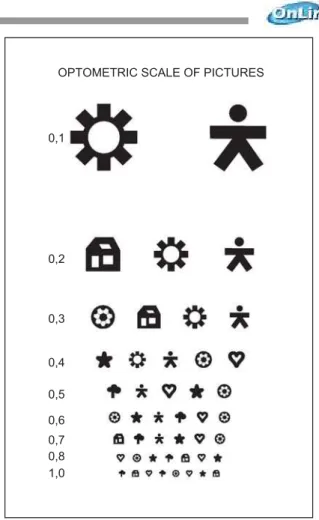
Hence, in the case of Fortaleza, studies have been per-formed based on the perceived need to elaborate an im-age scale according to the aspect of that city. Therefore, a method is developed to select the optotypes for that city (RAD scale). Images of the everyday life of children aged 4 to 6 years were identified and validated. Those figures, af-ter adjustments to the optical principle to transform im-ages, became optotypes, based on the following principles: angular progression, angular relation expressed in a linear form, visual acuity resolution range, contrast, interval and number of optotypes in the same line and between lines, and the capacity to detect differential visual acuity(4).
Below is the scale in its validated form. It should be noted that it is reduced in size, but the images are perfectly clear.
0,1
0,2
0,3
0,4
0,5
0,6
0,7 0,8 1,0
OPTOMETRIC SCALE OF PICTURES
Figure 1 – Final proposal of the RAD scale after the changes to the optotypes
We defend the hypothesis that the regionalized opto-metric scale for Fortaleza is valid is reliable to detect opti-cal changes in preschoolers. One of its important factors is that it considers that optical changes, when not detected, usually cause serious consequences to society because, in addition to elevating the costs of rehabilitation programs for the visually impaired, they also reduce the productivity of the work force, with a consequent limitation to the individual’s independence and capacity(5).
As shown in the literature, about 7.5 million preschool aged children present some kind of visual impairment. In Brazil, this level is close to 20% of children in school. These figures, however, can be reduced by half with technology and methods for prevention and early diagnosis of ophthal-mologic disorders(6).
evaluation using the Snellen scale or images and the exam of external ophthalmic structures, and to show parents the importance of referring their children to a specialist, when he or she presents any sign of optical change and, still, to teach teachers how the test will be performed with the Snellen scale.
This study aims to validate the RAD scale regarding its capacity to identify children with optical changes, evaluate the correlation between the coefficients of visual acuity; verify the association about the tests; verify the agreement of the measurements obtained by the three rates for the right and left eyes, separately.
METHOD
This technology validation study, which is experimen-tal, random, triple-blind and quantitative, was performed during the first semester of 2006. As to the population, there are 1,129,168 students enrolled in the public school network in Fortaleza – CE, in the 1st – 8th grades, according to the data from the State Education Secretariat.
Considering that the population size N of school chil-dren was considered infinite because, after employing the following formula, n<0.05N was found, the sample calcula-tion was performed using Student’s t test.
n = (t2
5% x P x Q)/ e 2
The elected variable to calculate the size of the sample was optical change, since approximately 20% of the school children present some kind of optical change, such as re-fraction errors, conjunctivitis, strabismus, optical accident sequelae, and congenital malformation. As observed, the causes range from ecological to social factors(7).
Sample size resulted in 246 students. The inclusion cri-teria were: the school belonging to the state education network, the children attending the first cycle of funda-mental education, and their parents providing previous consent to their participation in the study. Students were excluded if they used any correction.
The students were chosen in the following stages: in-tentional selection of the schools and determining the groups according to the grade they were in. In view of the students’ and their parents’ or responsible adult’s right to decline their participation in the study, in addition to the predictable number of blank answers, every child from the class period chosen for data collection received the con-sent term. In those schools where the number of students in the selected classes was close to the quantitative value of the sample, students from another class period were added. When the number of answered consent terms was superior to the study needs, classes and students were ran-domly excluded, through a raffle.
It should be noted that the image scale is indicated for pre-school children, since it contains images pertinent to
the children’s growth and development in this stage. How-ever, to validate the new scale, it should be compared to the one that represented the base for its existence; in this case, the Snellen scale, recommended for individuals ca-pable of recognizing directions, with at least seven years of age, according to the cognitive aspect.
Moreover, the new scale images are known to the pre-school children of Fortaleza(4). Now, the intention is to check if the parameters defined in the RAD are capable of cor-rectly determining visual acuity. For this reason, there is no impediment as to the scale being tested with a more ad-vanced clientele in terms of growth and development.
As required, the study was approved by the Ethics Com-mittee for Studies involving Human Beings at the Federal University of Ceará Hospital Complex according to the re-quirements of National Health Council Resolution 196/96 (Protocol # 218/05). Permission was asked to the Ceará State Education Secretary, as well as to the school director and the students’ parents. In addition, the students’ right not to participate in any stage was respected, despite their par-ents’ consent.
With a view to performing the evaluation, the RAD im-age scale construction method and its prototype were sent for analysis by an ophthalmologist, with solid education and experienced in optometric scales. The points analyzed by the specialist included the adequacy of the angular pro-gression per age, visual acuity resolution range, contrast, interval and number of optotypes on the same line and between lines, and the scale’s capacity to detect amblyo-pia, its overall presentation and the optotype presentation. As expected, the specialist took one month to perform the analysis, which was delivered to the researcher in writing and containing the relevant points and the justification for each question. After this stage, the points highlighted by the expert were grouped and discussed per topic. The ques-tions suggested by the expert were confronted with the literature, and the researcher had the liberty to determine the need for adjustments in the scale.
To be part of the data collection group, nursing under-graduates were selected, who were attending the subject Nursing in the Care Process I at the Federal University of Ceará. In this class, students learn about the visual system, its pathologies, and the use of optometric scales. The ex-aminers were instructed about optical physiology, prepar-ing the environment, examiner-examinee relationship, evaluating visual acuity, scale use order, filling out the data collection tool, and the need to be blind to the results of the other tests. The necessary care was taken to refer the children with a result below 0.8 to the ophthalmologist by informing the family.
were solved, and the data collection standard was estab-lished. Despite this care taken, the researcher followed the data collection on a daily basis, supervising the work.
The tests took place in an illuminated room, with the light focused from the back or at the side of the child being examined, the scale was placed on the wall at a distance of 5 m from the child, the optotype lines correspondent to 0.8 (20/25) were placed at the height of the child’s eyes. Each student was examined individually, one eye at a time, first the right with the left closed, and then the opposite(7). For occlusion of the contralateral eye, an occlusor was used, shaped like glasses, made from cardboard and adjusted to the child’s face, similar to conventional glasses. The square-shaped occlusor with rounded corners permits a coverage to occlude the area corresponding to a lens, which acceler-ates the exam. The fact that it is disposable and available in several sizes provides more comfort to the examinees, since they do not need to hold it(8).
Method to evaluate visual acuity using an image scale
Visual acuity measurement was performed on a daily basis for three weeks. It took place always in the same pe-riod of the day and was performed by three examiner teams, one for each school. Every day, the tests with the RAD and Snellen image scales were used. The RAD scale received the numerical differentiation RAD 1 and RAD 2; the child was examined in the sequence RAD1, Snellen, and RAD 2. The RAD 1 and RAD 2 scales were used by two examiners, and the Snellen by only one. There were three results per eye to be analyzed, two from the analyzed scale and one from the standard, i.e. the Snellen scale. At first, returning to an image that the child did not recognize was permitted, as long as the exam was in the optotype line stage, consider-ing it valid if the child answered correctly.
In this way, the RAD 1 test occurred without a previous contact with the optotype formats, whereas RAD 2 occurred after the Snellen test and having an initial contact with the studied image scale. The time between the first and sec-ond moment was about one hour.
The results from these exams were registered in forms, according to the Eye Health Project model, consisting of the child’s name, age, gender, and school grade, and a space for registering right and left eye acuity. The examiner also registered a description of the environment where the evaluation had taken place and signed the registration tool. A resolution indication was adopted, which determined five correct answers out of ten, or 50% correct answers for each visual coefficient line(9).
The validation of the scale was initiated with the find-ings regarding the coefficients of sensitivity, specificity, posi-tive predicposi-tive value and negaposi-tive predicposi-tive value. For these coefficients, the Snellen scale was established as the
stan-dard test. For precision, correlation tests between visual acuity coefficients were performed, as well as the associa-tion between the tests and concordance analysis. With a view to verifying a correlation between the visual coeffi-cients of the acuities found, Spearman’s rs correlation coef-ficient was calculated, which indicated the magnitude of the relation between the measured variables, in this case, the Snellen and RAD scales, at both moments(10).
An association was found between the tests by means of the chi-square. The basic principle of this non-paramet-ric method is to compare the divergences between the observed and expected frequencies(11). The Snellen scale was used as a standard criterion. Cronbach’s Alpha was used for concordance analysis and, to determine scale reliabil-ity, a 95% confidence interval was constructed for the num-ber of correlations between the two tests(12). The correla-tions are defined by the visual acuity values measured on both scales, for each eye.
The nominal variables were categorized according to the coefficient analysis. In this case, it was considered that stu-dents had an alteration when they presented a coefficient inferior to 0.8, and without alteration for results between 0.8 and 1.0. The data were processed using Soft Statistics Direct, and then analyzed and presented in the form of tables and charts.
After confronting these data, the possibility of using the scale and the need for new adjustments were verified based on previously published scientific data. It should be noted that many of these publications are over 15 years old, since this subject was studied intensively years ago, but is little addressed nowadays due to the apparent reliability of the optometric scales used at school-age, which is the focus clientele of public health programs.
RESULTS
According to the above, the sample consisted of 246 (100%) students divided in three schools of the Fortaleza State Education Network. Of the 135 (55%) female students, 27 (11%) presented visual acuity alterations in the screen-ing test with the Snellen scale. For boys, on the other hand, of the total 111 (45%) only 13 (5%) presented diminished visual acuity. The students’ age ranged between 8 and 16 years. As for school grades, 36 (14.6%) were in the 2nd or 3rd grades, with acuity alteration occurring in 3 (1.2%) students; among the 91 (36.9%) enrolled in the 4th or 5th grade, there were 19 (7.7%) with alteration, and, of the 119 (48.5%) stu-dents in the 6th to 8th grade, 18 (7.3%) presented reduced acuity.
Table 1 - RAD scale validation coefficients for eyes without correction, in fundamental education students, based on the standard criterion of the Snellen scale - Fortaleza - 2006
Sensitivity
[CI95%]
Specificity
[CI95%]
VP+(1)
[CI95%]
VP-(2)
[CI95%]
Right eye
RAD 1 88.6 [78.1; 99.1] 95.3 [92.4; 98.2] 75.6 [62.5; 88.7] 98.0 [96.1; 99.9]
RAD 2 74.6 [74.1; 97.3] 98.1 [96.3; 99.9] 88.2 [77.4; 99.0] 9.6 [95.5; 97.7]
Left eye
RAD 1 78.6 [63.4; 93.8] 97.7 [95.7; 99.7] 81.5 [66.9; 96.1] 97.3 [95.2; 99.4]
RAD 2 92.9 [83.4; 100.0] 98.6 [97.0; 100.0] 89.7 [78.6; 100.0] 99.1 [97.8; 100.0]
(1) Positive predictive value; (2) Negative predictive value.
Table 2 - Spearman correlation matrix according to the eye and scale used in the test of fundamental education students - Fortaleza - 2006
Right eye Snellen x RAD1 Snellen x RAD2 Left eye Snellen x RAD1 Snellen x RAD2
r
0.769 0.894
0.769 0.890
p
0.0001 0.0001
0.0001 0.0001
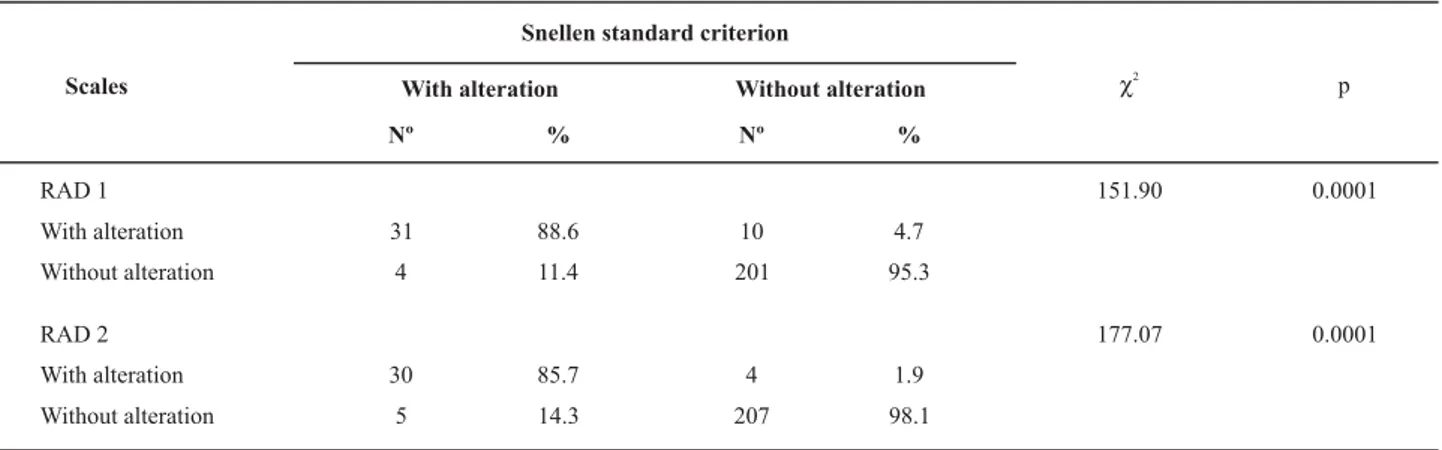
Table 3 - Association between the RAD scale and Snellen tests for the right eye, in fundamental education students - Fortaleza - 2006
Snellen standard criterion
With alteration Without alteration
Scales
Nº % Nº %
c2 p
RAD 1 151.90 0.0001
With alteration 31 88.6 10 4.7
Without alteration 4 11.4 201 95.3
RAD 2 177.07 0.0001
With alteration 30 85.7 4 1.9
Without alteration 5 14.3 207 98.1
(%) The percentage shown refers to the standard criterion of the Snellen scale.
Table 4 - Association between the RAD scale and Snellen tests for the left eye, in fundamental education students - Fortaleza - 2006
Snellen standard criterion
With alteration Without alteration
Scales
Nº % Nº %
c2 p
RAD 1 147.75 0.0001
With alteration 22 78.6 5 2.3
Without alteration 6 21.4 213 97.7
RAD 2 199.69 0.0001
With alteration 26 92.9 3 1.4
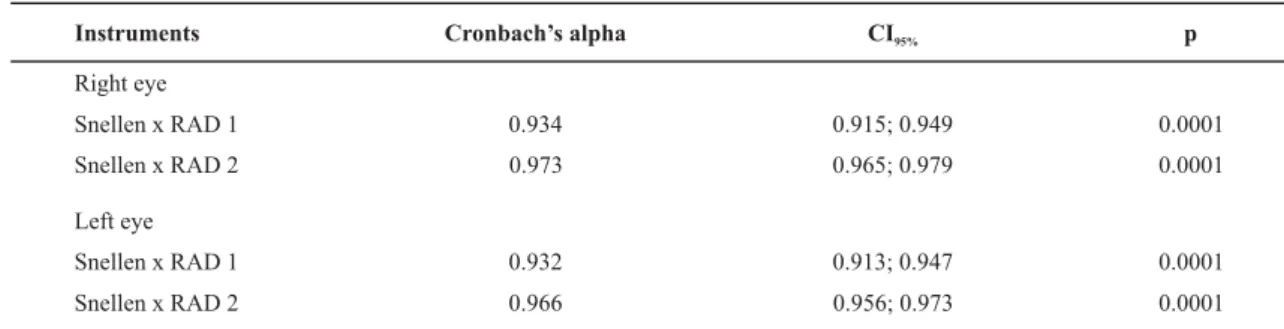
Table 5 - Analysis of the concordance analysis per eye and scale used in fundamental education students - Fortaleza - 2006
Instruments
Right eye
Snellen x RAD 1
Snellen x RAD 2
Left eye
Snellen x RAD 1
Snellen x RAD 2
Cronbach’s alpha
0.934
0.973
0.932
0.966
CI95%
0.915; 0.949
0.965; 0.979
0.913; 0.947
0.956; 0.973
p
0.0001
0.0001
0.0001
0.0001
As shown in this table, a 95% confidence interval was considered for the number of correlations between the two tests and, for every case, there was a CronbachAlpha greater than 0.929.
DATA ANALYSIS
In the present study, the main age range was 12 to 13 years. Visual acuity usually develops starting at birth and vision should improve until around the age of 7 years, a time when visual development is completed in most chil-dren(13). Considering that the vision development process is stabilized, age is disregarded as an important indicator for false results.
As observed, most examinees (55%) were girls, who also showed the highest number of optical alterations (11.0 %). These data are confirmed by several studies. One study, for instance, found a significant difference in the prevalence of poor visual acuity between genders, which was higher among females (14.9%) compared to males (11.5%). It was observed that the highest visual acuity alterations ratios occurred in higher school grades, especially 4th and 5th grades (7.7%). This data differs from those found in a study with students from the city of Sorocaba, in which the high-est prevalence of poor visual acuity occurred in 1st grade students compared to 4th graders(14).
Caution should be taken with the fact that the sensitiv-ity of the RAD scale referred to the probabilsensitiv-ity of finding visual acuity changes and whether the student actually had any alteration; in other words, the proportion of correctly-identified positive cases. Specificity, on the other hand, cor-responds to the probability of correctly-identified negative cases(12).
As detected, sensitivity was better for the right eye in RAD 1 (88.6) and for the left eye in RAD 2 (92.9). Specificity achieved high values in every crossing, which suggests a better capacity of detecting individuals without optical al-terations due to their knowledge of and familiarity with the RAD scale optotypes. Proportionally speaking, the data referring to sensitivity was more significant.
In screening tests for optical alterations, good results are demanded for every coefficient, which were
statisti-cally validated and accepted as adequate for the detection of optical changes. However, it is common to prefer high negative predictive values because, in this case, the item under discussion confirms that students without alterations actually have good vision. In general, this tranquilizes par-ents and teachers about optical alterations. Cases in which the opposite occurs are referred to ophthalmologic exams to confirm the finding.
As observed, inadequate referral is costly and demands time and money that could be used in the search for solu-tions to the referred alterasolu-tions. Therefore, high values should be expected for each of these coefficients. A study on the screening performed by teachers of a certain school found a considerable correct answer percentage (87.10%) using the Snellen scale. However, the 12.90% result for in-correct screenings, considering the referred limitation of ophthalmologic care resources, caused some anxiety. Since 90.57% of the incorrect screening referred to false-positive cases, the program could become costly in terms of public health though, from the clinical point of view, emphasis should be given to the importance of avoiding false-nega-tive cases(15).
For screenings, it is common to observe some failures in the method used. Hence, false-positive and false-nega-tive cases occur, but these numbers should be minimal. Due to issues beyond the fact of using the scales, the number of false-cases is high, like in the case of the referred study, in which secondary-level education teachers consider coeffi-cients below 1.0 as optical alterations. However, as known, alterations are seen below 0.7. Once again, this shows there is a need for qualified personnel to work in screening cases(15).
and collective events, causing methodological changes in the course, relating quantity and quality, as well as theory and practice to interpret reality objectively, unveiling the ideo-logical nature of practices and policies(11).
There is consensus in literature that the validity of a mea-sure is limited by its precision. If the meamea-sure has low reli-ability, its precision will suffer to some extent. Thus, high precision does not guarantee validity but, paradoxically, low precision might not imply low validity(16). In the previous tests, good validity was observed and, later, precision had to be observed in order to confirm the efficacy of the RAD scale.
The statistical precision of a punctual estimate was ex-pressed by the confidence interval, usually considered to be 95% of an estimate. Its interpretation considers that, in a bias-free study, there is a 95% probability that the inter-val includes the real clinical effect of the studied interven-tion. The narrower the interval, the higher the probability of that being the real magnitude of the effect(12).
For this study, the RAD 1 result was considered more reliable, because there were no possibilities of memoriz-ing the images. However, in practice, it is evidenced that it is important to continue making a previous sensitization in the children, so as to demonstrate the images that will be visualized, without showing their order in the table.
In a study performed to associate the performance of the Sonksen Picture Guide to Visual Function test with visual acuity and the sensitive contrast of visually impaired chil-dren, the results showed that acuity was more important for the recognition of images than for the sensitive contrast(16).
According to observations in the Sonksen Picture Guide to Visual Function test, visually simpler images tend to be recognized from long distances, different from more com-plex images or images with multiple objects. In addition, there was an interaction between visual acuity and image complexity, i.e. the intermediary vision of the groups satu-rated rapidly in the identification of complex figures com-pared to the identification of simple figures(17). When this test, which is indicated to measure visual acuity in pre-school children across the world, was used in adult sub-jects, the reliability was defined as 0.94. Therefore, it met the statistical criterion of a good visual acuity test(17). In this study, Cronbach’s Alpha was above 0.929, therefore close to the value defined in the previous study.
CONCLUSION
As observed,the findings demonstrate the reproduc-ibility and reliability of the RAD scale. The evaluation of reproducibility would be the most used measurement in epidemiological surveys concerning optical alterations, since they refer to the capacity of concordance of acuities when the optometric scale is applied uniformly and repeat-edly. A scale with these characteristics avoids not only the appearance of inexistent alterations, but also the children’s constraint when trying to guess an image that is strange to their everyday life. Therefore, the results confirm the vali-dation of the regionalized optometric scale for pre-school children. Hence, the professionals involved will benefit from the reduction in the risk for false results.
REFERENCES
1. Vervloed MPJ, Ormel EA, Schiphorst SAM. Measuring everyday visual discrimination in visually impaired children with the Sonksen Picture Guide to visual function. Child Care Health Dev. 2001;27(4):365-76.
2. Bicas HEA. Sistemas e funções In: Bicas HEA. Oftalmologia: fun-damentos. São Paulo: Contexto; 1991. p. 50-153.
3. Carvalho R, Garrido C. Avaliação oftalmológica primária em es-colares no Estado do Amazonas. Rev Bras Oftalmol. 1993;52 (5):41-3.
4. Dantas RA. Validação de figuras e seleção de optótipos para uma escala optométrica [dissertação]. Fortaleza: Faculdade de Farmá-cia, Odontologia e Enfermagem, Universidade Federal do Ceará; 2003.
5. Organização Mundial de Saúde (OMS). Programa para Preven-ção da Cegueira: o atendimento de crianças com baixa visão. Relatório. Bangkok; 2002.
6. Temporini ER. Programas de prevenção da cegueira: participa-ção da escola. Rev Bras Saúde Esc. 1992;2(1):41-3.
7. Kara-José N, Alves MR. Manual de orientação da Campanha
Nacional “Visão para Crianças” do Conselho Brasileiro de Of-talmologia. São Paulo: Imprensa; 2007.
8. Coelho ADA, Dantas RA, Pagliuca LMF, Almeida PC. Óculos Oclusor: teste de um modelo para uso com crianças. Rev Enferm UERJ. 2006;14(4):538-44.
9. Cruz AAV, Bicas HEA. Acuidade visual diferencial e o conceito de ambliopia. Arq Bras Oftalmol. 1988;51(4):172-7.
10. Polit DF, Beck CT, Hungler BP. Fundamentos de pesquisa em enfermagem: métodos, avaliação e utilização. 5ª ed. Porto Alegre: Artes Médicas; 2004.
12. Scheaffer RL, Mendenhall W, Lymanott R. Elementos de muestreo. 6ª ed. Madri: Thomson; 2007.
13. Arakaki MR, Schellini SA, Heimbeck FJ, Furuya MT, Padovani CR. Adesão ao tratamento da ambliopia. Arq Bras Oftalmol. 2004;67(2):201-5
14. Gianini RJ, Masi E, Coelho EC, Oréfice FR, Moraes RA. Preva-lência de baixa acuidade visual em escolares da rede pública, Sorocaba. Rev Saúde Pública. 2004;38(2):201-8.
15. José NK, Temporini ER. Avaliação dos critérios de triagem vi-sual de escolares de primeira série do primeiro grau. Rev Saú-de Pública 1980;14(2):205-14.
16. Menezes PR, Nascimento AF. Validade e confiabilidade das escalas de avaliação em psiquiatria. In: Gorenstein C, Andrade LHSG, Zuardi AW. Escalas de avaliação clínica em psiquiatria e psicofarmacologia. São Paulo: Lemos; 2000. p. 23-8.