http://dx.doi.org/10.1590/0037-8682-0133-2014
Major Article
INTRODUCTION
Address to: Dr. Emil Kupek. Depto Saúde Pública/UFSC. Campus Universitário Trindade, 88040-900 Florianópolis, SC, Brasil.
Phone: 55 48 3721-9388 e-mail: [email protected] Received 6 June 2014 Accepted 11 August 2014
Changes in the prevalence, incidence and residual
risk for HIV and hepatitis C virus in Southern
Brazilian blood donors since the implementation
of NAT screening
Emil Kupek
[1]and Andrea Petry
[2][1]. Departamento de Saúde Pública, Universidade Federal de Santa Catarina, Florianópolis, SC. [2]. Centro de Hematologia e Hemoterapia do Estado de Santa Catarina, Florianópolis, SC.
ABSTRACT
Introduction: Previous studies have shown high residual risk of transfusing a blood donation contaminated by human
immunodefi ciency virus (HIV) or hepatitis C virus (HCV) in Brazil and motivated the development of a Brazilian platform
for simultaneous detection of both viruses by nucleic acid amplifi cation test (NAT) denominated HIV/HCV Bio-Manguinhos/
Fundação Oswaldo Cruz (FIOCRUZ). The objective of this study was to verify seroprevalence, incidence and residual risk
for both viruses before and after the implementation of NAT. Methods: Over 700,000 blood samples from all blood banks in
the southern Brazilian State of Santa Catarina were analyzed during the period between January 2007 and July 2013. Results:
Compared with the period preceding the NAT screening, HIV prevalence increased from 1.38 to 1.58 per 1,000 donors, HIV incidence rate increased from 1.22 to 1.35 per 1,000 donor-years, and HIV residual risk dropped almost 2.5 times during the NAT period. For HCV, seroprevalence increased from 1.22 to 1.35 per 1,000 donors, incidence dropped from 0.12 to 0.06 per
1,000 donor-years, and residual risk decreased more than 3 times after the NAT implementation. Conclusions: NAT reduced the
duration of the immunologic window for HIV and HCV, thus corresponding to approximately 2.5- and 3-fold respective residual
risk reductions.
Keywords: HIV. HCV. Blood donors. Prevalence. Incidence. Residual risk.
Blood safety in transfusion medicine critically depends on
donor recruitment, clinical examination for signs and symptoms of past or present infections and exclusion of those who represent
a risk of transmitting these infections to the blood recipients; this screening relies either on pre-donation interviews or laboratory
screening via serological or nucleic acid amplifi cation test (NAT) analyses1. However, despite an increase in sensitivity with this screening, there is still some residual risk that the donated blood may be contaminated by an infectious agent. The
quantifi cation of residual risk is an important part of blood safety
policies worldwide2. In Brazil, the methodology of residual risk estimation had been disseminated in the Portuguese language by the end of the 1990s3,4 and has been sporadically applied in the country since then1,5-10. The results of these studies showed
high prevalence, incidence and residual risk in Brazil compared
with the United States of America (USA), Europe, Japan and Australia, thus reinforcing the need to monitor these parameters in a systematic way and to use them to evaluate the effectiveness of transfusion safety measures.
By the end of 2010, the Brazilian Ministry of Health had started the development of a NAT platform for the simultaneous detection of human immunodefi ciency virus (HIV) and hepatitis C virus (HCV). After piloting the platform in three blood banks in 2010, the Brazilian NAT kit was licensed for routine blood
bank screening in 2011 and has since been gradually implemented
throughout the country. Two window-period transmissions of HIV
were reported during the piloting phase, both of them in 200911.
The objective of this paper is to compare the prevalence, incidence and residual risk for HIV and HCV before and after the implementation of the Brazilian NAT platform by the Centre
for Hematology and Hemotherapy of the Santa Catarina State
(HEMOSC - Centro de Hematologia e Hemoterapia do Estado
de Santa Catarina) in July 2010.
METHODS
The study population included all HEMOSC blood donors eligible for blood screening after clinical examinations and
RESULTS
HEMOSC is a network of six blood banks from the Cities of
Blumenau, Chapecó, Criciúma, Joaçaba, Joinville and Lages that provides 99.5% of the blood and hemocomponents transfused
in the State of Santa Catarina of approximately six million inhabitants. It was certifi ed with the ISO9001: 2010 quality
control stamp. Since 2007, all blood screening has been performed in the central laboratory in the state capital of Florianópolis.
Data were extracted from the HEMOSC computerized
donor records and included demographic information
(age, sex, location of residence); laboratory test results for HIV,
HCV, human T lymphotropic virus (HTLV), hepatitis B virus
(HBV), T. cruzi and T. pallidum; and details regarding previous
donations (dates, test results, impediments). The anti-HIV-1,2 O Prism and anti-HCV Prism tests, both manufactured by Abbott Laboratories (Wiesbaden, Germany), were used for HIV and HCV serological screening. In addition, a fourth-generation antigen/antibody kit, the Enzygnost Integral II (Siemens, Marburg, Germany), was used between January 2007 and July 2010 before NAT screening for HIV and HCV was introduced. Along with the NAT implementation, the combined antigen/antibody kit for HIV was substituted with the anti-HIV Combo test (Architect Laboratories, Wiesbaden, Germany). The Brazilian duplex HIV/HCV NAT platform was developed and supplied by Bio-Manguinhos/Fundação Oswaldo Cruz (FIOCRUZ, Rio de Janeiro, Brazil) as a six-sample mini-pool. All NAT-screen-positive samples were also tested by INNO-LIA immunoblot (Innogenetics, Gent, Belgium).
An exact Poisson distribution was used to determine the 95% confi dence interval (CI) for the number of HIV- and HCV-positive samples. For repeat donors, the HIV and HCV
seroconversion date was estimated as a mid-point between the
last negative donation and the fi rst positive test result12. Residual risk was calculated by the incidence/window method, which multiplies the probability of viral conversion during the inter-donation interval by the immunologic window duration12. The probability was calculated as the conversion incidence rate, which divides the number of converting repeat donors by their time at risk. The latter was estimated by summing the inter-donation intervals between the last two inter-donations for the screen-negative donors and half the intervals for the screen-positive donors. This calculation assumes that the risk of conversion is equally spread over the intervals, so that their mid-point is the best unbiased estimate on the group level.
Based on the kit manuals provided by their manufacturers, the window durations were as follows: 22 days for the Prism
anti-HIV test, 32.8 days for the Prism anti-HCV test, 17 days for the Enzygnost Integral II test, 14 days for the HIV Combo Architect test and 9 days for both HIV and HCV NAT screening. Stata software, version 11.0 (StataCorp, College Station, TX, USA), was used for all statistical calculations.
During the period analyzed, 293,725 blood donors
provided 719,223 blood samples that were screened for the
aforementioned infectious agents. Before and after the NAT was
implemented in HEMOSC, there were 168,318 and 125,378
blood donors, respectively, whose blood samples were screened. The number of samples includes repeated tests for screen-positive test results.
The blood donor profi le was somewhat altered after the NAT implementation. The participation of fi rst-time donors increased from 69.7% to 91.6%, as did that of women (from 38.1% to 44.6%) and of donors from Blumenau, where blood bank expansion took place after the NAT screening was introduced. The blood
donors whose previous donations occurred within 12 months of their last donation decreased from 10.1% to 0.6%, whereas those with longer inter-donation intervals decreased from
20.2% to 7.8% of all donors. In contrast, there was an increase in the recruitment of blood donors from the youngest (16-24 years)
age group. Donor race, educational level and prevalence of
co-infections (i.e., infections other than HIV or HCV) remained roughly the same before and after the NAT was introduced.
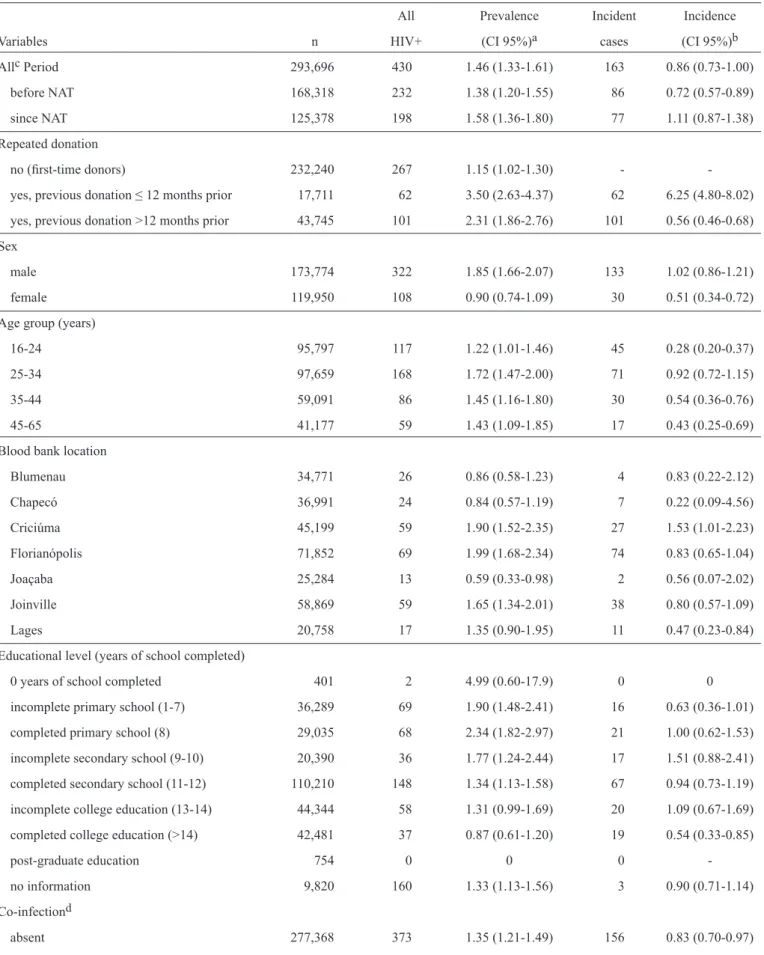
HIV prevalence rates per thousand donors were 1.38 and 1.58 before and after NAT implementation, respectively
(Table 1). The repeat donors had a significantly higher
prevalence than the fi rst-time donors, particularly those with shorter inter-donation intervals. The HIV prevalence was twice that in male donors compared with female donors. Older age, lower educational level and co-infection (mainly with HBV) all increased the likelihood of an HIV-positive test result. Signifi cantly higher HIV prevalence rates were observed for the
donors from Florianópolis, Criciúma and Joinville compared with those from Blumenau, Chapecó and Joaçaba, with the City of Lages holding an intermediary position.
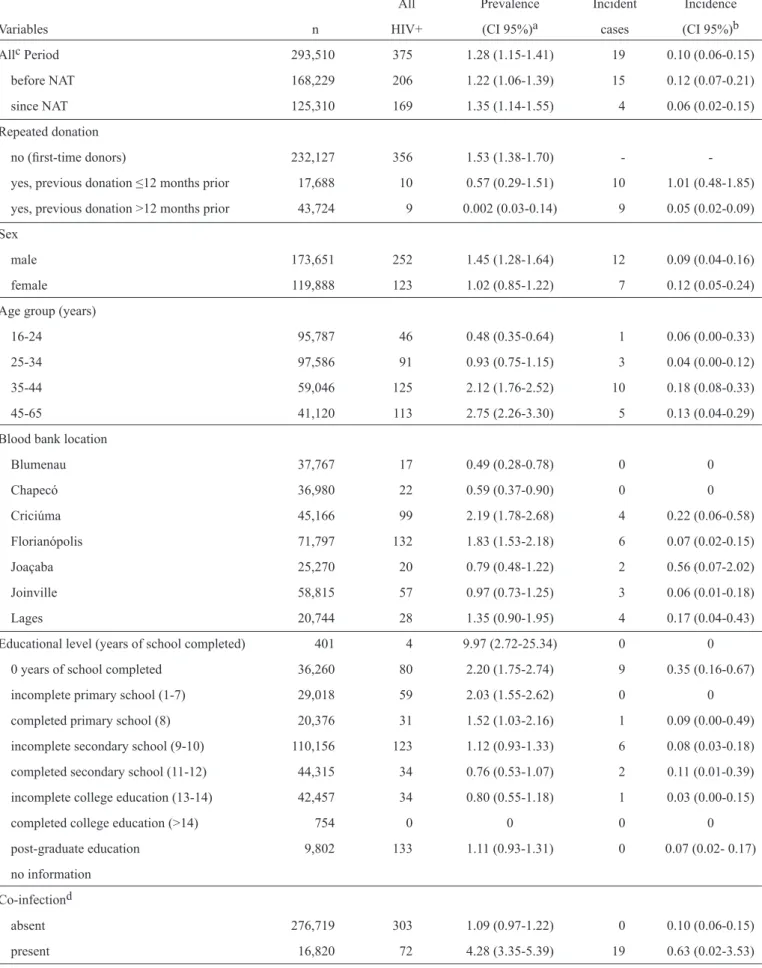
HCV prevalence rates per thousand donors were 1.22 and 1.35 before and after NAT implementation, respectively
(Table 2). The fi rst-time donors had a signifi cantly higher
prevalence than the repeat donors, as did men compared with women. The donors from Florianópolis and Criciúma showed
signifi cantly elevated HCV prevalence rates compared with
those from Blumenau, Joaçaba and Joinville. There were clear increases in prevalence in older donors, those with lower educational levels and those with co-infections.
The risk factors associated with incidence showed
similar magnitudes and directions for both HIV and HCV. HIV incidence was more than ten times higher in the repeat donors with shorter (<12 months) inter-donation intervals compared to those with longer intervals. Male donors had twice
the incidence of female donors. The donors between 25 and 34 years of age showed the highest incidence, as did those residing in Criciúma and those with co-infections.
A sharp increase in HIV prevalence among male donors aged
16-24 years was noted (Figure 1). A similar trend was observed for young women until 2012, after which a sharp decline in prevalence was observed (Figure 2).
Residual risk was calculated as the product of the incidence
of viral conversion and the duration of the immunological window period (Table 3). For example, the 17-day window for
TABLE 1 - HIV prevalence and incidence by risk factors.
All Prevalence Incident Incidence
Variables n HIV+ (CI 95%)a cases (CI 95%)b
Allc Period 293,696 430 1.46 (1.33-1.61) 163 0.86 (0.73-1.00)
before NAT 168,318 232 1.38 (1.20-1.55) 86 0.72 (0.57-0.89) since NAT 125,378 198 1.58 (1.36-1.80) 77 1.11 (0.87-1.38) Repeated donation
no (fi rst-time donors) 232,240 267 1.15 (1.02-1.30) - -yes, previous donation ≤ 12 months prior 17,711 62 3.50 (2.63-4.37) 62 6.25 (4.80-8.02) yes, previous donation >12 months prior 43,745 101 2.31 (1.86-2.76) 101 0.56 (0.46-0.68) Sex
male 173,774 322 1.85 (1.66-2.07) 133 1.02 (0.86-1.21) female 119,950 108 0.90 (0.74-1.09) 30 0.51 (0.34-0.72) Age group (years)
16-24 95,797 117 1.22 (1.01-1.46) 45 0.28 (0.20-0.37) 25-34 97,659 168 1.72 (1.47-2.00) 71 0.92 (0.72-1.15) 35-44 59,091 86 1.45 (1.16-1.80) 30 0.54 (0.36-0.76) 45-65 41,177 59 1.43 (1.09-1.85) 17 0.43 (0.25-0.69)
Blood bank location
Blumenau 34,771 26 0.86 (0.58-1.23) 4 0.83 (0.22-2.12) Chapecó 36,991 24 0.84 (0.57-1.19) 7 0.22 (0.09-4.56) Criciúma 45,199 59 1.90 (1.52-2.35) 27 1.53 (1.01-2.23) Florianópolis 71,852 69 1.99 (1.68-2.34) 74 0.83 (0.65-1.04) Joaçaba 25,284 13 0.59 (0.33-0.98) 2 0.56 (0.07-2.02) Joinville 58,869 59 1.65 (1.34-2.01) 38 0.80 (0.57-1.09) Lages 20,758 17 1.35 (0.90-1.95) 11 0.47 (0.23-0.84) Educational level (years of school completed)
0 years of school completed 401 2 4.99 (0.60-17.9) 0 0 incomplete primary school (1-7) 36,289 69 1.90 (1.48-2.41) 16 0.63 (0.36-1.01) completed primary school (8) 29,035 68 2.34 (1.82-2.97) 21 1.00 (0.62-1.53) incomplete secondary school (9-10) 20,390 36 1.77 (1.24-2.44) 17 1.51 (0.88-2.41) completed secondary school (11-12) 110,210 148 1.34 (1.13-1.58) 67 0.94 (0.73-1.19) incomplete college education (13-14) 44,344 58 1.31 (0.99-1.69) 20 1.09 (0.67-1.69) completed college education (>14) 42,481 37 0.87 (0.61-1.20) 19 0.54 (0.33-0.85)
post-graduate education 754 0 0 0
-no information 9,820 160 1.33 (1.13-1.56) 3 0.90 (0.71-1.14)
Co-infectiond
absent 277,368 373 1.35 (1.21-1.49) 156 0.83 (0.70-0.97) present 16,356 57 3.40 (2.58-4.40) 7 5.57 (2.24-11.47)
aper 1,000 donors; bper 1,000 repeat donor-years; cexcluding inconclusive test results; dwith hepatitis B virus, hepatitis C virus, human T-cell
TABLE 2 - HCV prevalence and incidence by risk factors.
All Prevalence Incident Incidence
Variables n HIV+ (CI 95%)a cases (CI 95%)b
Allc Period 293,510 375 1.28 (1.15-1.41) 19 0.10 (0.06-0.15)
before NAT 168,229 206 1.22 (1.06-1.39) 15 0.12 (0.07-0.21) since NAT 125,310 169 1.35 (1.14-1.55) 4 0.06 (0.02-0.15) Repeated donation
no (fi rst-time donors) 232,127 356 1.53 (1.38-1.70) - -yes, previous donation ≤12 months prior 17,688 10 0.57 (0.29-1.51) 10 1.01 (0.48-1.85) yes, previous donation >12 months prior 43,724 9 0.002 (0.03-0.14) 9 0.05 (0.02-0.09) Sex
male 173,651 252 1.45 (1.28-1.64) 12 0.09 (0.04-0.16) female 119,888 123 1.02 (0.85-1.22) 7 0.12 (0.05-0.24) Age group (years)
16-24 95,787 46 0.48 (0.35-0.64) 1 0.06 (0.00-0.33) 25-34 97,586 91 0.93 (0.75-1.15) 3 0.04 (0.00-0.12) 35-44 59,046 125 2.12 (1.76-2.52) 10 0.18 (0.08-0.33) 45-65 41,120 113 2.75 (2.26-3.30) 5 0.13 (0.04-0.29)
Blood bank location
Blumenau 37,767 17 0.49 (0.28-0.78) 0 0
Chapecó 36,980 22 0.59 (0.37-0.90) 0 0
Criciúma 45,166 99 2.19 (1.78-2.68) 4 0.22 (0.06-0.58) Florianópolis 71,797 132 1.83 (1.53-2.18) 6 0.07 (0.02-0.15) Joaçaba 25,270 20 0.79 (0.48-1.22) 2 0.56 (0.07-2.02) Joinville 58,815 57 0.97 (0.73-1.25) 3 0.06 (0.01-0.18) Lages 20,744 28 1.35 (0.90-1.95) 4 0.17 (0.04-0.43) Educational level (years of school completed) 401 4 9.97 (2.72-25.34) 0 0
0 years of school completed 36,260 80 2.20 (1.75-2.74) 9 0.35 (0.16-0.67) incomplete primary school (1-7) 29,018 59 2.03 (1.55-2.62) 0 0 completed primary school (8) 20,376 31 1.52 (1.03-2.16) 1 0.09 (0.00-0.49) incomplete secondary school (9-10) 110,156 123 1.12 (0.93-1.33) 6 0.08 (0.03-0.18) completed secondary school (11-12) 44,315 34 0.76 (0.53-1.07) 2 0.11 (0.01-0.39) incomplete college education (13-14) 42,457 34 0.80 (0.55-1.18) 1 0.03 (0.00-0.15) completed college education (>14) 754 0 0 0 0 post-graduate education 9,802 133 1.11 (0.93-1.31) 0 0.07 (0.02- 0.17)
no information
Co-infectiond
absent 276,719 303 1.09 (0.97-1.22) 0 0.10 (0.06-0.15) present 16,820 72 4.28 (3.35-5.39) 19 0.63 (0.02-3.53)
aper 1,000 donors; bper 1,000 repeat donor-years; cexcluding inconclusive test results; dwith hepatitis B virus, hepatitis C virus, human T-cell
2007 2008 2009 20102011 2012 2013 0 0,01 0,02 0,03 0,04 0,05 0,06 P ro p o rt io n HIV p o s it iv e Age (years) 16-24 25-34 35-44 45-65
FIGURE 1 - Proportion of male repeat donors infected by HIV, by age group. HIV: human immunodefi ciency virus.
16-24 25-34 35-44 45-65
2007 2008 2009 2010 2011 2012 2013 0 0,01 0,02 0,03 0,04 0,05 0,06 P ro p o rt io n HIV p o s it iv e Age (years)
FIGURE 2 - Proportion of female repeat donors infected by HIV, by age group. HIV: human immunodefi ciency virus.
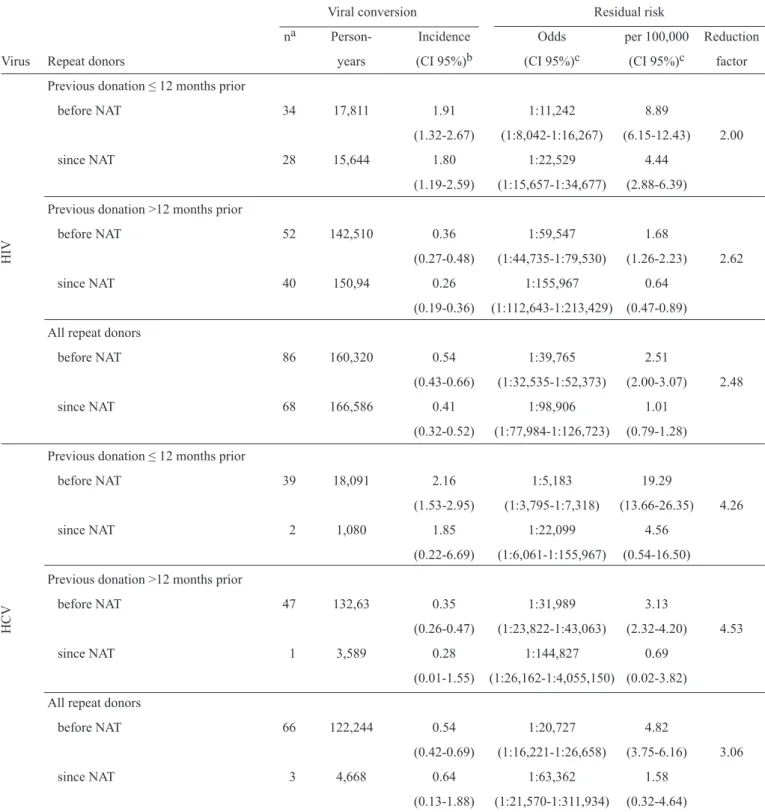
incidence of 1.91 per 1,000 person-years in repeat donors
with inter-donation intervals of ≤ 12 months, the residual risk is 8.89 per 100,000 person-years. Since the NAT screening
was introduced, the same group reduced both its window
period (from 17 to 9 days, or 0.0246 years) and its incidence (from 1.91 to 1.80 per 1,000 person-years), thus producing an HIV residual risk of 4.44 per 100,000 person-years, which
is a two-fold reduction compared with the period when only serological screening was conducted. For repeat donors with
inter-donation intervals of >12 months, the HIV residual risk was reduced 2.62 times. During the NAT screening period, HCV
residual risk was reduced 4.26 and 4.53 times for repeat donors with shorter and longer inter-donation intervals, respectively.
Overall, HIV incidence and prevalence increased by 54.2% (from 0.72 to 1.11 per 1,000 person-years) and 14.5% (from 1.38 to 1.58 per 1,000), respectively, after NAT implementation, but the differences did not reach statistical signifi cance (Table 1).
However, the incidence of HIV conversion in all repeat donors
decreased by 24.1%, from 0.54 to 0.41 per 1,000 person-years, thus contributing to the residual risk reduction. The magnitude
of the HIV window reduction was even larger, decreasing by 47.1% (from 17 to 9 days). In contrast, HIV residual risk in all
repeat donors decreased 2.5 times after NAT implementation,
from 2.51 to 1.01 per 100,000 person-years (Table 3).
Overall, HCV incidence and prevalence increased by 100% (from 0.06 to 0.12 per 1,000 person-years) and 10.6% (from 1.22 to 1.35 per 1,000), respectively, after NAT implementation
(Table 2), but the increases were not statistically signifi cant.
Although the incidence of HCV conversion in all repeat donors increased by 18.5% (from 0.54 to 0.64 per 1,000 person-years) after NAT implementation, HCV residual risk during the NAT screening period still decreased approximately
three-fold compared with the period using only serologic screening
(Table 3). This risk reduction was likely driven by a large HCV
window reduction of 72.4% (from 32.6 to 9 days) in the NAT
screening period.
DISCUSSION
Increased participation by fi rst-time donors (from 70% to over 90%) and women (from 38% to almost 45%), in parallel
with decreased participation by repeat donors with an
inter-donation interval of 12 months or less (from 10% to <1%), might have affected the overall HIV and HCV incidence rates
reported in Tables 1 and 2. However, these factors did not change the incidence of viral conversion (Table 3) since the last screen-negative donation or the corresponding residual risk estimates because co-infection with another infectious agent
(mainly HBV) screened them out anyway. The interaction of these factors is complex. The vast majority of publications
have reported a higher prevalence of blood-borne infections
in fi rst-time donors compared with repeat donors, including in Brazil1,5-9,10, thus implying higher disease incidence as well. However, the present study showed evidence to the contrary,
with HIV and HCV prevalences being approximately three- and
two-fold higher, respectively, in the repeat donors compared
with the fi rst-time donors. The increase in HIV prevalence
was much higher among male donors of 16-24 years of age in
comparison with any other demographic segment (Figures 1
and 2), reinforcing the hypothesis of test-seeking behavior
among the former. Independent evidence of such behavior was obtained in the State of São Paulo, where 9% of all donors were estimated to be HIV test seekers with a high risk for sexually
transmitted diseases10,13. In the State of Santa Catarina, a sudden
rise in HIV prevalence among blood donors was observed in
the beginning of the 2000s after a consistent downward trend
in the 1990s, possibly associated with HIV test seeking7. The
HIV incidence per thousand repeat blood donors per year increased from 0.36 (CI 95% 0.13-0.79) at the end of the 1990s5
to 0.86 (0.73-1.00) during the 2007-2013 period, as shown in
the present study. This worrying result requires a rethinking of current prevention strategies and immediate action to reduce
HIV transmission among the blood donor population.
It is important to recall that that the number of converting
repeat donors is typically lower for the incidence rate of viral conversion used for the residual risk calculation because of
TABLE 3 - HIV and HCV residual risk by donor type before and after implementation of NAT screening.
Viral conversion Residual risk
na Person- Incidence Odds per 100,000 Reduction
Virus Repeat donors years (CI 95%)b (CI 95%)c (CI 95%)c factor Previous donation ≤ 12 months prior
before NAT 34 17,811 1.91 1:11,242 8.89
(1.32-2.67) (1:8,042-1:16,267) (6.15-12.43) 2.00 since NAT 28 15,644 1.80 1:22,529 4.44
(1.19-2.59) (1:15,657-1:34,677) (2.88-6.39)
Previous donation >12 months prior
before NAT 52 142,510 0.36 1:59,547 1.68
(0.27-0.48) (1:44,735-1:79,530) (1.26-2.23) 2.62 since NAT 40 150,94 0.26 1:155,967 0.64
(0.19-0.36) (1:112,643-1:213,429) (0.47-0.89)
All repeat donors
before NAT 86 160,320 0.54 1:39,765 2.51
(0.43-0.66) (1:32,535-1:52,373) (2.00-3.07) 2.48 since NAT 68 166,586 0.41 1:98,906 1.01
(0.32-0.52) (1:77,984-1:126,723) (0.79-1.28) Previous donation ≤ 12 months prior
before NAT 39 18,091 2.16 1:5,183 19.29
(1.53-2.95) (1:3,795-1:7,318) (13.66-26.35) 4.26
since NAT 2 1,080 1.85 1:22,099 4.56
(0.22-6.69) (1:6,061-1:155,967) (0.54-16.50)
Previous donation >12 months prior
before NAT 47 132,63 0.35 1:31,989 3.13
(0.26-0.47) (1:23,822-1:43,063) (2.32-4.20) 4.53
since NAT 1 3,589 0.28 1:144,827 0.69
(0.01-1.55) (1:26,162-1:4,055,150) (0.02-3.82)
All repeat donors
before NAT 66 122,244 0.54 1:20,727 4.82
(0.42-0.69) (1:16,221-1:26,658) (3.75-6.16) 3.06
since NAT 3 4,668 0.64 1:63,362 1.58
(0.13-1.88) (1:21,570-1:311,934) (0.32-4.64)
aNumber of converting donors without another screen-positive test result; bViral conversion incidence per thousand person-years; cResidual
risk and 95% CI, assuming an HIV immunological window period of 17 or 9 days for before or since NAT implementation, respectively, and an HCV window period of 32.6 and 9 days for before or since NAT implementation, respectively. HIV: human immunodefi ciency virus; HCV: hepatitis C virus; NAT: nucleic acid amplifi cation test.
HCV
HIV
diseases such as hepatitis B and syphilis, which indicate risky
sexual behavior. The exclusion of these blood donors reduced the HIV incidence per thousand repeat donors per year from 6.25 (Table 1) to 1.91 and 1.81 (Table 3) for the periods before and
after NAT implementation, respectively. As a consequence, the HIV incidence used for the residual risk calculation decreased
slightly over the compared periods despite a considerable
the same time period. Taken together, these fi ndings suggest that halving the HIV residual risk after the implementation of NAT
(Table 3) was mainly due to a reduction in the immunological
window period rather than a reduction in the incidence of HIV
conversion. Among the repeat donors for whom the previous
inter-donation interval was longer than 12 months, HIV residual risk was reduced 2.62-fold during the NAT screening period.
Overall, the HCV incidence in HEMOSC was halved after
the NAT implementation (Table 2). Although this change did
not reach statistical signifi cance, it contributed to a more than four-fold reduction in the HCV residual risk in repeat donors,
suggesting that the downward trend reported in the 1990s, during
which the HCV residual risk decreased to 51 per 100,000 repeat
donors per year6, is continuing. The present study showed a
further reduction of this risk to an approximately fi ve-fold lower level. However, HCV incidence was approximately twenty times
higher in the repeat donors whose last inter-donation interval was shorter than 12 months compared with those having longer
intervals. Despite relatively rare sexual transmission of HCV, this
infection is still a marker of risky behavior for various blood-borne diseases. Therefore, the magnitude of the above difference in
HCV incidence rates reinforces the hypothesis of HIV test seeking
among some repeat donors with shorter inter-donation intervals. The similarities in magnitude and direction of both prevalence
and incidence regarding the risk factors analyzed underline the
notion of prevalence as a cumulative incidence and its use for
estimating the viral conversion risk in fi rst-time donors14. In
Brazil, higher HIV prevalence rates among men and those with
lower educational levels were reported for both the general population15 and blood donors10, including in the capital of Florianópolis compared with other regions of the State of Santa Catarina1,16. The present study showed that the City of
Criciúma had the highest HIV and HCV risk among blood donors. An HCV incidence of 3.11 per 100,000 donor-years and an HCV residual risk of 0.5 per 100,000 were reported for the capitals of the federal States of São Paulo, Rio de Janeiro and Minas Gerais in 2007, along with a downward trend over time17. This fi nding
is in line with similar trends among HEMOSC blood donors. Increases in the overall HIV and HCV incidence rates during the NAT screening period may be a consequence of higher NAT sensitivity compared with serological testing. For HIV, a high
prevalence of 1.46 per thousand donors in the present study was close to the prevalence of 1.51 reported in South Africa but is considerably
higher than the prevalence rates of 0.23 reported in the Mediterranean
and Central Europe and 0.34 reported in Southeast Asia18.
This paper is the fi rst report on the performance of Brazilian HIV/HCV NAT screening on prevalence and incidence in
blood donors. An HIV residual risk of 2.51 per 100,000 per
year observed in HEMOSC between 2007 and 2013 is close
to the value of 2 per 100,000 per year reported at the turn of the century in the Florianópolis metropolitan area5,7 and in the City of Lages9 but lower than the 3.82 estimated for the entire State1. The data compiled from the blood banks of São Paulo,
Belo Horizonte and Recife during the 2007-2008 period produced an HIV residual risk of 1.13 per 100,000 and projected its reduction by a factor of 1.66 when using six-sample
mini-pools and an immunologic window duration of nine days, or
by a factor of 2.69 when using individual NAT screening and a
window period of 5.6 days10. An HIV residual risk of 2.51 per 100,000 in HEMOSC and its reduction by a factor of 2.49 when
using six-sample mini-pools for NAT screening are reasonably close to the aforementioned projections.
Among the present study limitations, it is worth mentioning
the lack of publications on the Brazilian NAT kit’s limits of
detection and the focus on residual risk. The latter is the risk of transfusing an infected blood unit; however, the risk of a recipient becoming infected with the transfusion-transmitted agent still depends on the minimal infectious dose and the host
immunological response. Recent studies have emphasized
the risk of a recipient developing a transfusion-transmitted infection18,19, which will also be estimated for the Brazilian NAT data in the near future. Another limitation is the low precision of rare events, such as viral conversion, thus limiting the comparisons across regions and/or countries. Finally, although
the so-called NAT yield (the proportion of serologically negative and NAT-positive cases) is a direct measure of the NAT’s impact
on blood safety, the only way to compare the impact before
versus after NAT implementation is to use the incidence/window
period model that is available for both periods.
Despite large reductions in HIV and HCV residual risk after the implementation of NAT screening in the State of Santa Catarina, the overall HIV incidence of over one per thousand
donor-years is almost one hundred times higher compared
with countries such as France, Germany, the USA, Canada
and Australia20-26. More effective prevention measures need
to be implemented in the Brazilian general population before
transfusion risk can be reduced further1. Otherwise, technological
advances, such as individual NAT screening, will still have a limited benefi cial impact on blood safety. Therefore, better
integration between blood safety policies and policies that prevent
sexually transmitted diseases in the general population should
dominate the research and development agenda in this area.
ACKNOWLEDGMENTS
The authors would like to thank the working group on blood
and hemocomponents from the Brazilian Ministry of Health and the FIOCRUZ scientists who developed the HIV/HCV NAT kit
for their insightful comments.
The authors declare that there is no confl ict of interest.
CONFLICT OF INTEREST
FINANCIAL SUPPORT
The work was supported by joint funding from the Brazilian
Ministry of Health and FAPESC (Fundação de Apoio à Pesquisa
Científi ca e Tecnológica do Estado de Santa Catarina) via grant
REFERENCES
1. Maresch C, Schluter PJ, Wilson AD, Sleigh A. Residual infectious
disease risk in screened blood transfusion from a high-prevalence
population: Santa Catarina, Brazil. Transfusion 2008; 48:273-281. 2. Roth WK, Busch MP, Schuller A, Ismay S, Cheng A, Seed CR, et al.
International survey on NAT testing of blood donations: expanding implementation and yield from 1999 to 2009. Vox Sang 2012; 102:82-90. 3. Canutti Júnior V. Risco transfusional: Metodologia e estudo.
Atualização em Hemoterapia 1998; 5:90-99.
4. Covas DT. Risco de transmissão do HIV-1 pelas transfusões de sangue. Atualização em Hemoterapia 1998; 5:100-106.
5. Kupek EJ. Residual transfusion risk for hepatitis B and C in southern Brazil, 1991-1999. J Viral Hepat 2001; 8:89-82.
6. Kupek EJ. The redution of HIV reduction of HIV transfusion risk in southern Brazil in the 1990s. Transfusion Med 2001; 11:75-78. 7. Kupek E. Transfusion risk for hepatitis B, hepatitis C and HIV in the
state of Santa Catarina, Brazil, 1991-2001. Braz J Infect Dis 2004;
8:236-240.
8. Barreto CC, Sabino EC, Gonçales TT, Laycock ME, Pappalardo BL, Salles NA, et al. Prevalence, incidence, and residual risk of human immunodefi ciency virus community and replacement fi rst-time blood donors in São Paulo, Brazil. Transfusion 2005; 45:1709-1714.
9. Spada C, Souza MA, Treitinger A. Estimation of the Residual Risk for the Transmission of HIV in Blood Donors from the Mountain region of Santa Catarina. Braz J Infect Dis 2005; 9:489-493.
10. Sabino EC, Gonçalez TT, Carneiro-Proietti AB, Sarr M, Ferreira JE,
Sampaio DA, et al. Human immunodefi ciency virus prevalence, incidence, and residual risk of transmission by transfusions at Retrovirus Epidemiology Donor Study-II blood centers in Brazil. Transfusion
2012; 52:870-879.
11. Pinto AR, Petry A, Graef T, Vandresen R, Kupek EJ. Case report of haemovigilance investigation using phylogenetic analysis of HIV-1 in Brazil. Transfus Med 2012; 22:57-62.
12. Schreiber GB, Busch MP, Kleinman SH, Korelitz JJ. The risk of transfusion-transmitted viral infections. NEJM 1996; 334:1685-1690.
13. Goncalez TT, Sabino EC, Murphy EL, Chen S, Chamone DA, McFarland W.
Human immunodefi ciency virus test-seeking motivation in blood donors, São Paulo, Brazil. Vox Sang 2006; 90:170-176.
14. Zou S, Fang CT, Dodd RY. A method for estimating incidence rate of infectious diseases among fi rst-time blood doors. Transfusion 2008;
48:1827-1832.
15. Fonseca MG, Bastos FI. Twenty-fi ve years of the AIDS epidemic in Brazil: principal epidemiological fi ndings, 1980-2005. Cad Saude Publica 2007; 23 (supl III): S333-S344.
16. Rosini N, Mousse D, Spada C, Treitinger A. Seroprevalence of HbsAg, anti-HBc and anti-HCV in Southern Brazil, 1999-2001. Braz J Infect Dis 2003; 7:262-267.
17. Almeida-Neto C, Sabino EC, Liu J, Blatyta PF, Mendrone-Junior A, Salles
NA, et al. Prevalence of serological markers for hepatitis B and C viruses in Brazilian blood donors and incidence and residual risk of transfusion
transmission of hepatitis C virus. Transfusion 2013; 53:827-834.
18. Bruhn R, Lelie N, Custer B, Busch M, Kleinman S, International NAT Study Group. Prevalence of human immunodefi ciency virus RNA and antibody in fi rst-time, lapsed and repeat blood donations across fi ve international regions and relative effi cacy of alternative screening
scenarios. Transfusion 2013; 53:2399-2412.
19. Vermeulen M, Lelie N, Sykes W, Crookes R, Swanevelder J, Gaggia L,
et al. Impact of individual-donation nucleic acid testing on risk of human immunodefi ciency virus, hepatitis B virus, and hepatitis C virus
transmission by blood transfusion in South Africa. Transfusion 2009; 49:1115-1125.
20. Glynn SA, Kleinman SH, Schreiber GB, Busch MP, Wright DJ, Smith JW,
et al. Trends in incidence and prevalence of major transfusion-transmissible viral infections in US blood donors, 1991 to 1996. Retrovirus Epidemiology Donor Study (REDS). JAMA 2000; 284:229-235. 21. Dodd RY, Notari EP, Stramer SL. Current prevalence and incidence
of infectious disease markers and estimated window-period risk in the
American Red Cross blood donor population. Transfusion 2002; 42:975-979. 22. Chiavetta JA, Escobar M, Newman A, He Y, Driezen P, Deeks S,
et al. Incidence and estimated rates of residual risk for HIV, hepatitis C,
hepatitis B and human T-cell lymphotropic viruses in blood donors in
Canada, 1990-2000. CMAJ 2003; 169:767-773.
23. Seed CR, Kiely P, Keller AJ. Residual risk of transfusion transmitted human immunodefi ciency virus, hepatitis B virus, hepatitis C virus and human T lymphotrophic virus. Intern Med J 2005; 35:592-598. 24. Busch MP, Glynn SA, Stramer SL, Strong DM, Caglioti S, Wright DJ,
et al. A new strategy for estimating risks of transfusion-transmitted viral infections based on rates of detection of recently infected donors. Transfusion 2005; 45:254-264.
25. Pillonel J, Le Marrec N, Girault A, David D, Laperche S. Epidemiological
surveillance of blood donors and residual risk of blood-borne infections in France, 2001 to 2003. Transfus Clin Biol 2005;12:239-246.
26. Zou S, Dorsey KA, Notari EP, Foster GA, Krysztof DE, Musavi F, et al.
Prevalence, incidence, and residual risk of human immunodefi ciency virus