- 1030 - Original Article
QUALITY OF ANTHROPOMETRIC DATA OF HYPERTENSIVE USERS
SEEN AT THE FAMILY HEALTH PROGRAM AND ITS CORRELATION
WITH RISK FACTORS
1Iara Medeiros de Araújo2, Neir Antunes Paes3
1 This study was developed based on the project - Avaliação da efetividade no controle da hipertensão arterial sistêmica e associação com
fatores de risco, comparando a atenção do Programa de Saúde da Família e de Unidades Básicas de Saúde de municípios do nordeste do Brasil. Process No. 576671/2008-8, period 2009-2010. Approved on the public notice MCT/CNPq/MS-SCTIE-DECIT/MS n. 37/2008. 2 Doctoral student in Health Sciences by the Federal University of Rio Grande do Norte. Rio Grande do Norte, Brazil. E-mail:
imedeiros_araujo@yahoo.com.br
3 Ph.D. in Demography. Associate Professor of the Federal University of Paraíba. Paraíba, Brazil. E-mail: antunes@de.ufpb.br
ABSTRACT: The purpose of this study was to analyze and compare the quality of anthropometric data, obesity and other risk factors of hypertensive patients seen at the Family Health Program in the city of João Pessoa, Brazil. It is a study of cohort to examine registration data, records and personal interviews retrospectively. The study investigated the quality of data through the imputation of missing records in hypertensive patients enrolled, whose comparison of indicators constructed before and after was done by the t’Student test, besides calculating the odds ratio, the logistic regression, in order to establish a possible association between these variables and the
dependent variable. There was a signiicant correlation p< 0.001 between the anthropometric measurements of waist circumference and waist-hip ratio with those obese subjects with hypertension. Additionally, there was found to be a signiicant correlation p<0.01
between patients with hypertension and their age. The results suggest an increased prevalence of high blood pressure with age and associated anthropometric indicators.
DESCRIPTORS: Blood pressure. Obesity. Prevalence.
QUALIDADE DOS DADOS ANTROPOMÉTRICOS DOS USUÁRIOS
HIPERTENSOS ATENDIDOS NO PROGRAMA DE SAÚDE DA FAMÍLIA E
SUA ASSOCIAÇÃO COM FATORES DE RISCO
RESUMO: O objetivo deste trabalho foi analisar a qualidade dos dados antropométricos dos hipertensos, no Programa de Saúde da Família, e sua associação com obesidade e demais fatores de risco. Trata-se de um estudo de coorte em que foram investigados os dados cadastrais, prontuários e entrevistas dos usuários no município de João Pessoa-PB. Investigou-se a qualidade dos dados, pela imputação dos registros faltantes nos hipertensos, cuja comparação dos indicadores construídos antes e depois foi feita pelo teste t´Student, além
de calcular a razão de chances, pela regressão logística, com a inalidade de estabelecer uma possível associação destas variáveis com
a variável dependente. Observou-se uma associação signiicativa entre a obesidade dos hipertensos, com circunferência da cintura e
razão cintura quadril (p<0,001). Evidenciou-se, também, uma associação signiicativa dos níveis de hipertensão e idade (p<0,01). Os resultados sugerem aumento da prevalência da pressão arterial com a idade e sua associação com os indicadores antropométricos.
DESCRITORES:Pressão arterial. Obesidade. Prevalência.
CUALIDAD DE LOS DATOS ANTROPOMÉTRICOS DE LOS USUARIOS
HIPERTENSOS ATENDIDOS EN EL PROGRAMA DE SALUD DE LA
FAMILIA Y SU ASOCIACIÓN CON FACTORES DE RIESGO
RESUMEN: El objetivo de este trabajo consistió en analizar la cualidad de los datos antropométricos de los hipertensos atendidos en el Programa de Salud de la Familia y su asociación con la obesidad y demás factores de riesgo. Se trata de un estudio de cohorte donde fueron investigados los datos catastrales, prontuarios y las entrevistas de los usuarios en el municipio de João Pessoa-PB, Brasil Se investigó la cualidad de los datos a través de la imputación de los registros faltantes en los hipertensos catastrados, cuya comparación de los indicadores construidos antes y después fue hecha por la prueba t de Student, además el cálculo de la razón de posibilidades,
la regresión logística, con el in de establecer una posible asociación entre estas variables y la variable dependiente. Se observó una asociación signiicativa entre la obesidad de los hipertensos con circunferencia de la cintura y razón cintura cuadril con p<0,001. Se evidenció también una asociación signiicativa de los niveles de hipertensión y con edad con p<0,01. Los resultados sugieren aumento
INTRODUCTION
In the world setting, chronic degenerative diseases are the main cause of morbimortality, especially cardiovascular diseases. Risk factors such as hypertension, Diabetes Mellitus, smok-ing, inadequate eating habits, sedentary lifestyle, overweight and obesity favor these diseases.1
The probability of cardiovascular risk is well known to increase or decrease due to inap-propriate loss and intake of calories.2 Studies demonstrate an association of obesity with arterial pressure measures, emphasizing bad food habits and the lack of physical activities as susceptible factors for increasing arterial pressure, suggest-ing authorities should take action against this problem.3 Despite the increasing number of occur-rences of cardiovascular diseases throughout the
years, the government has not favored a speciic
and interventionist policy to socially articulate treatment for hypertensive patients.4
In addition to this lack of incentive, approxi-mately 40% of patients with hypertension
prob-lems have dificulties in controlling it, whereas in
Brazil, this number reaches more than 70%, with
the greatest dificulty being the compliance to
treatment, visits to the physician and appropriate change of habits.5-7
Early identiication and access to the service
facilitate control for hypertensive patients, who
can ind the main entrance for follow-up in the
primary health care system, which is also
respon-sible for sending all the speciic information to
the Ministry of Health, through an information system.8
Health information systems are tools that help the development of actions and services in the health area. Actions and services include all activities performed with people, both individu-ally and collectively, aimed to promote, prevent, diagnose, treat, and rehabilitate complications and diseases. Services are provided in outpatient clin-ics, hospital, diagnostic and therapeutic support units managed by the government (municipal, state and federal), in addition to other locations, particularly the home of patients.9
Among the systems implemented by the Ministry of Health, one refers to diabetes and hy-pertensive treatments, known as Hiperdia. It was created in partnership with many institutions, in 2001, with the primordial purpose of constructing a system that would reorganize the information on the services and carriers of these diseases.
This instrument is used to monitor follow-up in consultations, the use of medications and the
control of inluencing factors for compliance, re
-vealing it as an essential tool for the evolution of care and patients.10 The variables in the Hiperdia
registration ile (arterial pressure, blood glucose,
weight, height and waist circumference) add to the
classiied risk factors (sedentary lifestyle, obesity,
systolic and diastolic blood pressure) and help health professionals in the search for mechanisms of reduction and monitoring these groups.11
In addition to these systems (Primary Health Care Information System – SIAB, as per its acro-nym in Portuguese, Hiperdia), the Family Health Strategy (FHS) enhances its activities based on the
family history inserted in the family medical ile.
It is presented as a deciding element for planning, programming, and evaluating family members’ needs. Its consistency and reliability are extremely important to know the real health conditions of patients, enabling more effective interventions, and making them key-elements inside the FHS.12
An enormous gap is observed in researches reporting the quality of information recorded by the Hiperdia program, aimed at the nutritional state of the patient, despite its great relevance in the predisposition of risk factors for hypertension. These investigations refer to cross-sectional studies to control the hypertension of registered patients,
dificulties in dealing with the system, and compli -ance to the program by municipalities.
Regarding the morbidities in question, a study developed in São Carlos-SP suggests the need for professional training in the care and reg-istration of hypertensive and diabetic patients, as well as the inclusion of important information on their health condition.13
This need is extended to the entire country, particularly the northeast region, where studies on hypertension are scarce and practically non-existing in medium cities as the case of João Pessoa, capital of the state of Paraíba.
In this context, the purpose of this study was to analyze the quality of anthropometric data from hypertensive patients in the Hiperdia program, in the primary health care units of the city of João Pessoa, and to investigate the association between these measures and risk factors for hypertension.
METHOD
pa-tients’ iles used by the Hiperdia program, in the
period between 2006 and 2007, the medical iles
of these patients in 2008, and an interview with them in 2009.
The study was performed in the city of João Pessoa, capital of the state of Paraíba and located in the northeast region of Brazil, with a population of 723,515 inhabitants.14 The city has 180 health teams in primary health care, distributed into
ive sanitary districts, and also high and medium
complexity specialized services.
It was developed within the Family Health Strategy units, which consist of multiprofessional teams developing actions of health protection and promotion and disease prevention by means of embracing and humanized services in the territory in question. Among these activities, there are
spe-ciic programs for providing services to the popu
-lation, for instance the care of hypertensive and diabetic patients inserted in the Hiperdia program. The data spreadsheet used in this study was produced based on a project entitled “Avaliação da efetividade no controle da hipertensão arterial sistêmica e associação com fatores de risco, comparando a atenção do Programa de Saúde da Família e de Unidades Básicas de Saúde de municípios do nordeste do Brasil” (Evalu-ation of effectiveness in the control of systemic hypertension and association with risk factors comparing the care in the Family Health Program and in Primary Health Care Units in cities in the northeast of Brazil)”.*
Random selections were performed from all hypertensive patients recorded in the Hiperdia program, starting from a probability sample of hypertensive patients who were older than 20 years, in the period between 2006 and 2007, from the 180 health teams registered in SIAB, compos-ing 343 patients.
The total sample size, for the selection of individuals, was based on the simple random sampling, considering the parameter of p success (obtained from the total number of hypertensive patients, divided by the total number of individu-als who used the FHS service in 2008); in which “n” was the total of hypertensive patients obtained by the normal standard, with value of 1.96,
con-idence level at 95% and maximum error margin
of e=0.035.
From these considerations, a sample of 327 hypertensive patients was obtained for João Pes-soa. The sample received 33 individuals due to an adjustment needed to even the selected teams, therefore, ten hypertensive patients were desig-nated per team or unit of random selection, and
each one of them was identiied by name and ad
-dress in the research.
The irst step consisted of a systematic
self-weighting sample of 20% of the FHS team (as clusters) as from a list provided by SIAB, resulting in 36 clusters for João Pessoa.
The second step was composed by two
stages. In the irst stage, a probability selection of
one team per each district was performed, among those selected in step 1, and in which all individu-als registered in 2006 and 2007 as hypertensive had
their medical iles and records in Hiperdia consulted. Information of interest was transcribed into a form. Thus, it was possible to learn the proportion of hy-pertensive patients. In the second stage, the number of patients in 2008 was randomly selected with a probability proportional to the size of the cluster.
Aimed at ordering data collection, the study was comprised of three phases: 1) observation of Hiperdia iles to verify the registered patients in the period between 2006 and 2007, and data collection;
2) medical iles of patients for analysis of the num
-ber of consultations and to ill out the measures
inserted in this study, in 2008; and 3) agreement with patients and the health team to perform the
interview in 2009, using a form speciically built
and validated for this study.
Patients who were diabetic, deceased,
pre-sented cognitive deicit and had moved from the
FHS covering area were excluded. Such exclusion was performed in the period the records were re-searched in the unit, and patients were therefore automatically substituted in the research, through a random selection.
Obesity was considered a dependent vari-able; and the following socioeconomic variables were considered independent: gender, age, educa-tion and family income, and anthropometric mea-sures such as weight, height, waist circumference (WC) and hip circumference (HC).
Each patient, at the time of the interview in 2009, was weighed in orthostatic position, with
* Paes NA. Project: Avaliação da efetividade no controle da hipertensão arterial sistêmica e associação com fatores
arms straight along the body, wearing no shoes and light clothes. Patients were weighed using a
LIDER® scale, model P200, approved by
INMET-RO, and provided by the State Health Department of Paraíba, with a maximum capacity for 200kg and accuracy of 100g.
The height variable was measured using a SECA® stadiometer, model 206 with accuracy of 0.1cm. The height measure was taken with the adult/elderly patient barefoot, with no head orna-ments, standing in the middle of the equipment, with his/her torso erect, arms along straight along the body, head held straight and ankles, shoulders and buttocks against the wall, with both feet joined in a straight angle to the legs.
Obesity and overweight were evaluated by calculating the body mass index (BMI), which is obtained by dividing the weight in kilograms by the height in meters, elevated to the square. The
classiication of individuals was performed with
the usual cutting levels of BMI, disregardless of the gender. These values were corresponding, respectively, to adults: less than 18.5 kg/m2 – low weight; equal or more than 18.5 and less than 25 kg/m2 -appropriate or eutrophic; equal or higher than 25 and less than 30kg/m2 – overweight; more than 30 Kg/m2 – obese; and for elderly patients, equal or less than 22 kg/m2 – low weight, more than 22 and less than 27 kg/m2 – appropriate or eutrophic; and equal or higher than 27 kg/m2 – overweight.
Fat accumulation was estimated through the following indicators: WC and Hip-to-Waist Ratio (W/H).
Waist and hip circumferences were mea-sured by a non-extensible metric tape; follow-ing the guidelines of the SISVAN Manual.15 The WC was measured with the tape placed around the normal waist, or the smaller curve, located between the last rib and the iliac crest, with no compression to the tissues. Readings were per-formed between expiration and inspiration. The hip circumference was measured by placing the tape around the hip area, over the largest part, with no compression to the tissue.
The Hiperdia ile presented no hip measure. This variable, along with the waist measure pro-vided the W/H measure, which established an important indicator of body fat location.
The WC was analyzed by using the sug-gested cut spots by the World Health Organiza-tion (WHO). Women who presented values of WC higher than 80cm and men higher than 94 cm
were classiied as having abdominal fat accumula
-tion, which is considered a risk associated to the development of diseases related to obesity, with an increased risk for women with WC>88 cm and WC> 102 in men.
For the identiication of the type of fat dis -tribution, according to the W/H, cut-off levels of cardiovascular diseases were used, considering the W/H above the recommended, in women W/
H≥0.85; and in men, W/H≥1.00.16
The classiication of the arterial pressure measure was classiied according to individuals
with Systolic Arterial Pressure (SAP) less than 120 mmHg and Diastolic Arterial Pressure (DAP) less than 80 mmHg – normal; SBP 120-139 mmHg and DBP 80-89 mmHg – pre-hypertensive. Systemic Arterial Hypertension (SAH) is observed over these values.17
Two measures of arterial pressure were per-formed, in the beginning of the interview, when
patients were seated; and after ive minutes of
rest. The mean of these measures were admitted. The measure of AP in mmHg was obtained using a sphygmomanometer with a mercury column, model DS44 and brand Welch Allyn®. The equip-ment was periodically monitored to verify its accuracy.
Due to the absence of data in the measures studied, the authors recurred to the imputation techniques in the 2006/2007 records and to the
interviews in 2009 to ind out if these losses could
have interfered in the quality of data. In order to
compare the inluence of these losses in the sample,
the imputation of anthropometric measures and
arterial pressure measures were performed to ill
out the missing data, use the mode of these mea-sures as base, or determine the missing data for the BMI and WC, through the W/H ratio.
General guidelines may be deined to choose
imputation methods, according to the proportion of missing data in some of the variables;18 a)
pro-portion≤0.05, in this case, the single imputation can
be used, or only complete data were analyzed; b) proportion between 0.05 and 0.15, a single imputa-tion can be used with no further problems, how-ever, the use of multiple imputation is indicated; and c) proportion>0.15, multiple imputations.
Analyses according to gender were per-formed with the purpose of investigating its
inluence on anthropometric and hypertension
addition to calculating the adjusted odds ratio, by logistic regression, with the purpose of establish-ing a possible association of these variables with
a dependent variable with signiicance (p<0.05).
Being an epidemiologic study, the cohort analysis of retrospective data was chosen to analyze the association of variables based on the adjusted odds ratio, which leads to indicators of the strength of this association between the factor in this study and the outcome, also allowing a judgment on the causality relation.
The present study complied with the reso-lution 196/96 of the National Health Council for studies involving human beings, which guarantees the secrecy of information, privacy and the free and informed consent. The research proposal was presented and approved by the Research Ethics
Committee of the Medical School of Nova Esper-ança, in its 8th extraordinary meeting, performed on September 10th, 2009, protocol REC FACENE/ FAMENE 174/2009, CAAE No. 5001.0.000.351-09.
RESULTS AND DISCUSSION
In the sample of 343 participants, 75.6% were women. Factors that may explain the situation include better female longevity in comparison to men; higher concern about the health condition, in addition to being the ones who sought for the health units more often.20-21
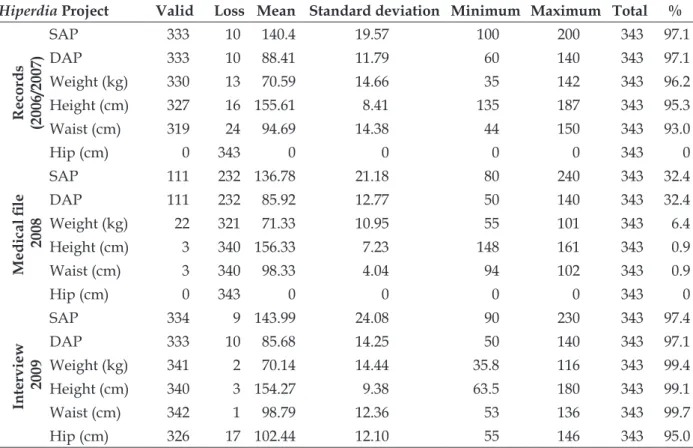
The mean values of SAPs, DAPs and the anthropometric data (weight, height, waist, and hip) from patients were compared, by using the records in Hiperdia, the medical ile and the inter -view (Table 1).
Table 1 - Statistical data of anthropometric variables and arterial pressure in patients. João Pessoa-PB (2006/2007, 2008, 2009)
Hiperdia Project Valid Loss Mean Standard deviation Minimum Maximum Total %
Records
(2006/2007)
SAP 333 10 140.4 19.57 100 200 343 97.1
DAP 333 10 88.41 11.79 60 140 343 97.1
Weight (kg) 330 13 70.59 14.66 35 142 343 96.2
Height (cm) 327 16 155.61 8.41 135 187 343 95.3
Waist (cm) 319 24 94.69 14.38 44 150 343 93.0
Hip (cm) 0 343 0 0 0 0 343 0
Medical ile
2008
SAP 111 232 136.78 21.18 80 240 343 32.4
DAP 111 232 85.92 12.77 50 140 343 32.4
Weight (kg) 22 321 71.33 10.95 55 101 343 6.4
Height (cm) 3 340 156.33 7.23 148 161 343 0.9
Waist (cm) 3 340 98.33 4.04 94 102 343 0.9
Hip (cm) 0 343 0 0 0 0 343 0
Interview
2009
SAP 334 9 143.99 24.08 90 230 343 97.4
DAP 333 10 85.68 14.25 50 140 343 97.1
Weight (kg) 341 2 70.14 14.44 35.8 116 343 99.4
Height (cm) 340 3 154.27 9.38 63.5 180 343 99.1
Waist (cm) 342 1 98.79 12.36 53 136 343 99.7
Hip (cm) 326 17 102.44 12.10 55 146 343 95.0
Regarding the medical ile in 2008, there
was a great loss of information from the indi-viduals in the research. The record was found, however, there was no follow up or data was not
input in the medical ile. The measure of arterial
pressure stands out, as this is a fundamental
requirement in the medical routine to start analyzing pertinent information to the health condition of patients, and this information was
missing in most medical iles. The loss of data
According to the data from the records and from the interview in 2009, few losses in anthropometric measures were observed, all under 5%, except for the waist measure in Hiperdia, with 24 losses in a universe of 343, corresponding to 7%.
Despite the low rate of losses in the study, imputation was performed. The technique was
adopted to enable working with all data in case of losses throughout the study.
A study conirms that the researcher has
a considerable gain in results when inputting missing data, instead of analyzing the research restricted to the complete cases.22 Comparisons among the mean of measures were done by using Student’s t test, as shown in table 2.
Table 2 - Imputation of anthropometric indicators and arterial pressure for illing out missing data
in the records and at the time of the interview. João Pessoa-PB, 2009
Before imputation After imputation
Records
(2006/2007)
Measures Mean Standard deviation Mean Standard deviation t p*
BMI 29.2 2.0 29.3 2.2 0.392 0.35
WC 94.7 14.3 95.1 13.9 0.219 0.41
SAP 140.4 19.5 140.4 19.3 -0.008 0.50
DAP 88.4 11.8 88.2 11.7 -0.271 0.39
Interview
2009
BMI 29.3 5.5 29.3 5.5 -0.121 0.45
WC 98.8 12.4 98.8 12.3 0.001 0.50
SAP 144.0 24.1 143.9 23.8 -0.057 0.48
DAP 85.7 14.2 85.5 14.1 -0.152 0.44
* Student’s t test.
Regarding the anthropometric indicators and the arterial pressure, results show no
sig-niicant differences of mean values of BMI, WC,
SAP and DAP, before and after imputation. This
is justiied by the low percentage of losses in both
sources of data, which may dismiss, in this case, the imputation of measures since there was no
evidence of statistically signiicant differences.
Nevertheless, for the purpose of this study, fur-ther analyses were performed using the imputed values, which means working with all hyper-tensive patients from the original sample. Table 3 demonstrates the comparison of mean values from the Hiperdia records, with the research data imputed by BMI, WC, SAP, DAP indicators, ac-cording to gender.
Table 3 - Anthropometric and arterial pressure distribution, according to gender. João Pessoa-PB, 2009
Measures
Female Male
n Mean Standard
deviation t p* n Mean
Standard
deviation t p*
BMI - records 253 29.6 6.1 - - 90 28.8 10.5 -
-BMI - interview 253 29.7 5.8 -0.607 0.257 90 28.1 4.2 0.643 0.261
WC - records 253 93.9 14.0 90 97.8 13.5
WC - interview 253 99.0 12.2 -6.559 0.001 90 98.2 12.8 -0.306 0.380
SAP - records 253 140.0 19.7 90 141.6 18.2
SAP - interview 253 143.3 23.2 -2.234 0.013 90 145.6 25.3 -1.297 0.099
DAP - records 253 87.8 12.0 - - 90 89.1 10.8 -
-DAP - interview 253 85.7 13.9 2.224 0.014 90 85.1 14.7 2.391 0.010
Although the BMI showed no signiicant evi -dence to the level of 5%, there was an increase in values for women, and a reduction for men, at the time of the interview, when Hiperdia and records were compared. Similar results were obtained in a study with adults, in surveys regarding risk factors and non-transmissible diseases.23
Analysis demonstrated differences among the means from the Hiperdia data and the study questionnaire for WC, SAP, DAP in women, and
DAP in men, to a signiicance level of 5%.
Considering the isolated waist classiied as
an associated risk to the development of diseases related to obesity, a similar study showed evidence
that obesity would be signiicantly present, in a
higher degree, in women, than in men (p<0.005).24 A study emphasized that a greater concen-tration of abdominal fat, in women, is found in as-sociation with the number of pregnancies, mainly in women who had four or more pregnancies, in addition to the loss of estrogen due to aging.23
Regarding the decrease of DAP, the occur-rence may be related to the age range or to the way the professional measured the arterial pressure, as diastolic pressure is considered the last
ausculta-tion to be veriied, which makes it dificult to be
acknowledged by some professionals.
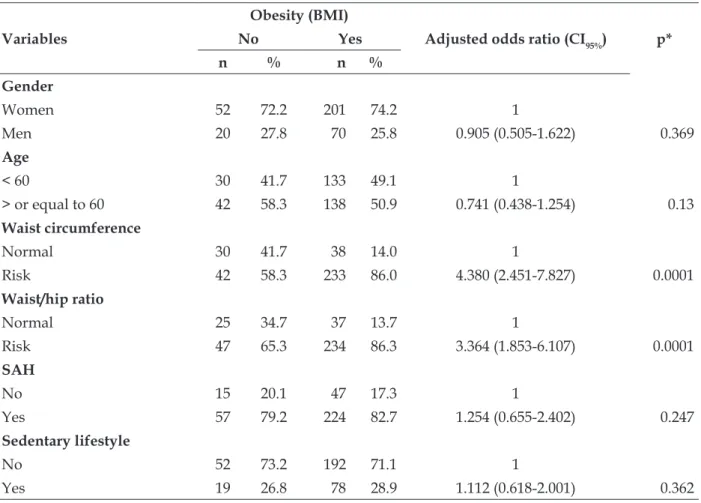
Table 4 shows the association of obesity with the independent categorical variables, using the data from the interview in 2009.
Table 4 - Association of obesity with independent variables category at the time of the interview.
João Pessoa-PB, 2009
Variables
Obesity (BMI)
Adjustedodds ratio (CI95%) p*
No Yes
n % n %
Gender
Women 52 72.2 201 74.2 1
Men 20 27.8 70 25.8 0.905 (0.505-1.622) 0.369
Age
< 60 30 41.7 133 49.1 1
> or equal to 60 42 58.3 138 50.9 0.741 (0.438-1.254) 0.13
Waist circumference
Normal 30 41.7 38 14.0 1
Risk 42 58.3 233 86.0 4.380 (2.451-7.827) 0.0001
Waist/hip ratio
Normal 25 34.7 37 13.7 1
Risk 47 65.3 234 86.3 3.364 (1.853-6.107) 0.0001
SAH
No 15 20.1 47 17.3 1
Yes 57 79.2 224 82.7 1.254 (0.655-2.402) 0.247
Sedentary lifestyle
No 52 73.2 192 71.1 1
Yes 19 26.8 78 28.9 1.112 (0.618-2.001) 0.362
* Chi-square.
In the bivariate analysis, there was a
sig-niicant association between obesity and WC, and W/H ratio with p<0.0001. The difference points to
the need for introducing, in the routine of health care services, the measures of waist and hip as risk factors for circulatory diseases.
According to the adjusted odds ratio, people in the risk category for waist circumference pre-sented 4.38 times more chances for obesity, with
a conidence interval at 95% between 2.541 and
individuals who had values above normal, accord-ing to the odds, would have 4.36 more chances of
being classiied as obese, with a conidence interval
at 95% of 1.85 to 6.10, also representing a strong association. It is important to emphasize that the odds ratio calculation implicates no cause/effect, only suggesting the association.
Researchers, evaluating individuals older than 40 years of age, found that around 50% of the elderly were obese. Moreover, the altered waist circumference was superior to 50% in women and 40% in men.25
Other studies veriied that both the BMI
and the WC, isolated, are strong predicting factors for comorbidities related to obesity. Nevertheless, when they were both analyzed as a compound, only WC had a positive and
signiicant association to these comorbidities.
Thus, the authors suggest WC is the best
anthro-pometric parameter, and that a better stratiica
-tion is needed for its cut-off points.26 BMI does
not demonstrates which speciic part of the body
is altered.27
In a similar study in patients from the Family Health Program, 84% of the individuals presented increased W/H ratio, with these individuals presenting 2.5 times more chances of presenting overweight. This study reveals a possible negative progression in the health condition of patients as they start follow-up in the service.28
Therefore, after verifying the association of measures of WC and W/H with obesity, the next stage was to investigate whether these measures would compromise arterial pressure levels in pa-tients from this present study.
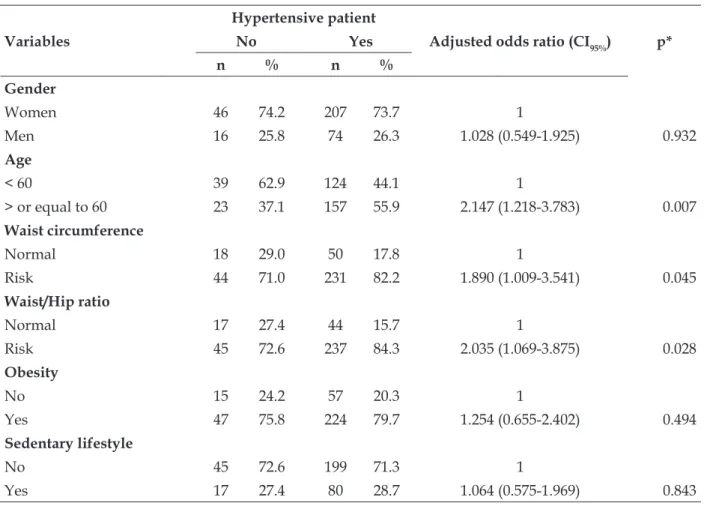
Table 5 demonstrates the association of an-thropometric measures with hypertension. A
sig-niicant association of hypertension with age was
observed to the level of 1%, and of hypertension with WC and W/H ratio to a level of 5%.
Table 5 - Association of anthropometric measures with hypertension at the time of the interview. João Pessoa-PB, 2009
Variables
Hypertensive patient
Adjusted odds ratio (CI95%) p*
No Yes
n % n %
Gender
Women 46 74.2 207 73.7 1
Men 16 25.8 74 26.3 1.028 (0.549-1.925) 0.932
Age
< 60 39 62.9 124 44.1 1
> or equal to 60 23 37.1 157 55.9 2.147 (1.218-3.783) 0.007
Waist circumference
Normal 18 29.0 50 17.8 1
Risk 44 71.0 231 82.2 1.890 (1.009-3.541) 0.045
Waist/Hip ratio
Normal 17 27.4 44 15.7 1
Risk 45 72.6 237 84.3 2.035 (1.069-3.875) 0.028
Obesity
No 15 24.2 57 20.3 1
Yes 47 75.8 224 79.7 1.254 (0.655-2.402) 0.494
Sedentary lifestyle
No 45 72.6 199 71.3 1
Yes 17 27.4 80 28.7 1.064 (0.575-1.969) 0.843
People at the age of 60 or older were ob-served to present more than twice the chances of being hypertensive individuals. The same oc-curred to the waist/hip ratio. Studies demonstrate the relation of increased arterial pressure to the age.29 Table 5 also demonstrated an association of waist circumference and waist/hip ratio to hy-pertension pressure. Some authors mention that the abdominal circumference is more associated to hypertension than to obesity.30 A similar study points to an increased association of abdominal circumference with hypertension.11
Recently, studies have demonstrated the severe characteristic of an increased abdominal cir-cumference, as it represents a risk for the develop-ment of chronic non-transmissible diseases, among which cardiovascular diseases stand out.31-32
Regarding sedentary lifestyle, this variable was expected to present some association with obesity or hypertension, however, as it regards a subjective item, in other words, patients only answered if they practiced or not some physical activity, it was not possible to verify this infor-mation or measure it, nor the frequency in which patients practiced these activities.
CONCLUSION
The analysis of the quality of data from pa-tients in the Hiperdia program, as well as a possible association of anthropometric indicators with obe-sity and hypertension revealed a great amount of
information loss from the medical iles and a lack
of records of the W/H ratio in the Hiperdia records. The most concerning issue is that, as it regards a
follow-up in the evolution of a speciic program for hypertensive patients, most medical iles did
not provide the measure of arterial pressure.
The importance of using the medical ile as
a hypertension control tool must be emphasized,
and illing out the arterial pressure information
and anthropometric measures is fundamental.
Dificulties were found in the absence of records in the medical iles for the analysis of how these
patients are followed up.
Regarding anthropometric indicators, the
logistic regression analysis showed a signiicant
association between obesity and WC, and W/H ratio. The difference points to the need for intro-ducing the measures of waist and hip as risk fac-tors for diseases in the circulatory system in the routine of health services.
In addition, there was also a signiicant as -sociation between hypertension and age, between hypertension with WC, and with the W/H ratio.
The results found in this study are consis-tent with national and international publications regarding the association of anthropometric mea-sures with arterial pressure levels, demonstrating
a strong inluence on obesity, as the most evident
factor for coronary diseases.
Moreover, fragilities were found in the
mechanisms to ight risk factors, as the weight and
arterial pressure presented an increase. These data
contribute to relect on the policies implemented
by the Ministry of Health to the cities, without the appropriate training of the involved professionals, who only reinforce, in educational guidelines, the use of medication.
The authors suggest not only the implemen-tation of the medication therapy, but also under-standing the family routine of those dealing with the disease, so that the care and weight control, by means of food habits education and physical activities, may be motivating situations, including in planning meetings for these activities.
The continuous supervision of data from hy-pertensive patients must be emphasized as for its importance, since the lack of precise information may lead to an epidemiologic underdimensioning in the population, compromising the planning of actions aimed at the prevention and control of these diseases.
Although dificulties resulting from the ap
-plicability in the ield show limitations, such as the preparation of the team for ield practice, patients’
compliance to treatment and coherence of answers, studies on this theme are essential, as they are increasingly more present in the routine of health services provided to the hypertensive population.
REFERENCES
1. Oliveira HAM, Fagundes RLM, Moreira EAM, Trindade EBSM, Carvalho T. Relação de indicadores antropométricos com fatores de risco para doenças cardiovascular. Arq Bras Cardiol. 2010 Mar; 94(4):478-85.
2. Salvaro RP, Ávida Júnior S. Peril lipídico e sua relação com fatores de risco cardiovascular em estudantes de nutrição. Rev SOCERJ. 2009 Set-Out; 22(5):309-17.
antropométricos em adultos de uma cidade de pequeno porte do interior do Brasil. Rev Assoc Med Bras. 2009 Jul; 55(6):716-22.
4. Costa JMB, Silva MRF, Carvalho EF. Avaliação da implantação da atenção à hipertensão arterial pelas equipes de saúde da família do município de
Recife (PE, Brasil). Ciênc Saúde Coletiva. 2011 Fev;
16(2):623-33.
5. Siegel D, Lopes J, Meier J. Antihypertensive medication adherence in the department of veterans affairs. Am J Med. 2007 Jan; 120(1):26-32.
6. Rosário TM, Scala LCN, França GVA, Pereira MRG,
Jardim PCBV. Prevalência, controle e tratamento da hipertensão arterial sistêmica em Nobres-MT. Arq
Bras Cardiol. 2009 Dez; 93(6):672-8.
7. Gomes TJO, Rocha e Silva MV, Santos AA. Controle da pressão arterial em pacientes atendidos pelo programa Hiperdia em uma Unidade de Saúde da Família. Rev Bras Hipertens. 2010 Ago; 17(3):132-9. 8. Ministério da Saúde (BR). Saúde da família: uma estratégia para reorientação do modelo assistencial. Brasília (DF): MS; 2007.
9. Noronha JC, Lima LD, Machado CV. O Sistema Único
de Saúde (SUS). In: Giovanella L, Escorel S, Lobato LVC, Noronha JC, Carvalho AI, organizadores.
Políticas e Sistema de Saúde no Brasil. Rio de Janeiro (RJ): FIOCRUZ, 2008. p.435-72.
10. Chazan AC, Perez EA. Avaliação da implementação do sistema informatizado de cadastramento e acompanhamento de hipertensos e diabéticos (Hiperdia) nos municípios do Estado do Rio de Janeiro. Rev APS. 2008 Jan-Mar; 11(1):10-6.
11. Sarno F, Monteiro CA. Importância relativa do
índice de massa corporal e da circunferência
abdominal na predição da hipertensão arterial. Rev Saúde Pública. 2007 Out; 41(5):788-96.
12. Pereira ATS, Noronha J, Cordeiro H, Pain S, Pereira TR, Cunha FTS, et al. O uso do prontuário familiar como indicador de qualidade da atenção nas Unidades Básicas de Saúde. Cad Saúde Pública. 2008; 24 (Supl.1):123-33.
13. Jardim ADL, Leal AMO. Qualidade da informação sobre diabéticos e hipertensos no sistema Hiperdia em São Carlos, 2002-2005. Physis Revista de Saúde Coletiva, Rio de Janeiro. 2009 Mar; 19(2):405-417. 14. Instituto Brasileiro de Geograia e Estatística. Censos
demográicos 2010, João Pessoa - PB [site da Internet]. IBGE; 2010 [acesso 2010 Dez 10]. Disponível em:
http://www.ibge.gov.br/cidadesat/painel/painel. php?codmun=250750
15. Ministério da Saúde (BR). Vigilância Alimentar e Nutricional. SISVAN: orientações básicas para coleta, processamento, análise de dados e informações em serviços de saúde. Brasília (DF): MS; 2004.
16. World Health Organization. Obesity: preventing and managing the global epidemic. Report of a
WHO consultation on obesity. Geneva (CH): WHO; 1997 Jun.
17. Ministério da Saúde (BR). Secretaria de Atenção à Saúde. Departamento de Atenção Básica.
Hipertensão arterial sistêmica para o Sistema Único
de Saúde: cadernos de Atenção Básica. Número 15. Brasília (DF): MS; 2006.
18. Harrell Jr. FE. Regression modeling strategies: with applications to linear models, logistic regression and survival analysis. New Yourk (US): Springer-Verlag; 2001.
19. Ministério da Saúde (BR). Conselho Nacional de Saúde, Comissão Nacional de Ética em Pesquisa. Resolução n. 196 de 10 de outubro de 1996: diretrizes e normas regulamentadoras de pesquisa envolvendo seres humanos. Brasília: MS; 1996.
20. Kümpel DA, Sodré AC, Pomatti DM, Moura HS, Filippi J, Portella MR, et al. Obesidade em idosos acompanhados pela Estratégia de Saúde da Família. Texto Contexto Enferm. 2011 Jul-Set; 20(3):271-7. 21. Aio CJ, Costa AC, Santos ZMSA, Soares E. Descrição
dos fatores de risco para alterações cardiovasculares em um grupo de idosos. Texto Contexto Enferm. 2008 Abr-Jun; 17(2):327-35.
22. Nunes LN, Kluck MM, Fachel JM. Uso da imputação de dados faltantes: uma simulação utilizando dados epidemiológicos. Cad Saúde Pública. 2009 Fev; 25(2):268-78.
23. Cabral PC, Melo AMCA, Amado TC, Santos RMAB. Avaliação antropométrica e dietética de hipertensos em ambulatório de um hospital universitário. Rev Nutri. 2003 Jan-Mar; 16(1):61-71.
24. Olinto MTA, Naciel LC, Dias da Costa JS, Gigante DP, Menezes AMB, Macedo S. Níveis de intervenção
para obesidade abdominal: prevalência e fatores
associados. Cad Saúde Pública. 2006 Jun;
2(6):1207-15.
25. Santos DM, Sichieri R. Índice de Massa Corporal e indicadores antropométricos de adiposidade em idosos. Rev Saúde Pública 2005 Out; 39(2):163-8. 26. Jansen I, Baumgarther RN, Ross R, Rosenberg IH,
Roubenoff R. Skeletal muscle cutpoints associated with elevated disability risk in older men and womem. Am J Epidemiol. 2004 Fev; 159(4): 413-21. 27. Yvon AC, Laurence P, Willy JM. n-3 fatty acids and
the metabolic syndrome. Am J Clin Nutr 2006 Jun; 83(Supl. 6):1499S-1504S.
28. Tesser CD. Medicalização social (II): limites biomédicos e propostas para a clínica na atenção básica. Interface Comum Saúde Educ. 2006 Jul-Dez; 10(20):347-62.
29. Saraiva KRO, Santos ZMSA, Landin FLP, Lima HP,
Sena VL. Saber do familiar na adesão da pessoa
30. Hasselmann MH, Faersterin E, Werneck GL, Chor D,
Lopes CS. Associação entre circunferência abdomi -nal e a hipertensão arterial em mulheres: estudo pró-saúde. Cad Saúde Pública. 2008 Mai; 24(5):1187-91. 31. Girotto E, Andrade SM, Cabrera MAS. Prevalência
de obesidade abdominal em hipertensos cadastrados em uma unidade de saúde da família. Arq Bras Cardiol. 2010 Mai; 94(6):754-62.
32. Sposito AC, Caramelli B, Fonseca FAH, Bertolami MC, Afiune Neto A, Souza AD. Sociedade Brasileira de Cardiologia: IV Diretriz brasileira sobre dislipidemias e prevenção da aterosclerose: Departamento de Aterosclerose da Sociedade Brasileira de Cardiologia. Arq Bras Cardiol. 2007 Abr; 88(supl.1):2-19.
Correspondence: Iara Medeiros de Araújo Rua Hermelinda Henrique de Araújo, 105 58051-020 – Bancários, João Pessoa, PB, Brazil E-mail: imedeiros_araujo@yahoo.com.br