Paulo Germano de FriasI,II Célia Landmann SzwarcwaldIII Paulo Roberto Borges de Souza JuniorIII
Wanessa da Silva de AlmeidaIII Pedro Israel Cabral LiraIV
I Programa de Pós-Graduação em Saúde da Criança e do Adolescente. Universidade Federal de Pernambuco. Recife, PE, Brasil II Departamento de Pesquisa. Instituto de
Medicina Integral Prof. Fernando Figueira. Recife, PE, Brasil
III Instituto de Comunicação e Informação Científica e Tecnológica em Saúde. Fundação Oswaldo Cruz. Rio de Janeiro, RJ, Brasil
IV Departamento de Nutrição. Universidade Federal de Pernambuco. Recife, PE, Brasil Correspondence:
Paulo Germano de Frias
Instituto de Medicina Integral Prof. Fernando Figueira
Rua dos Coelhos, 300 Coelhos 50060-570 Recife, PE, Brasil E-mail: [email protected] Received: 3/18/2013 Approved: 7/30/2013
Article available from: www.scielo.br/rsp
Correcting vital information:
estimating infant mortality,
Brazil, 2000-2009
ABSTRACT
OBJECTIVE: To propose a simpliied method of correcting vital information and estimating the coeficient of infant mortality in Brazil.
METHODS:Vital data in the information systems on mortality and live births were corrected using correction factors, estimated based on events not reported to the Brazilian Ministry of Health and obtained by active search. This simpliied method for correcting vital information for the period 2000-2009 for Brazil and its federal units establishes the level of adequacy of information on deaths and live births by calculating the overall coeficient of mortality standardized by age and the ratio between reported and expected live births, respectively, in each Brazilian municipality. By applying correction factors to the number of deaths and live births reported in each county, the vital statistics were corrected, making it possible to estimate the coeficient of infant mortality.
RESULTS: The highest correction factors were related to infant deaths, reaching values higher than 7 for municipalities with very precarious mortality information. For deaths and live births, the correction factors exhibit a decreasing gradient as indicators of adequacy of the vital information improve. For the year 2008, the vital information corrected by the simpliied method per state were similar to those obtained in the research of active search. Both the birth rate and the infant mortality rate decreased in the period in all Brazilian regions. In the Northeast, the annual rate of decline was 6.0%, the highest in Brazil (4.7%).
CONCLUSIONS: The active search of deaths and births allowed correction factors to be calculated by level of adequacy of mortality information and live births. The simpliied method proposed here allowed vital information to be corrected per state for the period 2000-2009 and the progress of the coeficient of infant mortality in Brazil, its regions and states to be assessed.
2 Infant mortality in Brazil Frias PG et al
The Brazilian Institute of Geography and Statistics (IBGE) is responsible for processing the data from civil records in Brazil, including births and deaths.15 Limitations related to coverage of information on deaths and the lack of variables relevant to tracking epidemiological proiles of mortality gave rise to the establishment of the Brazilian Ministry of Health (MH) Mortality Information Reporting System (SIM) in 1976. Years later, in 1992, the MH developed a system of registering live births (SINASC), due to the need for data on birth and delivery conditions, until then inex-istent at a national level.12
The MH and the state and municipal health departments developed strategies for consolidating vital information through coordinated initiatives that involved producing, distributing and controlling recording forms, as well as collecting, processing and disseminating the data.17
Actions were adopted to broaden the capture of vital information and to reduce the percentage of deaths from undetermined underlying causes, including goals related to coverage of information on mortality in the Agreed and Implemented Program.9
A committee to monitor mortality dataa has been recently created to improve and regulate the low of information. Commissions were also set up to investi-gate infant deaths in various municipalities,14
contrib-uting to improvements in data recording.
Advances in the decentralization process of health care actions and establishing health care agreements between the three managerial spheres (federal, state and municipal) encourage the increased demand for data that could evaluate programs aimed at reducing infant mortality.9 Systems of vital information have
become more relevant, and diverse assessments of the SIM and SINASC5,8 have taken place, highlighting
aspects to prioritize in interventions aiming to improve quantitative and qualitative data.1,10
Among the research methods adopted to assess the coverage of vital information systems, actively searching for events proved to be a promising strategy for identifying cases not captured by the systems. There were two principle aims for which this took place: to understand the process involved in producing infor-mation in locations with precarious data;4,6 and due to
the incoherence of trends in infant mortality and SIM coverage. These trends are obtained using indirect INTRODUCTION
demographic techniques,13,19 incompatible with
invest-ments made in reducing infant mortality and improving vital information systems.16
Research on the active search for infant deaths took place in clusters of municipalities located in states in 2000, with a great deicit of vital information. In addition to identifying deaths not reported in the system, it was also possible to map SIM operational problems in the local area.7 SIM coverage had increased in the majority
of clusters studied, years after the research took place.7
The need to assess the criteria used in analyzing coverage and regulation of MH vital statistics1 and to investigate temporal evolution of infant mortality in regions with precarious vital information resulted in a wider study being developed. This research involved actively searching for births and deaths in a probabi-listic sample of municipalities, stratiied by population size, adequacy of vital information and region.b
The study, called the Active Search for Births and Deaths in the Northeast and Amazonia, took place between 2009 and 2010, and aimed to assess the coverage of vital information systems in 2008, as well as to estimate correction factors for mortality indicators through using MH vital information.b,c SIM coverage
in Brazil was estimated to be 93.0%, and SINASC coverage to be 95.6%. The coverage for infant deaths was lower (81.6%) and showed notable inequalities between regions, varying from 61.6% to 83.0% in states in the Amazon and the Northeast and reaching almost 100.0% in the South and Southeast.b
The consistency of the results obtained in estimating coverage of the information systems, with coverage decreasing as levels of adequate vital information worsened,c raised the possibility of using correction
factors obtained in the active search to correct vital information for recent years. This work aimed to propose a simpliied method for correcting MH vital information and estimating the coeficient of infant mortality in Brazil.
METHODS
Based on the results found in the active search for births and deaths in the Northeast and the Amazon region,a a method was proposed for correcting SIM
a Ministério da Saúde. Secretaria de Vigilância em Saúde. Painel de monitoramento da mortalidade infantil e fetal. Brasília (DF); 2013 [cited 2013 Nov 22]. Available from: http://svs.aids.gov.br/dashboard/mortalidade/infantil.show.mtw
b Szwarcwald CL, Morais Neto OL, Frias PG, Souza Jr PRB, Escalante JJC, Lima RB, et al. Busca ativa de óbitos e nascimentos no Nordeste e na Amazônia Legal: estimação das coberturas do SIM e do Sinasc nos municípios brasileiros. In: Mnistério da Saúde. Saúde Brasil 2011: Uma análise da situação de saúde (DF); 2011. p. 79-97.
and SINASC data in order to estimate the coeficient of infant mortality (CIM) per state for 2000 to 2009. The research took place between September 2009 and June 2010. A probabilistic sample of 133 municipali-ties was selected, stratiied by region (Amazon region; Northeast), by population (one to 20,000 inhabitants; 20,001 to 50,000 inhabitants; 50,001 to 200,000 inhabit-ants; more than 200,000 inhabitants) and by adequacy of vital information (non-consolidated information; in the process of consolidation; consolidated), making 24 strata. Four or ive municipalities were randomly selected from each strata. All state capitals were included.
An active search for births and deaths in 2008 took place in the selected municipalities in order to identify birth (BC) and death certiicates (DC) that had been issued but not reported to SINASC or SIM, respec-tively, and live births (LB) and deaths for which BCs and DCs were not issued. The MH/Department of Health Monitoring provided a nominal list of all LB and deaths that occurred in the selected municipalities in 2008. This nominal list was drawn up based on births and deaths reported to SINASC, SIM and the Hospital Information Systems (SIH). The data collected during the active search process were used to complete the original nominal lists of deaths and live births. The following sources of data were used: notaries, secretaries from social action programs (Register of Federal Government Social Programs – Programa
Bolsa Família; burial support; clothing support);
hospitals, health care centers; the Coroners service and the Forensic Institute; patient transport services (ambulances, mobile emergency care service (SAMU) and the ire brigade); oficial and non-oficial cemeteries (burial places); funeral homes; police stations; tradi-tional midwives; churches and pharmacies. In each municipality of the sample and in neighboring munici-palities, notaries and hospitals where births and deaths from the municipality in question had been registered were investigated. Births and deaths found in the active search with no record in the notaries or primary health care units were conirmed by the household.
The overall standardized mortality rate (OSMR) per age was calculated for the population of Brazil, for the same year, as a standard characterizing the adequacy of data on deaths. The OSMR were grouped into categories (≥ 1 and < 2; ≥ 2 and < 3; ≥ 3 and < 4; ≥ 4 and < 5; ≥ 5 and < 5,5; ≥ 5,5 per 1,000 inhabitants), in each state. Correction factors were estimated for each state according to category of OSMR, calculated using the ratio between the sum of deaths corrected for the active search processb,c and the sum of deaths reported. Deaths
in those aged under and those aged over one year were considered separately.
The OSMR was estimated for all Brazilian municipali-ties by generalizing the process of correcting deaths reported to the SIM per state from 2000 to 2009. The populations of the municipalities were estimated by age group (in years: < 1; 1 to 4; 5 to 9; 10 to 14; 15 to 19; 20 to 29; 30 to 39; 40 to 39; 50 to 59; 60 to 69; 70 and over) and by year of the period in question. Total populations and age distributions of the municipalities, per year, were obtained by interpolating between census populations from 2000 and 2010 and the respective proportions per age group.
Deaths reported in the three-year-period corresponding to each year were considered to provide the estimates with more stability, i.e., the means of reported deaths per age group were calculated for the three-year-periods 1999 to 2001, 2000 to 2002, 2001 to 2003, 2002 to 2004, 2003 to 2005, 2004 to 2006, 2005 to 2007, 2006 to 2008, 2007 to 2009 and 2008 to 2010. Deaths for which the municipality was unknown were redistributed proportionally between the municipalities in the same state, and those for which the age was unknown were redistributed proportionally between those for which the ages were known, per three-year-period.
The Brazilian municipalities were classiied by level of adequacy of mortality data, according to OSMR category in order to generalize the correction procedures for infant deaths between 2000 and 2009 in each three-year-period. Reported deaths in those aged under one year in all Brazilian municipalities in the period, were corrected by the corresponding correction factors estimated in each state. The correction factors were kept constant per OSMR category, but not per municipality. In other words, if there was better coverage of mortality informa-tion in a speciic municipality throughout the period, the lowest correction factor would be applied as it passed into another OSMR category. The corrected number of deaths per state, per year of the period, were obtained by summing corrected deaths for the municipalities in that state.
Similarly, in order to estimate correction factors for live births (LB), the municipalities were grouped per state and level of adequacy in LB data, shown by the ratio (LBR) between reported and expected LB, calculated using the estimated population aged under one year.d
When calculating the indicator, the mean of LB reported per three-year-period (1999-2001 to 2008-2010). For the three-year-period corresponding to 2008, the sampled municipalities in the active search project were grouped into categories (< 0.5; ≥ 0.5 and < 0.6; ≥ 0.6 and < 0.7; ≥ 0.7 and < 0.8; ≥ 0.8 and < 0.9; ≥ 0.9). The LB correction
4 Infant mortality in Brazil Frias PG et al
factors per level of adequate LB data were estimated using corrected LB data from the active search process of vital events.
The LB corrections factors per state and level of adequate LB data in 2008 were estimated using the ratio between the sum of LB corrected using the active search process and the sum of LB reported in each category. LB reported to SINASC (in the corresponding three-year-period) were corrected using the corresponding correction factors of each state and the level of adequacy of LB data for each year of the 2000 to 2009 period. The correction factors for LB were estimated per LBR category. Therefore, if there was an improvement in LB information coverage in a speciic municipality during that period, the lower correction factor would be applied as it would pass into another LBR category. The corrected number of LB per state and per year was obtained by summing corrected LB for the municipali-ties of that state.
The corrected numbers for infant deaths and live births obtained for each municipality in each three-year-period were used to estimate the CIM per state between 2000
and 2010. Additional adjustments were necessary at the municipal level. When no infant deaths were reported to the SIM, the corrected number of infant deaths should remain at zero, regardless of the correction factor, which could lead to underestimating the CIM.
Minimum limits for the CIM were estimated for each region for each year analyzed, based on log-normal distribution corrected for the municipalities of the region. The expected number of infant deaths in each municipality was obtained, multiplying the minimum limit of the CIM by the number of corrected LB. When the corrected number of infant deaths was equal to or greater than the minimum number, no additional corrections were performed. When the corrected number was below the minimum number in at least one unit, the municipalities were classiied according to the adequacy of vital information. For the adequate vital information (OSMR ≥ 5.5 and LBR ≥ 0.9), no complementary corrections were performed. Of those municipalities with inadequate vital information, the corrected number of infant deaths were estimated by the mean CIM for the state multiplied by the corrected number of LB in the municipality.
Table 1. Synthesis of procedures for estimating the Coefficient of Infant Mortality per state. Brazil, 2000 to 2009. Correction of reported infant deaths
1. Estimate OSMR in all Brazilian municipalities for the three-year-period 2007-2009;
2. Calculate correction factors for state and categorize the OSMR (≥ 1 and < 2; ≥ 2 and < 3; ≥ 3 and < 4; ≥ 4 and < 5;
≥ 5 and < 5.5; ≥ 5.5 per 1,000 inhabitants) using death data corrected by active search and reported to the SIM; 3. Estimate the OSMR for all Brazilian municipalities, for each three-year-period between 2000-2009;
4. Classify all Brazilian municipalities per state and categorize the OSMR, for each three-year-period 2000-2009; 5. Apply the corresponding correction factors to infant deaths in all Brazilian municipalities, according to the state and
OSMR category;
6. Obtain the corrected number of infant deaths per state and three-year-period for 2000-2009 by summing the corrected infant deaths in the state municipalities.
Correction of reported live births
1. Estimate LBR in all Brazilian municipalities for the three-year-period 2007-2009;
2. Calculate correction factors for state and categorize the LBR (< 0.5; ≥ 0.5 and < 0.6; ≥ 0.6 and < 0.7; ≥ 0.7 and < 0.8;
≥ 0.8 and < 0.9; ≥ 0.9) using LB data corrected by active search and reported to SINASC; 3. Estimate the LBR for all Brazilian municipalities, for each three-year-period between 2000-2009;
4. Classify all Brazilian municipalities per state and categorize the LBR, for each three-year-period 2000-2009;
5. Apply the corresponding correction factors to LB in all Brazilian municipalities, according to the state and LBR category; 6. Obtain the corrected number of LB per state and three-year-period for 2000-2009 by summing the corrected LB in the
state municipalities. Estimating CIM
1. Estimate CIM using the corrected number of infant deaths and live births obtained per municipality for each three-year-period, in all municipalities in which the reported number of infant deaths was greater than zero;
2. Obtain the minimum limits of the CIM for each region considered in the study, per year of analysis, based on the corrected log-normal distribution of the CIM for the municipalities of the region;
3. For those municipalities in which the corrected number of infant deaths remains below the expected minimum in at least one unit, and the vital information for the municipality are deemed inadequate (OSMR < 5.5 or LBR < 0.9), the corrected number of infant deaths was estimated using the mean CIM for the state, multiplied by the corrected number of LB in the municipality.
5 State
Correction factor for deaths in those aged under 1 year old Correction factor for deaths in those aged 1 year old and over Correction factor for live births
OSMR category OSMR category LBR category
1 to 2 2 to 3 3 to 4 4 to 5 5 to 5.5 5.5 and over 1 to 2 2 to 3 3 to 4 4 to 5 5 to 5.5 5.5 and over 0.5 to 0.6 0.6 to 0.7 0.7 to 0.8 0.8 to 0.9 0,9 and over
Rondônia 7.36 3.88 3.16 1.55 1.31 1.02 2.71 1.79 1.40 1.23 1.20 1.03 1.64 1.31 1.22 1.17 1.06
Acre 7.45 3.07 2.54 1.46 1.32 1.06 2.78 2.30 1.14 1.15 1.18 1.05 1.79 1.62 1.20 1.15 1.12
Amazonas 7.31 2.95 2.28 1.40 1.20 1.05 3.21 2.08 1.52 1.28 1.09 1.06 1.60 1.36 1.18 1.11 1.05
Roraima 7.23 3.43 2.08 1.60 1.49 1.07 2.84 1.94 1.57 1.27 1.11 1.06 1.76 1.40 1.22 1.15 1.09
Pará 7.00 2.58 1.94 1.41 1.09 1.05 2.10 2.31 1.63 1.27 1.14 1.07 1.78 1.42 1.21 1.06 1.04
Amapá 7.09 3.37 2.17 1.59 1.25 1.03 2.99 1.80 1.43 1.27 1.10 1.08 1.70 1.36 1.29 1.07 1.06
Tocantins 7.40 4.32 2.75 1.86 1.25 1.14 2.78 1.84 1.39 1.14 1.17 1.09 1.43 1.21 1.17 1.12 1.07
Maranhão 7.28 3.43 2.06 1.49 1.27 1.05 3.13 2.07 1.59 1.29 1.12 1.06 1.86 1.57 1.19 1.16 1.06
Piauí 7.25 3.59 2.03 1.40 1.18 1.14 2.73 1.70 1.33 1.17 1.12 1.08 1.76 1.33 1.13 1.08 1.06
Ceará 7.28 3.63 2.03 1.48 1.27 1.11 2.72 1.96 1.37 1.20 1.11 1.07 1.78 1.34 1.20 1.08 1.05
Rio Grande do Norte 7.07 2.91 2.48 1.78 1.25 1.06 2.70 2.05 1.42 1.21 1.11 1.09 1.78 1.26 1.13 1.07 1.05
Paraíba 7.07 3.50 2.58 1.62 1.24 1.14 2.72 1.75 1.38 1.17 1.11 1.06 1.66 1.38 1.13 1.09 1.04
Pernambuco 7.33 3.62 2.32 1.35 1.19 1.14 2.77 1.88 1.45 1.17 1.10 1.06 1.91 1.33 1.18 1.07 1.04
Alagoas 7.22 3.66 2.56 1.38 1.26 1.09 2.80 2.06 1.45 1.24 1.13 1.06 1.70 1.50 1.16 1.09 1.06
Sergipe 7.17 3.59 2.30 1.36 1.30 1.16 2.76 1.88 1.49 1.16 1.11 1.07 1.66 1.43 1.12 1.05 1.04
Bahia 7.20 3.59 1.81 1.42 1.24 1.08 2.73 2.03 1.51 1.26 1.11 1.07 1.54 1.35 1.17 1.07 1.06
Minas Gerais 7.59 4.56 2.16 1.53 1.20 1.16 2.97 1.99 1.45 1.17 1.11 1.08 1.71 1.33 1.14 1.06 1.01
Mato Grosso 8.08 3.86 2.56 1.80 1.48 1.18 2.59 1.75 1.29 1.16 1.03 1.06 1.39 1.22 1.11 1.09 1.00
Goiás 8.11 3.69 2.48 1.90 1.24 1.17 2.18 1.94 1.34 1.19 1.13 1.07 1.69 1.49 1.23 1.12 1.01
6 Infant mortality in Brazil Frias PG et al
After correcting the data for the municipalities, the CIM per state was calculated by the ratio between the sum of corrected infant deaths and the sum of corrected LB in the municipalities of the state (Table 1). The birth rate was estimated using the ratio between the corrected number of LB and the estimated population per year of the period. The project was approved by the Committee of Ethics and Research in Human Beings of the Pernambucan Society for Combatting Cancer (Record no. 15/2011 on 14/6/2011).
RESULTS
The correction factors for LB and deaths of those aged under and over one year varied according to the level of adequacy of the vital information in the state in 2008 and showed a gradient which increased as the complete-ness of the vital data systems worsened. No signiicant differences were found between the correction factors for LB and deaths in the state. However, they were
systematically lower for births and higher for deaths, especially for infant deaths. The correction factors for deaths in those aged under one year old exceeded 7.0 in all states when the OSMR was < 2, i.e., worse levels of adequacy of mortality information (Table 2). The Active Search of 2008 and the simpliied method showed similar results for corrected LB and deaths with inexpressive luctuations in estimates of CIM per state (Table 3).
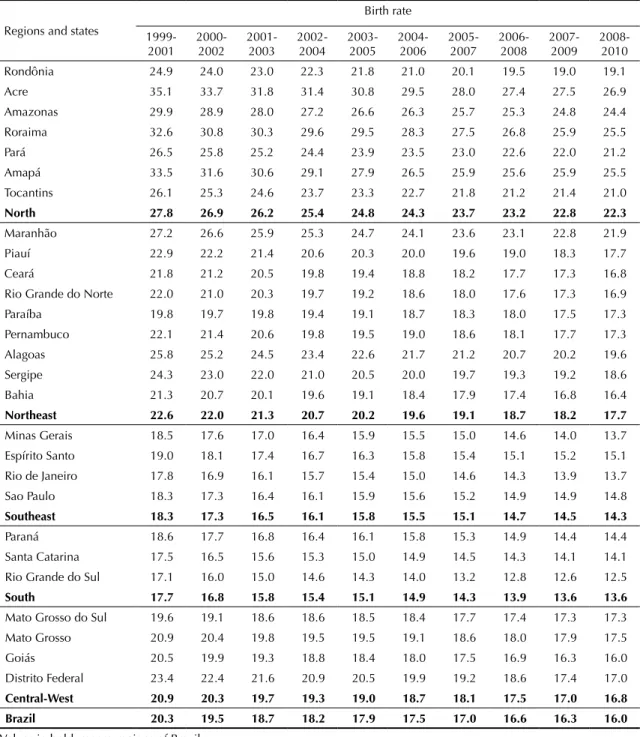
The behavior of the birth rate was presented by region and by state, from 2000 to 2009. There was a marked decrease in the birth rate for the country and in the regions over the ten years. The rate for Brazil went from 20.3/1,000 inhabitants in 2000 to 16.0 in 2009. Greater decreases occurred in the North and lower in the South (from 27.8 to 22.3/1,000 inhabitants), but in the North, the values remained above those found at the beginning of the decade in the South (17.7), Southeast (18.3) and Midwest (20.3) (Table 4).
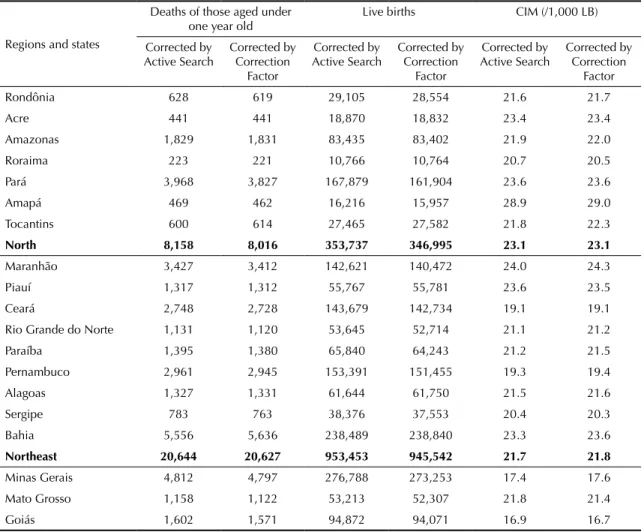
Table 3. Number of deaths in those aged under one year, of live births and the coefficient of infant mortality (/1,000 LB) corrected in the active search and using the simplified method. States with complete and incomplete vital information. Brazil, 2008.
Regions and states
Deaths of those aged under
one year old Live births CIM (/1,000 LB) Corrected by
Active Search
Corrected by Correction
Factor
Corrected by Active Search
Corrected by Correction
Factor
Corrected by Active Search
Corrected by Correction
Factor
Rondônia 628 619 29,105 28,554 21.6 21.7
Acre 441 441 18,870 18,832 23.4 23.4
Amazonas 1,829 1,831 83,435 83,402 21.9 22.0
Roraima 223 221 10,766 10,764 20.7 20.5
Pará 3,968 3,827 167,879 161,904 23.6 23.6
Amapá 469 462 16,216 15,957 28.9 29.0
Tocantins 600 614 27,465 27,582 21.8 22.3
North 8,158 8,016 353,737 346,995 23.1 23.1
Maranhão 3,427 3,412 142,621 140,472 24.0 24.3
Piauí 1,317 1,312 55,767 55,781 23.6 23.5
Ceará 2,748 2,728 143,679 142,734 19.1 19.1
Rio Grande do Norte 1,131 1,120 53,645 52,714 21.1 21.2
Paraíba 1,395 1,380 65,840 64,243 21.2 21.5
Pernambuco 2,961 2,945 153,391 151,455 19.3 19.4
Alagoas 1,327 1,331 61,644 61,750 21.5 21.6
Sergipe 783 763 38,376 37,553 20.4 20.3
Bahia 5,556 5,636 238,489 238,840 23.3 23.6
Northeast 20,644 20,627 953,453 945,542 21.7 21.8
Minas Gerais 4,812 4,797 276,788 273,253 17.4 17.6
Mato Grosso 1,158 1,122 53,213 52,307 21.8 21.4
Goiás 1,602 1,571 94,872 94,071 16.9 16.7
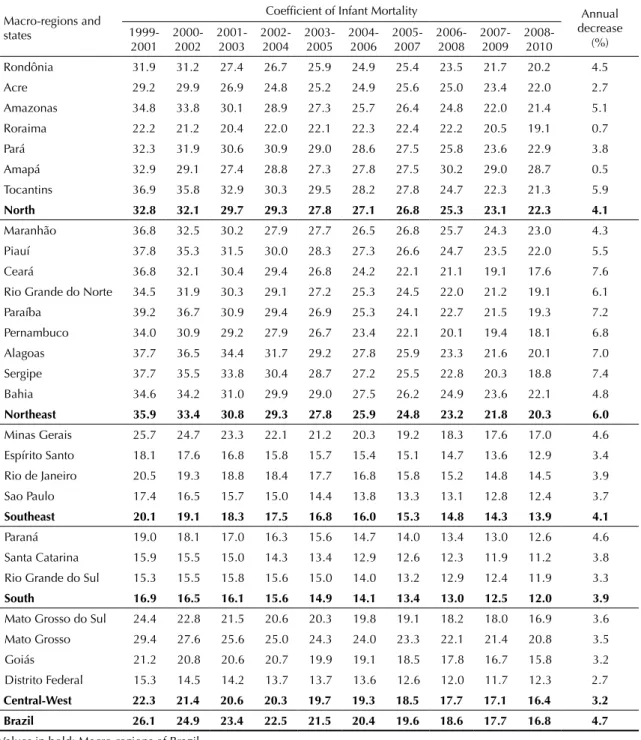
There was a marked reduction in the CIM in all states and regions in the period. The rate of annual percentage decrease in the period was 4.7% for Brazil, being most signiicant in the Northeast (6.0%) and least in the Midwest (3.2%). The South kept the lowest CIM values throughout the decade.
The unequal rates of annual reductions between the Brazilian regions were observed among the states in the same region. In the North, whereas Amapá and Roraima had annual reductions in CIM of less than 1.0%,
Amazonas and Tocantins exceeded the mean national reduction. In the Northeast, the state of Maranhão showed a trend to decrease that was below the national mean, whereas the decrease was above 6.0% in Ceará, Sergipe, Paraíba, Alagoas, Pernambuco and Rio Grande do Norte, contributing to the better performance of the Northeast among the regions. The Southeast had rates of decrease similar to that of the North (4.1%), although differences between the states were considerable less (varying between 3.4% in Espírito Santo and 4.6% in Minas Gerais) (Table 5).
Table 4. Birth rates (/1,000 inhabitants) estimated after correcting live births. Brazilian states and regions. Brazil, 2000 to 2009.
Regions and states
Birth rate
1999-2001 2000-2002 2001-2003 2002-2004 2003-2005 2004-2006 2005-2007 2006-2008 2007-2009 2008-2010 Rondônia 24.9 24.0 23.0 22.3 21.8 21.0 20.1 19.5 19.0 19.1
Acre 35.1 33.7 31.8 31.4 30.8 29.5 28.0 27.4 27.5 26.9
Amazonas 29.9 28.9 28.0 27.2 26.6 26.3 25.7 25.3 24.8 24.4 Roraima 32.6 30.8 30.3 29.6 29.5 28.3 27.5 26.8 25.9 25.5
Pará 26.5 25.8 25.2 24.4 23.9 23.5 23.0 22.6 22.0 21.2
Amapá 33.5 31.6 30.6 29.1 27.9 26.5 25.9 25.6 25.9 25.5
Tocantins 26.1 25.3 24.6 23.7 23.3 22.7 21.8 21.2 21.4 21.0
North 27.8 26.9 26.2 25.4 24.8 24.3 23.7 23.2 22.8 22.3
Maranhão 27.2 26.6 25.9 25.3 24.7 24.1 23.6 23.1 22.8 21.9
Piauí 22.9 22.2 21.4 20.6 20.3 20.0 19.6 19.0 18.3 17.7
Ceará 21.8 21.2 20.5 19.8 19.4 18.8 18.2 17.7 17.3 16.8
Rio Grande do Norte 22.0 21.0 20.3 19.7 19.2 18.6 18.0 17.6 17.3 16.9 Paraíba 19.8 19.7 19.8 19.4 19.1 18.7 18.3 18.0 17.5 17.3 Pernambuco 22.1 21.4 20.6 19.8 19.5 19.0 18.6 18.1 17.7 17.3 Alagoas 25.8 25.2 24.5 23.4 22.6 21.7 21.2 20.7 20.2 19.6 Sergipe 24.3 23.0 22.0 21.0 20.5 20.0 19.7 19.3 19.2 18.6
Bahia 21.3 20.7 20.1 19.6 19.1 18.4 17.9 17.4 16.8 16.4
Northeast 22.6 22.0 21.3 20.7 20.2 19.6 19.1 18.7 18.2 17.7 Minas Gerais 18.5 17.6 17.0 16.4 15.9 15.5 15.0 14.6 14.0 13.7 Espírito Santo 19.0 18.1 17.4 16.7 16.3 15.8 15.4 15.1 15.2 15.1 Rio de Janeiro 17.8 16.9 16.1 15.7 15.4 15.0 14.6 14.3 13.9 13.7 Sao Paulo 18.3 17.3 16.4 16.1 15.9 15.6 15.2 14.9 14.9 14.8 Southeast 18.3 17.3 16.5 16.1 15.8 15.5 15.1 14.7 14.5 14.3
Paraná 18.6 17.7 16.8 16.4 16.1 15.8 15.3 14.9 14.4 14.4
Santa Catarina 17.5 16.5 15.6 15.3 15.0 14.9 14.5 14.3 14.1 14.1 Rio Grande do Sul 17.1 16.0 15.0 14.6 14.3 14.0 13.2 12.8 12.6 12.5
South 17.7 16.8 15.8 15.4 15.1 14.9 14.3 13.9 13.6 13.6
Mato Grosso do Sul 19.6 19.1 18.6 18.6 18.5 18.4 17.7 17.4 17.3 17.3 Mato Grosso 20.9 20.4 19.8 19.5 19.5 19.1 18.6 18.0 17.9 17.5
Goiás 20.5 19.9 19.3 18.8 18.4 18.0 17.5 16.9 16.3 16.0
Distrito Federal 23.4 22.4 21.6 20.9 20.5 19.9 19.2 18.6 17.4 17.0 Central-West 20.9 20.3 19.7 19.3 19.0 18.7 18.1 17.5 17.0 16.8
Brazil 20.3 19.5 18.7 18.2 17.9 17.5 17.0 16.6 16.3 16.0
8 Infant mortality in Brazil Frias PG et al
DISCUSSION
The indings are coherent when compared with the results obtained in the active search research in 2008.
After correcting the LB, the birth rate showed a trend to decrease in all states and regions, although at different intensities. Studies on fecundity in Brazil indicate marked changes in the country,3 although indirect estimates indicate lower reductions.
There was a rate of decrease of 4.7%/year in the CIM, with greater intensity in the region that has recognizably the most precarious living conditions. The annual rate of decrease in the Northeast was 6.0% per year, prob-ably due to public interventions focused on the most vulnerable population groups and on socioeconomic development in the region, prompted by inclusive public policies.18 The different intensities of reduced
CIM in Brazil and the regions shows the success in the decline of regional inequalities.
Table 5. Coefficients of Infant Mortality (/1,000 LB) estimated after correction of vital statistics. Brazilian macro-regions and states. Brazil, 2000 to 2009.
Macro-regions and states
Coefficient of Infant Mortality Annual decrease
(%)
1999-2001 2000-2002 2001-2003 2002-2004 2003-2005 2004-2006 2005-2007 2006-2008 2007-2009 2008-2010
Large groups of the vulnerable population beneitted from SUS actions and programs, in particular those focusing on care for mothers and babies as well as those of the state and municipal programs. The beneits from interventions such as antenatal care and hospital-ization for births, immunhospital-ization programs, promoting breastfeeding, among others18 are indisputable. The
Family Health Care Program, which groups together all programs with activities in primary care, was one of the protagonists in the success in the decreasing infant mortality rate, when high coverage was achieved.2,11
The advances made in Brazil in reducing infant mortality2 are indisputable. The country is one the way
to reaching the fourth millennium goal if the trends seen in 2000 to 2009 are maintained. However, inequalities remain between regions and states, with a signiicant social debt and serious problems in delivering care.18
Infant mortality in the North and Northeast in the last year of the time series in question (2009) were greater than the rates shown in the states in the South in 2000. The method proposed here are easy to apply: it is suficient to classify the municipality according to the level of adequacy of the vital information in each state. Variations in the correction factors as the munici-palities have improving or worsening coverage of vital information enables the methodology to be used in the long term, without need for complementary research to update the estimates. Correcting the mean data per three-year-period guarantees more stability in indicators
of adequacy of vital information and in estimating birth rates and infant mortality.
10 Infant mortality in Brazil Frias PG et al
1. Andrade CLT, Szwarcwald CL. Desigualdades sócio-espaciais da adequação das informações de nascimentos e óbitos do Ministério da Saúde, Brasil, 2000-2002. Cad Saude Publica. 2007;23(5):1207-16. DOI:10.1590/S0102-311X2007000500022
2. Aquino R, Oliveira NF, Barreto ML. Impact of the family health programon infant mortality in Brazilian municipalities. Am J Public Health. 2009;99(1):87-93. DOI:10.2105/AJPH.2007.127480
3. Berquó E, Cavenaghi S. Fecundidade em declínio: breve nota sobre a redução no número médio de filhos por mulher no Brasil. Novos Estud CEBRAP. 2006;(74):11-5. DOI:10.1590/S0101-33002006000100001 4. Campos D, França E, Loschi RH, Souza MFM.
Uso da autópsia verbal na investigação de óbitos com causa mal definida em Minas Gerais, Brasil. Cad Saude Publica. 2010;26(6):1221-33. DOI:10.1590/S0102-311X2010000600015 5. Drumond EF, Machado CJ, França E. Subnotificação
de nascidos vivos: procedimentos de mensuração a partir do Sistema de Informação Hospitalar. Rev Saude Publica 2008;42(1):55-63. DOI:10.1590/S0034-89102008000100008 6. Frias PG, Vidal AS, Pereira PMH, Lira PIC, Vanderlei
LC. Avaliação da notificação de óbitos infantis ao Sistema de Informação sobre Mortalidade: um estudo de caso. Rev Bras Saude Matern Infant. 2005:5 Suppl 1:43-51. DOI:10.1590/S1519-38292005000500005 7. Frias PG, Pereira PMH, Andrade CLT, Szwarcwald
CL. Sistema de Informações sobre Mortalidade: estudo de caso em municípios com precariedade dos dados. Cad Saude Publica. 2008;24(10):2257-66. DOI:10.1590/S0102-311X2008001000007 8. Frias PG, Pereira PMH, Andrade CLT, Lira
PIC, Szwarcwald CL. Avaliação da adequação das informações de mortalidade e nascidos vivos no Estado de Pernambuco, Brasil. Cad Saude Publica. 2010;26(4):671-81. DOI:10.1590/S0102-311X2010000400010 9. Frias PG, Szwarcwald CL, Lira PIC. Estimação da
mortalidade infantil no contexto de descentralização do Sistema Único de Saúde (SUS). Rev Bras Saude Matern Infant. 2011;11(4):463-70. DOI:10.1590/S1519-38292011000400013 10. Lima CR, Schramm JMA, Coeli CM, Silva
MEM. Revisão das dimensões de qualidade
dos dados e métodos aplicados na avaliação dos sistemas de informação em saúde. Cad Saude Publica. 2009;25(10):2095-109. DOI:10.1590/S0102-311X2009001000002 11. Macinko J, Souza MFM, Guanais FC, Simoes
CCS. Going to scale with community-based primary care: An analysis of the family health program and infant mortality in Brazil, 1999-2004.Soc Sci Med. 2007;65(10):2070-80. DOI:10.1016/j.socscimed.2007.06.028
12. Mello Jorge MHP, Laurenti R, Gotlieb SLD. Análise da qualidade das estatísticas vitais brasileiras: a experiência de implantação do SIM e do SINASC. Cienc Saude Coletiva. 2007;12(3):643-54. DOI:10.1590/S1413-81232007000300014
13. Murray, CJ, Rajaratnam JK, Marcus J, Laakso T, Lopez AD. What can we conclude from death registration? Improved methods for evaluating completeness. PLoS Med, Apr 13;7(4):e1000262. 2010
14. Santana M, Aquino R, Medina MG. Effect of the Family Health Strategy on surveillance of infant mortality. Rev Saude Publica. 2012;46(1):59-67. DOI:10.1590/S0034-89102011005000081
15. Silveira MH,Laurenti R. Os eventos vitais: aspectos de seus registros e inter-relações da legislação vigente com as estatísticas de saúde. Rev Saude Publica. 1973;7(1):37-50. DOI:10.1590/S0034-89101973000100004
16. Szwarcwald CL, Andrade CLT, Souza Jr PRB. Estimação da mortalidade infantil no Brasil: o que dizem as informações sobre óbitos e nascimentos do Ministério da Saúde? Cad Saude Publica. 2002;18(6):1725-36. DOI:10.1590/S0102-311X2002000600027 17. Szwarcwald CL. Strategies for improving the
monitoring of vital events in Brazil. Int J Epidemiol. 2008;37(4):738-44.
18. Victora CG, Aquino EM, Leal MC, Monteiro CA, Barros FC, Szwarcwald CL. Maternal and child health in Brazil: progress and challenges. Lancet. 2011;377(9780):1863-76. DOI:10.1016/S0140-6736(11)60138-4
19. Iswanathan K, Becker S, Hansen PM, Kumar D, Kumar B, Niayesh H, et al. Infant and under-five mortality in Afghanistan: current estimates and limitations. Bull World Health Organ. 2010;88(8):576-83. DOI:10.2471/BLT.09.068957 REFERENCES
This study was supported by the Ministry of Health Department of Health Surveillance (Process no. 25000.572113/20). Article based on the doctoral thesis of Frias P.G., entitled: “Adequação das informações sobre nascidos vivos e óbitos e a estimação da mortalidade infantil no Brasil”, presented to the Post-Graduate Program in Child and Adolescent, Universidade Federal de Pernambuco, in 2013.