AbstrAct: The study aimed at identifying explanatory factors of the mortality rate of elderly men due to cardiovascular diseases in the 187 micro regions of Northeast Brazil, in 2000, based on indicators of life conditions and vulnerability of that population, using the structural equations modeling. The following methodological steps were taken: (1) using Censo 2000’s microdata, 10 indicators were selected to the latent exogenous construct ‘life conditions and vulnerability’. Using the Information System of Mortality from the Brazilian Ministry of Health, data about deaths from the four major basic causes of cardiovascular diseases were collected, which composed the endogenous latent construct as the outcome variable; (2) qualitative analysis of mortality data; (3) statistical analysis using the structural equation modeling through two phases: adjustment of the outcome variables measurement model and adjustment of the obtained structural model. Due to the multicollinearity observed, three indicators showed signiicance for the measurement model: years of study, percentage of elderly men in households with bathroom/plumbing and survival probability at 60 years of age. The structural model indicated adjustment adequacy of the model, which the measurement of standardized coeicient was considered of strong efect (SC = 0.81, p-value < 0.01) and coeicient of determination r2 = 66%. It was concluded that indicators of life conditions and vulnerability were highly associated with the mortality rate from cardiovascular diseases in elderly men from Northeast Brazil in 2000.
Keywords: Mortality. Causality. Cardiovascular diseases. Aged. Social conditions.
Association between life conditions and
vulnerability with mortality from cardiovascular
diseases in elderly men of Northeast Brazil
Associação entre condições de vida e vulnerabilidade com a mortalidade por
doenças cardiovasculares de homens idosos do nordeste
Jozemar Pereira dos SantosI, Neir Antunes PaesII
IPostgraduate Program in Health Sciences of Universidade Federal do Rio Grande do Norte – Natal (RN), Brazil.
IIPostgraduate Program in Decision and Health Models of the Statistics Department of Universidade Federal da Paraíba –
João Pessoa (PB), Brazil.
Corresponding author: Jozemar Pereira dos Santos. Rua Professora Maria Sales, 833, Apartamento 202, Tambaú, CEP: 58039-130, João Pessoa, PB, Brasil. E-mail: [email protected]
Conlict of interests: nothing to declare – Financing source: National Council for Scientiic and Technological Research (CNPq),
IntroductIon
Epidemiological transition refers to long term changes in the patterns of morbidity, invalidity and death that characterize a specific population and that, in general occur together with other demographic, social and economic changes. It involves the substitution, among the first causes of deaths, of transmitted diseases for non-transmitted diseases and external causes; the dislocation of the higher morbimortality load from younger groups to older groups; and also the transformation from a situation in which mortality prevails to another one, in which morbidity is dominant1. There is
also a narrow relationship between the processes of demographic and epidemiological transition. It is possible to observe that the initial fall in mortality rates is selectively concentrated among infectious diseases, and it tends to favor the young segments of the population. Therefore, the health profile of the population is changed, and instead of acute processes that present fast evolution to healing or death, chronic-degenerative diseases and their complications become prevalent.
The population composed by the segment of the elderly is the one that mostly grows after the demographic transition triggered in the 1980s, all over the country.
resumO: O estudo objetivou identiicar fatores explicativos da taxa de mortalidade por doenças cardiovasculares dos homens idosos nas 187 microrregiões do nordeste do Brasil em 2000, a partir de indicadores das condições de vida e de vulnerabilidade dessa população, com o uso da modelagem de equações estruturais. Foram traçadas as seguintes etapas metodológicas: (1) através dos microdados do Censo 2000 foram selecionados 10 indicadores para o construto exógeno condições de vida e de vulnerabilidade. Do Sistema de Informação de Mortalidade do Ministério da Saúde foram obtidos os óbitos das quatro principais causas básicas por doenças cardiovasculares, as quais compuseram o construto endógeno como variável desfecho; (2) análise da qualidade dos dados de mortalidade; (3) análise estatística através da modelagem de equações estruturais em duas etapas: ajustamento do modelo de mensuração das variáveis latentes e ajustamento do modelo estrutural obtido. Em virtude da multicolinearidade veriicada, três indicadores foram signiicativos para o modelo de mensuração: anos de estudo, percentual de idosos em domicílios com banheiro/água encanada e probabilidade de sobrevivência aos 60 anos. O modelo estrutural indicou adequação de ajustamento do modelo hipotetizado, o qual apresentou medida de coeiciente padronizado considerada de forte efeito (CP = 0,81, p < 0,01) e coeiciente de determinação r2 = 66%. Conclui-se que o construto condições de vida e de vulnerabilidade foi fortemente associado com a mortalidade por doenças cardiovasculares de homens idosos do nordeste do Brasil em 2000.
This phenomenon has been pointed out as one of the most relevant demographic facts of the last decades, which, on the other hand, leads to new demands for social policies, security and health. Factors associated with the lower survival rate among the elderly, and consequently, the higher mortality, have been pointed out, such as demographic, socioeconomic and social support factors, as well as history of morbidity, lifestyle and habits, among others2-4.
At the same time, changes have been occurring in the scenario of causes of death as a result of the epidemiological transition and, together with the aging of the Brazilian population, there is higher proportion of deaths among the elderly in relation to total deaths. According to data from the System of Mortality Information (SIM), from the Ministry of Health of Brazil5, in 1980 about 38% of all deaths in the country involved people aged more than
60 years old. In 1991 and 2000, they represented 50 to 55% of the total of deaths, respectively. However, the increased proportion of deaths among the elderly does not imply increasing mortality rates of this age group.
Some studies6,7 have pointed out that, from 1980 to 2000, the life expectancy of the
Brazilian population at the age of 60 increased, and that such gains in relative terms were bigger than the gains obtained by the total population.
Cardiovascular diseases (CVD) represent the main cause of death and incapacity. In the developed world, 49% of the deaths are caused by CVD. In developing countries, it is estimated that in 2020 on third (34%) of all deaths will be caused by CVD6. In the northeast
region of Brazil, the relevance of these causes is also noticed, once about 45% of the deaths among the elderly are a result of causes associated to CVD7.
Several studies have shown a narrow relationship between mortality among the adults and life conditions expressed by means of indicators such as income, education, occupation, household conditions, among others8-10. In this line of thought, other researchers focused on the
relationship between adult mortality caused by CVD and economic indicators, such as the Gini coeicient and the per capita Gross National Product, educational indicators, such as schooling years11-14 and schooling, and social indicators, such as medical care, health services,
among others. The analysis of these relationships has been explored by several explanatory models, which usually apply regression analyses, multivariate models and metanalysis. However, only a few have used the Structural Equation Modeling (SEM) in these analyses, since life conditions and mortality are usually expressed by latent variables. This technique enables the study of modeling between latent exogenous or independent constructs, which explains the causality for endogenous constructs (or dependent ones). Besides, in Brazil, the only source that is able to provide indicators for spatial units concerning the micro regions is the demographic census.
events for these geographic units. It is important to recover the explanatory potential both of death registers and their basic causes, such as CVD, as well as to investigate their relationships with life conditions. Despite these deiciencies, such statistics is really useful to understand population changes and to guide policies to reduce the incidence of certain diseases and their consequences for the population, especially in regions with incipient studies, such as the Brazilian northeast.
In this context, this study aimed at identifying if life conditions and vulnerability are associated with mortality from cardiovascular diseases among elderly men in the Northeast region of Brazil, through the structural equation modeling. By considering that in literature no studies were observed in relation to mortality with explanatory factors by means of latent constructs, this gap justiies this approach.
MEtHodoLoGY
Study deSign and data baSe
A cross-sectional ecological design study was conducted for the year 2000, and the analysis of unit was the micro region. The base that composed the data of the study population and the indicators of life condition was established from census registers and microdata (sampling results) from Census 2000, by the Brazilian Institute of Geography and Statistics (IBGE)15; data concerning deaths caused by CVD were extracted from the SIM, from the
Ministry of Health5, through the four main basic causes: cerebrovascular diseases (CVd),
ischemic heart diseases (IHD), hypertensive diseases (HPD), and other cardiovascular diseases (CVD), based on the International Classiication of Diseases and Health-Related Problems (ICD-10) informed in SIM. Information was collected from units of analysis formed by the 187 micro regions that compose the 9 states in the Brazilian Northeast.
These data bases were separated by the variables sex and quinquennial age groups up to the age of 85 and older. The simple arithmetic mean of deaths was calculated for the triennium 1999/2000/2001, in order to avoid possible random data luctuation. Populations were projected for mid-2000 by using the geometric growth method16.
Sub-registration of deaths was estimated by using the growth balance equation method, developed by Brass17, for further correction of deaths in the micro-regions18. The ill-deined
causes that are present in Chapter XVI of ICD-10 were redistributed in the corresponding well-deined causes, that is, CVD, through the Lederman method, according to Vallin19.
The variables or indicators used as explanatory factors and associated to mortality caused by CVD among male elderly people concerning education, income and vulnerability were: SCH_Y (schooling years), ILLIT (percentage of illiterate elders), REA_WRI (percentage of elders who read/write), TotIn (mean total income of elders), R_SOS (percentage of retired people by social security), R_PEN (percentage of retired elderly people or those on pension); and also, synthetic demographic and vulnerability indicators: PCI_mean (mean per capita income of the micro-regions), B_PLUM (percentage of elderly people living in households with bathroom and plumbing), PRB40 (probability of surviving to the age of 40, in 2000), and PRB60 (probability of surviving to the age of 60, in 2000). The last four indicators were selected from the Brazilian Atlas of Human Development (ADHB)20.
The statistical package PASW Statistics 18 (SPSS Inc., Chicago, IL) was used for creating the data base.
StatiStical analySiS
In this study, the Structural Equation Modeling (SEM) was used to test the validity of theoretical models that deine casual relationships, hypothetic between variables21. This modeling
consists of the simultaneous estimation of a series of multiple linear regression equations, and it has some advantages over the classic linear regression22-24.
The SEM used in this study consisted of two submodels: (1) Structural model (structural equation), which represents the casual relationship between exogenous and endogenous variables, and (2) Measuring model (measuring equations), which established how latent variables or hypothetic constructs are measured by observable indicators. The signiicance of the measuring model was veriied by individual reliability or by the convergent validity of standardized regression coeicients. Reliability was veriied for coeicients with signiicant p-value < 0.01 and strong load (> 0.50)22-24.
ProPoSed theoretical model and diagram of PathS
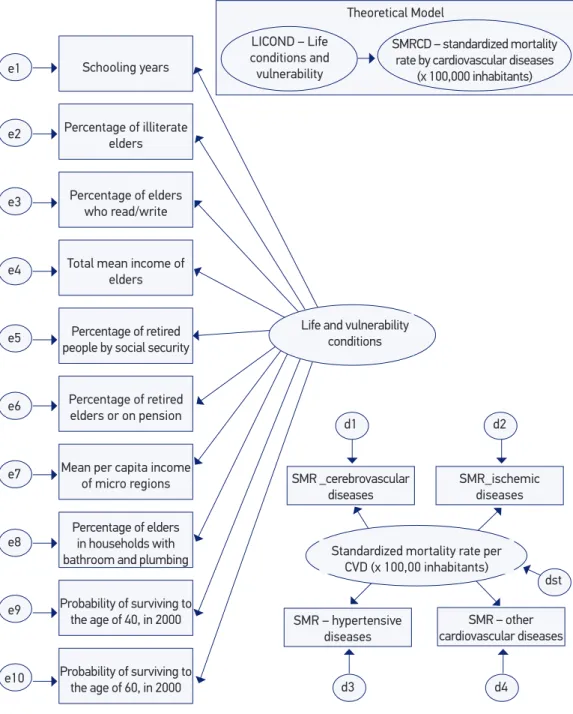
The theoretical model to be tested by SEM is represented in Figure 1, involving the relationship between the construct or exogenous latent variable LICOND – life conditions and vulnerability (cause), indirectly estimated by the 10 previously mentioned indicators, and the endogenous latent construct SMRCD – standardized mortality rate by cardiovascular diseases x 100 thousand inhabitants (efect or outcome), which was also indirectly estimated by its four main basic causes.
SMR: standardized mortality rate (x 100,000 inhabitants); CVD: Cardiovascular diseases; Measurements errors: e1, e2, ... , e10 (indicators) e d1, d2, d3, d4 (root causes); dst (random disturbance).
Note: Diagram of paths produced with the AMOS sotware, version 18.
Figure 1. Theoretical model proposed using the structural equation modeling and presentation in diagram of paths.
Probability of surviving to the age of 60, in 2000
Theoretical Model
Standardized mortality rate per CVD (x 100,00 inhabitants) SMR _cerebrovascular
diseases
SMR – hypertensive diseases
SMR_ischemic diseases
SMR – other cardiovascular diseases Schooling years
Percentage of illiterate elders
Percentage of elders who read/write
Total mean income of elders
Percentage of retired people by social security
Percentage of retired elders or on pension
Mean per capita income of micro regions
Percentage of elders in households with bathroom and plumbing
Probability of surviving to the age of 40, in 2000
Life and vulnerability conditions
d1
d3
d2
d4
dst e1
e2
e3
e4
e5
e6
e7
e8
e9
e10
LICOND – Life conditions and vulnerability
SMRCD – standardized mortality rate by cardiovascular diseases
eStimation method
The SEM analysis was conducted by the Maximal Likelihood method (ML), by using the AMOS software – Analysis of Moment Structures (v.18, SPSS Inc., Chicago, IL). This analysis was made in two steps: the irst one provided the adjustment for the measuring model of exogenous (LICOND) and endogenous (SMRCD) variables through standardized estimates or linear regression coeicients for each one of the constructs. On the second step, there was the adjustment of the structural model through several indicators of absolute, relative and parsimonious adjustment considered for the adjustment of data to the proposed model21,24.
In order to avoid the violation of the multivariate normality guidelines required to conduct the ML method, for the variables or indicators 200 bootstrapping statistics were conducted to assist the method of indicators of the measuring model in the 187 micro regions, considering that the introduction of mathematical transformations for the study variables did not meet these guidelines. Therefore, satisfactory adjustments of the final model were obtained with this procedure22. The modeling results, that is,
standardized coefficients (SC) were interpreted according to Kline24, whose classification
requires: SC of about 0.10, indicating a small effect; SC of about 0.30, indicating a medium effect and SC > 0.50, indicating strong effect.
For the better adjustment of the structural model, the following statistics and adjustment quality rates were considered, with respective reference values used more frequently in SEM applications21,24:
• Absolute rates: assess the quality of the model, however, without comparison to the other models — discrepancy function (χ2 the lower the better; p > 0,05); Chi-squared
normality test (χ2/df ) — values superior to 1, up to 2; root mean square error of
approximation (RMSEA), values superior to 0.05 up to 0.10; goodness of it index (GFI): values between 0.90 and 0.95;
• Relative or comparative rates: assess the quality of the model with the worst possible adjustment (independence model: non-relation between any manifested variables) — comparative adjustment index (CAI): values superior to 0.90 up to 0.95; Tukey-Lewis Index (TLI): values superior to 0.90 up to 0.95;
• Parcimony index: obtained by the correction of relative rates with a penalization factor associated associated with the complexity of the model — parsimonious GFI (PGFI): values between 0.60 and 0.80; and parsimonious CFI (PCFI): values between 0.60 and 0.80.
rEsuLts
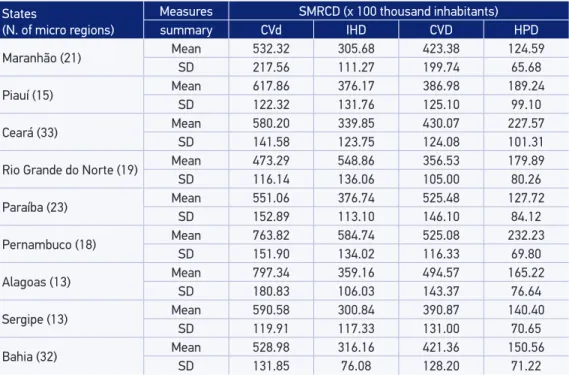
Table 1 presents the descriptive measures, mean and standard-deviation, for the variable response or outcome Standardized Mortality Rate by Cardiovascular Diseases (SMRCD) (x 100 thousand inhabitants) through the 4 main basic causes: CVd, IHD, HPD, CVD.
Concerning the standardized rates, a higher mean from CVd was observed in all of the micro-regions from eight of the nine Northeast states, except for Rio Grande do Norte, where, in average, IHD. Afterwards, in decreasing order, the following standardized mortality rates prevailed: CVD, IHD and HPD.
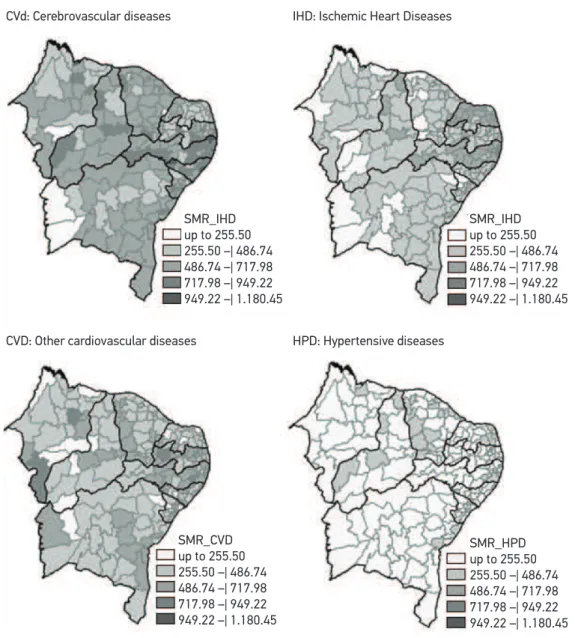
Figure 2 allows a spatial view of the standardized rates by micro-regions. The “maps” were built by the software TabWin_3.2, from DATASUS, and present the hierarchical behavior of the four basic causes of death from CVD.
Figure 3 presents the analysis of the diagram for the re-established proposed theoretical model, in which there are 3 of the 10 indicators that provide signiicance to the adjustment of the model — the other indicators were excluded for presenting multicollinearity — thus providing a standardized SEM solution for the inal model. Results were signiicant
Table 1. Descriptive measurements of the standardized mortality rate due to cardiovascular disea -ses of the four main underlying cau-ses of death among elderly men in the 187 microregions of Northeast Brazil (2000).
States
(N. of micro regions)
Measures SMRCD (x 100 thousand inhabitants)
summary CVd IHD CVD HPD
Maranhão (21) Mean 532.32 305.68 423.38 124.59
SD 217.56 111.27 199.74 65.68
Piauí (15) Mean 617.86 376.17 386.98 189.24
SD 122.32 131.76 125.10 99.10
Ceará (33) Mean 580.20 339.85 430.07 227.57
SD 141.58 123.75 124.08 101.31
Rio Grande do Norte (19) Mean 473.29 548.86 356.53 179.89
SD 116.14 136.06 105.00 80.26
Paraíba (23) Mean 551.06 376.74 525.48 127.72
SD 152.89 113.10 146.10 84.12
Pernambuco (18) Mean 763.82 584.74 525.08 232.23
SD 151.90 134.02 116.33 69.80
Alagoas (13) Mean 797.34 359.16 494.57 165.22
SD 180.83 106.03 143.37 76.64
Sergipe (13) Mean 590.58 300.84 390.87 140.40
SD 119.91 117.33 131.00 70.65
Bahia (32) Mean 528.98 316.16 421.36 150.56
SD 131.85 76.08 128.20 71.22
for the following indicators: SCH_Y (0.70), B_PLUM (0.63) and PRB60 (0.50), therefore meeting the criteria of the convergent analysis for the measuring model of the exogenous construct LICOND. The variable SMRCD response or outcome also presented a signiicant measuring model through the four main basic causes considered: CVd (0.52), IHD (0.52), CVD (0.49) and HPD (0.44).
Note: Use of DataSus sotware TABWIN, version 3.6.
Figure 2. Variation of the standardized mortality rates of the four main underlying causes of deaths due to cardiovascular diseases among elderly men in the 187 micro regions in Northeast Brazil (2000).
CVd: Cerebrovascular diseases IHD: Ischemic Heart Diseases
CVD: Other cardiovascular diseases HPD: Hypertensive diseases SMR_IHD
up to 255.50 255.50 –| 486.74 486.74 –| 717.98 717.98 –| 949.22 949.22 –| 1.180.45
SMR_IHD up to 255.50 255.50 –| 486.74 486.74 –| 717.98 717.98 –| 949.22 949.22 –| 1.180.45
SMR_CVD up to 255.50 255.50 –| 486.74 486.74 –| 717.98 717.98 –| 949.22 949.22 –| 1.180.45
In Figure 3, it is also possible to observe that the inal model for the mortality of the elderly presented general adjustment indicators, with strong efect measures provided by the latent construct LICOND (SC = 0.81), and providing an estimation coeicient with signiicant portion of explanation of the variance of the outcome variable, SMRCD, r2 = 66%.
The analysis of the quality of the general adjustment of the model was conducted by assessing the estimation of the response variable SMRCD through SEM for the final presented model (Table 2). The criteria for a good model adjustment, according to Kline24
and Marôco21, were met for all of the considered absolute, relative and parsimonious
adjustment indicators
CP: standardized coeicient (Strong efect, CP >0.50); **signiicant correlations, p-value <0.01; r2: coeicient of multiple determination; SMR: standardized mortality rate (x100,000 inhabitants);
Measurements errors: e1, e8, e10 (indicators) e d1, d2, d3, d4 (root causes); dst (random disturbance).
Figure 3. Structural equation modeling – estimating standardized for the inal model.
Schooling years e1
Life and vulnerability conditions e8 Percentage of elders in households with
bathroom and plumbing
e10 Probability of surviving to the age of 60, in 2000
Standardized mortality rate per CVD (x 100,00 inhabitants) SMR _cerebrovascular
diseases
SMR_hypertensive diseases
SMR_ischemic diseases
SMR_other cardiovascular diseases d1
d3
d2
d4
dst
0.52** 0.52**
0.44** r2 = 0.66 0.49**
0.70**
0.63**
0.50**
CP = 0.81** χ2 = 25.982 (14 df)
dIscussIon
Cardiovascular diseases in the northeast, as well as in the populations in general, are the major cause of death among the elderly, emphasizing the importance of evaluating their association with life conditions and health indicators. The levels for the states in the Northeast are low when compared with the ones in Brazil26. Among the CVD, CVd
and IHD stand out. In Brazil, death caused by CVD was more prevalent among men in 20006. For them, the risk of death from IHD and CVd was close. For the elderly,
CVd killed more than IHD26,27. The micro regions of the states with higher values, in
general, were in Pernambuco, Alagoas, Paraíba and Ceará, in decreasing order. The lowest ones were in Maranhão.
It is known that the quality of death registers in the northeast has problems26. It is
important to consider that, even though it was not easy, there was the attempt to recover the “real” mortality levels caused by CVD in the micro regions through estimates of death sub-registers and, also, by redistributing the ill-defined causes with defined causes. This effort followed the methodological steps established by Paes and Gouveia28. Even
though there may be errors in the estimates, it is possible to admit that the corrections performed produced very plausible mortality rates for the investigated causes.
In Brazil, in 2000, more than half of the deaths among the elderly was caused by diseases related to the circulatory system, which corroborates the indings that individuals aged more than 60 years old presented deaths mostly related to chronic degenerative diseases6.
The f inal modeling by SEM for the mortality rate among the elderly due to CVD presented good adjustment rates for the model. The model results suggest Table 2. Adjustment indicators of structural equation modeling for modeling the cardiovascular mortality of elderly men in the 187 micro regions of Northeast Brazil (2000).
Adjustment indicators Criteria for the good adjustment of the model by
Marôco21 and Kline24
Final model SMRCD
Absolute adjustment
Discrepancy function: χ2 (p value) - 25.982 (0.026*)
Normal chi-square (χ2 /gl) Value between 1 and 2 25.982/14 = 1.856
GFI (goodness of it index) above 0.90 0.962 RMSEA (root mean square error
of approximation – residue) p (Ho: RMSEA 0.05 – 0.10 ≤ 0.05)
0.068 p = 0.212 Relative adjustment
CFI (comparative it index) above 0.90 0.936
TLI (Tukey-Lewis index) above 0.90 0.903
Parsimonious adjustment
PGFI (parsimonious GFI) 0.60 – 0.80 0.641
PCFI (parsimonious CFI) 0.60 – 0.80 0.624
the strong association of the exogenous construct life conditions — composed by the indicators schooling years of elderly men, percentage of elderly men in households with bathroom/plumbing and probability of surviving to the age of 60 — with the mortality rate caused by cardiovascular diseases among elderly men in the northeast region in 2000. The importance of these indicators is confirmed by other studies, which emphasize the importance expressed by education, socioeconomic conditions and aging with gains in years of life11.
The discussion about the relationship between health status of a society and indicators that express life conditions has been recurring and current, considering the different approaches of studies found in international literature10,14,29-32. In Brazil,
this theme has called the attention of researchers, especially from the final 1990s on, when information systems about mortality improved the quality of data, which enabled more accurate investigations about the relationship between mortality and socioeconomic indicators11-13,33-35.
In the past two decades, the production of studies that included more social variables in explanatory models has grown, such as life conditions and, especially, education. The attention of researchers of this theme has been directed to the role of social inequalities, especially educational differences, which are created by the distorted distribution of human capital, especially in poor or developing countries. The educational systems of these locations are inefficient and make the access of the poorer population to material resources more difficult, such as the micro regions of the Brazilian northeast, which cannot access qualified education. Some studies conducted in Brazil and in other countries prove that educational inequality is complicated because it has a direct effect on the adoption of healthy habits, which minimize the effects of risk factors for cardiovascular diseases13,30,34,35.
A study conducted with the use of meta-analyses of papers published in literature9
Therefore, the studies conducted in Brazil that relate mortality from CVD with socioeconomic variables are in accordance with the results in this study with regard to the role of these latent indicators of life conditions as being determinant for mortality caused by CVD. Therefore, it is necessary to consider these variables as being potentially explanatory in the elaboration of intervention proposals for the elderly in Brazil, especially in the Northeast.
concLusIon
This study can be seen as a pioneer in the analyses about SEM for life condition and vulnerability factors that explain mortality caused by CVD among the elderly men in Brazil. In this study, diferent realities were pointed out through the microdata of Census 2000, and this source provides the lowest disaggregation level in Brazilian statistics. This enabled the construction of a regional scenario of the main causes of death caused by CVD among the elderly. The possibility of obtaining the new microdata from Census 2010 will allow the update and comparison of results obtained in this study by using the same methodological procedure. This will enable to analyze the impact of the life condition factor in this northeast population, once actions of attention to the health of the elderly population have been intensiied, and the social beneits have been extended to the other members of the family who used the income of the elder. The social security beneit was conceived to the second elder of the house — which before was only allowed for one of the elders — and the basic coverage of primary care increased. These changes will impact the life conditions of the elderly generally, and, therefore, new contributions can be revealed, leading to a broader vision of national and regional reality.
rEfErEncEs
1. Frenk J, Frejka T, Bobadilla JL, Stern C, Lozano R, Sepúlveda J, et al. La transición epidemiológica en America Latina. Bol Oicina Sanit Panam 1991; 111(6): 485-96.
2. Psaty BM, Furberg CD, Kuller LH, Cushman M, Savage PJ, Levine D, et al. Association between blood pressure level and the risk of myocardial infarction, stroke and total mortality: the cardiovascular health study. Arch Intern Med 2001; 161(9): 1183-92.
3. Black D, Morris JN, Smith C, Townsend P, Whitehead M. Inequalities in health: the black report; the health divide. London: Penguin; 1988.
4. Martelin T. Mortality by indicators of socioeconomic status among the Finnish elderly. Soc Sci Med 1994; 38(9): 1257-78.
5. Ministério da Saúde. Sistema de Informação sobre Mortalidade (SIM). Disponível em http://tabnet. datasus.gov.br/cgi/idb2008/matriz.htm#mort (Acessado em 15 de fevereiro de 2008).
6. Ministério da Saúde. IDB 2003 BRASIL, Rede Interagencial de Informações para a Saúde (RIPSA). Disponível em http://tabnet.datasus.gov.br/cgi/ deftohtm.exe?idb2003/c08.def (Acessado em 08 de maio de 2011).
7. Lima-Costa MF, Peixoto SV, Giatti L. Tendências da mortalidade entre idosos brasileiros (1980 - 2000). Epidemiol Serv Saúde 2004; 13(4): 217-28.
9. Groot W, van den Brink HM. The health efects of education. Econ Educ Rev 2007; 26: 186-200.
10. Braveman P, Tarimo E. Social inequalities in health within countries: not only an issue for aluent nations. Soc Sci Med 2002; 54(11): 1621-35.
11. França MC, Paes NA. Income, income inequality and mortality in metropolitan regions of Brazil: an exploratory approach. Pap Poblac 2007; 13(53): 225-239.
12. Godoy MF, Lucena JM, Miquelin AR, Paiva FF, Oliveira DLQ, Junior JLA, et al. Mortalidade por doenças cardiovasculares e níveis socioeconômicos na população de São José do Rio Preto, estado de São Paulo, Brasil. Arq Bras Cardiol 2007; 88(2): 200-6.
13. Bassanesi SL, Azambuja MI, Achutti A. Mortalidade precoce por doenças cardiovasculares e desigualdades sociais em Porto Alegre: da evidencia à ação. Arq Bras Cardiol 2008; 90(6): 403-12.
14. Raphael D, Farrel S. Income inequality and cardiovascular disease in North-America: shiiting the paradigm. HHPR 2000; 3(2): 1-2.
15. IBGE. Instituto Brasileiro de Geograia e estatística. Dados Básicos do Censo Demog ráf ico 2000. Disponível em ftp://ftp.ibge.gov.br/Censos/Censo_ Demograico_2000/Dados_do_Universo/Unidades_ da_Federacao/ (Acessado em 14 de fevereiro de 2008).
16. Shryock HS, Siegel JS and associates. The methods and materials of demography. In: Stockwell EG. Studies in population. Condensed Edition. San Diego (CA): Academic Press; 1975. p. 439-43.
17. Brass W. Methods for estimating fertility and mortality from limited and defective data. Occasional Publication. Chapel Hill (NC): University of North Carolina, International Program of Laboratories for Population Statistics; 1975.
18. Paes NA. Os eventos vitais do Nordeste brasileiro: cenários regionais, qualidade dos dados, relacionamentos e brechas redutíveis da mortalidade. João Pessoa (PB): Relatório Técnico de Atividades para o CNPq. Edital MCT/CNPq(BR); novembro de 2010. 15 p. Processo No 479514/2008.2.
19. Vallin J. Seminário sobre causas de muerte: Aplicación al caso de Francia. Santiago (Chile): INED - Instituto Nacional de Estudos Demográicos e CELADE; 1987. Série E, n. 31.
20. ADHB. Atlas de Desenvolvimento Humano do Brasil. Dados básicos oriundos do Censo 2000. PNUD/IPEA/ FJP; 2003. Software disponível em http://www.pnud. org.br/atlas/instalacao/index.php (Acessado em 16 de fevereiro de 2008).
21. Marôco J. Análise de equações estruturais: fundamentos teóricos, software & aplicações. Pêro Pinheiro: Report Number; 2010.
22. Byrne BM. Structural equation modeling with AMOS: basic concepts, applications and programming. Mahwah: Lawrence Erlbaum; 2001.
23. Hair JF, Anderson RE, Tatham RL, Black WC. Análise multivariada de dados. 5ª ed. São Paulo: Bookman Editora; 2005.
24. Kline RB. Principles and Practice of Structural Equation Modeling. 2ª ed. New York: The Guilford Press; 2005.
25. Wan TTH. Evidence-based health care management: multivariate modeling aproaches. Massachusetts: Kluwer Academic Publishers; 2002.
26. Mansur AP, Lopes AI, Favarato D, Avakian SD, César LA, Ramires JA. Transição epidemiológica da mortalidade por doenças circulatórias no Brasil. Arq Bras Cardiol 2009; 93(5): 506-10.
27. Mansur AP, Souza MF, Timerman A, Ramires JA. Tendência do risco de morte por doenças circulatórias, cerebrovasculares e isquêmicas do coração em 11 capitais do Brasil de 1980 a 1998. Arq Bras Cardiol 2002; 79(3): 269-76.
28. Paes NA, Gouveia JF. Recuperação das principais causas de morte no Nordeste do Brasil: impacto na expectativa de vida. Rev Saúde Pública 2010; 44(2):301-9.
29. Wilkinson RG. Divided we fall. BMJ 1994; 308(6937): 1113-4.
30. Ross CE, Wu Chia-ling. The links between education and health. Am Sociol Rev 1995; 60(5): 719-45.
31. Lynch JW, Smith GD, Kaplan GA, House JS. Income inequality and mortality: importance to health of individual income, psychosocial environment, or material conditions. BMJ 2000; 320(7243): 1200-4.
32. Ghosh S, Kulkarni PM. Does the pattern of causes of death vary across socioeconomic classes within a population? An exploratory analysis for India. Genus. 2004;LX(2): 55-81.
33. Cerqueir a CA. Mor talidade por causas nas capitais brasileiras e associações com indicadores socioeconômicos [dissertação de mestrado]. Recife: Universidade Federal de Pernambuco ;1998.
34. Boakari FM. Poverty and education: Brazils’s search for viable solutions? Advances in education in diverse communities: research, policy and praxis 2006; 4: 253-94. Disponível em http://www.sciencedirect.com/ science (Acessado em 30 de janeiro de 2008).
35. Messias E. Income inequality, Illiteracy rate and life expectancy in Brazil. Am J Public Health 2003; 93(8): 1294-6.
Received on: 06/25/2012