www.atmos-chem-phys.net/17/521/2017/ doi:10.5194/acp-17-521-2017
© Author(s) 2017. CC Attribution 3.0 License.
Nocturnal new particle formation events in urban environments
Farhad Salimi1,2, Md. Mahmudur Rahman2, Sam Clifford2, Zoran Ristovski2, and Lidia Morawska2
1Menzies Institute for Medical Research, University of Tasmania, Hobart, Tasmania
2International Laboratory for Air Quality and Health, Queensland University of Technology, GPO Box 2434,
Brisbane QLD, 4001, Australia
Correspondence to:Lidia Morawska ([email protected])
Received: 16 June 2016 – Published in Atmos. Chem. Phys. Discuss.: 20 July 2016 Revised: 1 December 2016 – Accepted: 5 December 2016 – Published: 11 January 2017
Abstract.Few studies have investigated nocturnal new par-ticle formation (NPF) events, and none of them were con-ducted in urban environments. Nocturnal NPF can poten-tially be a significant source of particles in urban areas, and studying them would improve our understanding of nucle-ation mechanisms. To address this, our study was conducted in an urban environment to investigate the physical charac-teristics of NPF events, with a particular focus on noctur-nal events and the differences between them and the day-time NPF events. Particle number size distribution (PNSD) was measured for 2 weeks at each of 25 sites across an ur-ban environment. A new method was proposed to automat-ically categorise NPF events based on growth rate (GR) in order to remove the bias related to the manual procedure. Out of 219 observed events, 118 and 101 were categorised into class I and II respectively and 73 happened during the nighttime which included more than 30 % of the events. GR and condensation sink (CS) were calculated and a slight neg-ative relationship between GR and CS was observed. Noc-turnal events displayed higher GRs compared to daylight ones which were on average about 10 %. Back trajectory analysis was also conducted to estimate the locations of the sources of daylight and nocturnal precursors. While the pre-cursors related to daylight events originated from different locations with no particular pattern, back-trajectory analy-sis showed many air masses associated with nocturnal NPF events were transported from over the ocean. Overall, noc-turnal NPF events were found to be a significant source of particles in the studied environment with different physical characteristics and/or sources compared to daylight events.
1 Introduction
Atmospheric aerosols are known to affect atmospheric and climatic conditions (Solomon et al., 2007; McMurry et al., 2004) and also have an adverse effect on human health, as shown by numerous epidemiological studies (Pope and Dockery, 2006; Dockery, 2009; Dockery and Pope, 1994; Gauderman et al., 2007). Smaller particles, such as ultra-fine particles (UFPs, with a diameter < 100 nm), can have a greater adverse effect on human health as they can pene-trate deeply into the pulmonary system (WHO, 2005; Delfino et al., 2005; Li et al., 2003). New particle formation (NPF) events as a major source of UFPs have been observed in dif-ferent types of locations around the globe including coastal, forested, mountainous, rural, and urban areas (Holmes, 2007; Kulmala et al., 2004; Kerminen et al., 2010). By elevating ambient particle number concentration (PNC), NPF events can potentially affect the climate and cause adverse effects on human health. Therefore, numerous studies have investi-gated this phenomenon and the relevant physical properties (e.g. growth rate; GR) and their trends around the globe.
522 F. Salimi et al.: Nocturnal new particle formation events
Daylight Nighttime
●
● ●
● ●●●
● ● ●●●
●●●● ●●● ●
● ●●●●
●
● ● ●
●
● ●
● ●●
●●● ●●
● ●
● ●●
●●●● ●
● ●
●●●●● ●●●●
●● ● ●●
● ● ●●
●●●● ●
●
● ●
● ●
● ●
●
● ● ●
● ●
●● ●
●● ●●
●● ●●●●●●
● ●
● ●
●● ● ●●
● ●●
●●●
−20 −10 0 10 20
0 50 100 150 0 20 40 60
Event number
GR (nm h )
New particle formation event class ● 1 2
–1
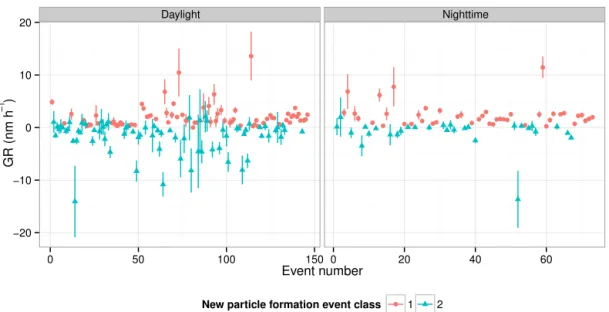
Figure 1.Calculated growth rate (GR) of daylight and nighttime NPF events with their 95 % confidence interval.
be an active source of nocturnal NPF events as this phe-nomenon was observed in this environment in 32 % of the analysed nights in a study conducted in New South Wales, Australia (Suni et al., 2008). Chamber experiments were also conducted under dark to varying conditions in order to repro-duce the nocturnal events observed in the atmosphere, and it was found that in the presence of ozone, several monoter-penes such as delta-3-carene,α-pinene, and limonene were able to produce NPF events (Ortega et al., 2012).
Nocturnal NPF events have been studied much less than daylight events as they were usually considered to be excep-tions because of the dominant theory that NPF events take place in the presence of solar radiation. However, as men-tioned above, nocturnal NPF events were found to be signifi-cant sources of particles in some environments and need to be further studied, as understanding this phenomenon will en-hance an overall knowledge of atmospheric nucleation mech-anisms. In addition, no studies have ever reported the noctur-nal events in urban environment, and there is no informa-tion available about the characteristics of this phenomenon in more polluted area.
This work was conducted in Australia where NPF events have been previously found to be a significant contributor to the total UFPs (Salimi et al., 2014; Cheung et al., 2011). This study reports for the first time on the occurrence of nocturnal NPF events in urban environments and it aims to determine their physical characteristics and compare them with daylight NPF events.
2 Materials and methods 2.1 Background
From October 2010 to August 2012, air quality measure-ments were performed for two consecutive weeks at each of 25 randomly selected government primary schools within the Brisbane Metropolitan Area. All 25 sites were located be-tween 1.5 and 30 km from Brisbane city. Some sites were affected more by high traffic density than others. The av-erage hourly traffic counts at the nearby roads to the sites were ranged between 44 and 1217 (Laiman et al., 2014). This study was conducted within the scope of the Ultra-fine Particles from Traffic Emissions and Children’s Health (UPTECH) project, which sought to determine the relation-ships between exposure to traffic-related UFPs and children’s health. Further details regarding the UPTECH project and its study design can be found in our previous publication (Sal-imi et al., 2013). While this study has been performed within the framework of the UPTECH project, the results are not limited to school environments and have urban implications.
2.2 Instrumentation, quality assurance, and data processing
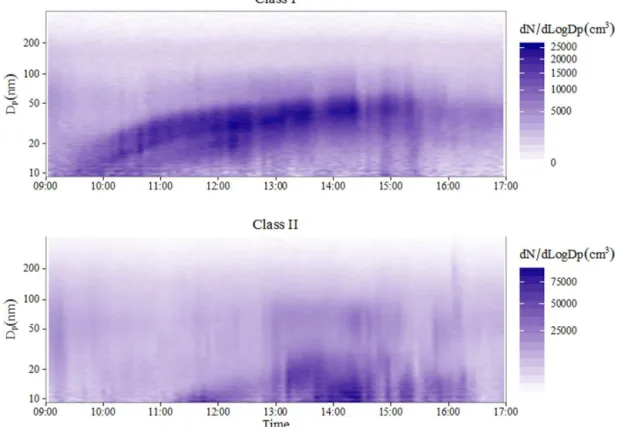
Figure 2.Examples of the observed class I and class II NPF events.Dpis particle diameter and the colours of the image represent measured
concentrations at each time.
The SMPS system was calibrated for size accuracy using monodisperse polystyrene latex (PSL) particles, with a nom-inal diameter of 100 nm, five times during the entire mea-surement campaign. The instruments passed all the tests with a maximum error of 3.5 % from the nominal diameter, as recommended in Wiedensohler et al. (2012). The following quality assurance actions were performed at each regular site visit. Sheath and aerosol flow rate of the SMPS system was measured using a bubble flow meter. The system was zero-checked by connecting the HEPA filter to the inlet of the sys-tem. Particle loss due to diffusion was corrected using the formula derived for the laminar flow regime (Hinds, 1999). Particle loss inside the bipolar charger and DMA was cor-rected using an equivalent tube length, as suggested in Karls-son and MartinsKarls-son (2003) and Covert et al. (1997).
2.3 New particle formation identification and classification
Surface plots of all the measured PNSD data were scanned visually for NPF events, as recommended by Dal Maso et al. (2005). NPF events have been categorised into two main groups (classes I and II) based on their GR. As discussed by Dal Maso et al. (2005), class I events are those in which the growth can be determined with high confidence, whereas the growth of particles in the class II events are uncertain. The criteria described in the literature for identification and
differentiation of these types of events from one another are purely visual and consequently subjective. To address this issue, a simple statistical method was developed in this study. After identifying NPF events and the period for which it was observed, a linear regression model was fit to calculate the growth rate from the time series of count median diameter (CMD; Creamean et al., 2011). The start and end time of the NPF events were identified visually from the surface plots of PNSD data and then incorporated in the regression analysis to calculate the growth rate. The linear regression model for each NPF event was thus:
log CMDi =β0+β1ti+εi,
whereβ0is the intercept,β1is the growth rate of the CMD
and the residuals, and εi is independent, identically
dis-tributed white noise.
For each NPF event, growth rate (GR) and its related 95 % confidence interval (CI) were calculated. When the CIs were positive, they were classified as class I, and the rest of the events were classified as class II.
All statistical analysis was conducted in R (R Develop-ment Core Team, 2010).
2.4 Condensation sink
524 F. Salimi et al.: Nocturnal new particle formation events
of gaseous molecules on particles. CS can be calculated from particle number size distribution data, and has been used in the literature to estimate the concentrations and source rates of condensable vapours during NPF events (Kulmala et al., 2005). CS was calculated using the methods available in the literature (Pirjola et al., 1999; Lehtinen et al., 2003; Willeke, 1976; Bae et al., 2010; Salimi et al., 2015).
2.5 Kernel density estimation and generalised additive modelling
Kernel density function, also termed as Kernel smoothing, is a non-parametric method to estimate the probability density function of a variable (Silverman, 1986). Kernel smoothing is a very effective approach of visualising data structures with-out incorporating parametric model (Wand and Jones, 1994). In this study, Kernel smoothing estimated the overall diurnal trend of the NPF events over the study period in conjunc-tion with the histogram plot. We applied “ggplot2” package in R programming language to plot the smooth Kernel den-sity trend of NPF events (www.ggplot2.org). The relation-ship between the variables were analysed using generalised additive modelling (GAM) (Wood, 2003). The mathematical framework in GAM is similar to the generalized linear model (GLM); however, it replaces the linear function with non-parametric smoothers (e.g. penalised splines), which allow for flexible estimation of non-linear function. GAMs were found to be more appropriate than GLMs in estimating non-linear effect of response variables in air quality study (Clif-ford et al., 2011). One explanatory variable was used in each model. Hour, month, condensation sink, and production rate of the condensable vapour were used as the explanatory vari-ables in each model.
2.6 Back trajectory analysis
In order to investigate the possible sources of the NPF events, back trajectory analyses were conducted for all the class I events. 24 h air mass back trajectory was calculated using the HYSPLIT model to observe the passage of air before the start of nucleation (Draxler and Rolph, 2003).
3 Results and discussion
3.1 New particle formation events
New particle formation events were identified by visually scanning all the surface plots and were categorised into two groups (classes I and II) as described in Materials and meth-ods. Figure 1 illustrates the calculated GRs and their 95 % confidence intervals; events in which their confidence inter-val contains only positive inter-values were categorised as class I, while the rest were classified as class II events. Figure 2 shows the particle evolutions during typical class I, where a “banana-shaped” growth of particles is visible, and class II
● ● ● ● ● ● ● ● ● ● ● ● ● ● ● ● ● ● ● ● ● ● ● ● ● ● ● ● ● ● ● ● ● ● ● ● ● ● ● ● ● ● ● ● ● ● ● ● ● ● ● ● ● ● ● ● ● ● ● ● ● ● ● ● ● ● ● ● ● ● ● ● ● ● ● ● ● ● ● ● ● ● ● ● ● ● ● ● ● ● ● ● ● ● ● ● ● ● ● ● ● ● ● ● ● ● ● ● ● ● ● ● ● ● ● ● ● ● 0 5 10
0 4 8 12 16 20 23
Hour
GR (nm h )
● ● ● ● ● ● ● ● ● ● ● ● ● ● ● ● ● ● ● ● ● ● ● ● ● ●● ● ● ● ● ● ● ● ● ● ● ● ● ● ● ● ● ● ● ● ● ● ● ● ● ● ● ● ● ● ● ● ● ● ● ● ● ● ● ● ● ● ● ● ● ● ● ● ● ● ● ● ● ● ● ● ● ● ● ● ● ● ● ● ● ● ● ● ● ● ● ● ● ● ● ● ● ● ● ● ● ● ● ● ● ● ● ● ● ● ● ● 0 5 10
Mar Apr May June Jul Aug Sep Oct Nov Dec Month
GR (nm h )
–1
–1
Figure 3.Diurnal (0 to 23 h) and annual (March to December) pat-terns in growth rate. NPF events were not observed in January and February. The line represents a smoothed trend modelled with GAM and the shaded region represents the 95 % confidence interval.
Daylight Nighttime ● ● ● ● ● ● ●● ● ● ●● ● ● ● ● ● ● ● ● ● ● ● ● ● ● ● ● ● ● ● ● ● ● ● ● ● ● ● ● ● ● ● ● ● ● ● ● ● ● ● ● ● ● ● ● ● ● ● ● ● ● ● ● ● ● ● ● ● ● ● ● ● ● ● ● ● ● ● ● ● ● ● ● ● ● ● ● ● ● ● ● ● ● ● ● ● ● ● ● ● ● ● ● ● ● ● ● ● ● ● ● 0 5 10
0.02 0.04 0.06 0.08 0.02 0.04 0.06 0.08
Condensation sink (s−1)
G ro w th r a te ( n m h )
(a) CS vs. GR
Daylight Nighttime ● ● ● ● ● ● ● ● ● ● ● ● ● ● ● ● ● ● ● ● ● ● ● ● ● ● ● ● ● ● ● ● ● ● ● ● ● ● ● ● ●● ● ● ● ● ● ● ● ● ● ● ● ● ● ● ● ● ● ● ● ● ● ● ● ● ● ● ● ● ● ● ● ● ● ● ● ● ● ● ● ● ● ● ● ● ● ● ● ● ● ● ● ● ● ● ● ● ● ● ● ● ● ● ● ● ● ● ● ● ● 0.02 0.04 0.06 0.08
0e+00 1e+06 2e+06 3e+06 4e+06 5e+060e+00 1e+06 2e+06 3e+06 4e+06 5e+06
Production rate of condensable vapour (cm−3 s−1)
Condensation sink
(
s
−
1)
(b) Q vs. CS
−
1
Figure 4.Relationships between the growth rate (GR), condensa-tion sink (CS) and produccondensa-tion rate of condensable vapour (Q) for class I NPFs during daylight and nighttime. The line represents a smoothed trend modelled with GAM and the shaded region repre-sents the 95 % confidence interval.
events, where a burst of particles in nucleation size occurs without clear further growth.
II, respectively. The frequency of NPF events was signifi-cantly higher than previous observations in the same envi-ronment (Mejía et al., 2008; Cheung et al., 2011) and was aligned with the results of the cluster analysis in Salimi et al. (2014). In our study, the apportionments of the daylight and nighttime NPF events were 67 and 33 %, respectively. In this study, overall 54.3 % NPF events were class I, consisting of 34.2 % daylight events and 20.1 % nighttime events. GRs were ranged between 0.015–13.6 nm h−1during daylight and
0.25–11.5 nm h−1during nighttime.
In our previous investigations in subtropical urban and coastal environments in the Southern Hemisphere, we ob-served daylight NPF events (Cheung et al., 2011; Mejía and Morawska, 2009; Salimi et al., 2015). Daylight NPF event average GRs, obtained by authors of an earlier study also conducted in Brisbane (Cheung et al., 2011), were found to be of 4.6 nm h−1 (range of 1.79 to 7.78 nm h−1), which is
two times higher than in this study (2.4 nm h−1). Cheung et
al. (2011) calculated GRs based on long-term measurement data at a single site; however this study used data from 25 sites to calculate average GRs and therefore GRs in this study are expected to be more representative of the area of the study than the former one.
Studies from the other places in the world show higher GRs in some cases but also show similar measurements to those in this study. Similarly to our study, daylight NPF events were also observed frequently (40 % of all observa-tions) in urban locations in Beijing, China, during periods of low relative humidity and peak solar radiation, with the av-erage GRs of 1.8 and 4.4 nm h−1during clean and polluted
NPF events, respectively (Wu et al., 2007). In a recent study in the North China Plain, Shen et al. (2016) found daylight NPF event average GRs of 1.2 nm h−1 higher than in this
study. A 10-day campaign in a Japanese forest showed mid-day NPFs with the mean particle GR of 9.2 nm h−1, ranged
between 5 and 15.7 nm h−1, which is approximately four
times higher than in our study (Han et al., 2013). However, in a long-term (1996–2004) measurement campaign at four bo-real forests, Finland, Dal Maso et al. (2007) recorded the av-erage GRs of 3.0 nm h−1(range of 0.5–15.1 nm h−1), which
are similar to those in our study. However, nighttime NPFs were observed mostly at forest sites (Lee et al., 2008; Sven-ningsson et al., 2008; Suni et al., 2008). At a forest site in Abisko, Sweden, GRs which followed nighttime NPF events were 10–40 nm h−1, which is on average four times higher
than in our urban site study (Svenningsson et al., 2008). A rare observation of a nighttime NPF event at an urban site in Hong Kong was recently reported by Man et al. (2015). The event was associated with particle growth, and the GRs were higher than in our study, ranging from 7.1 to 39 nm h−1.
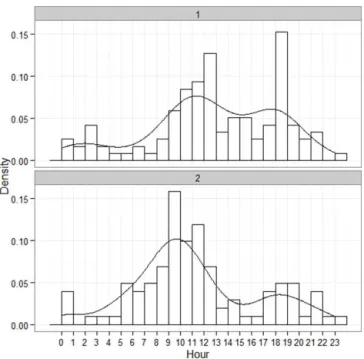
Figure 5.Diurnal patterns of class I and II NPF events with their Kernel density estimation.
3.2 Diurnal and temporal variation of newly formed particle growth rate
Temporal trends of GRs related to class I events were anal-ysed using GAM as described in Sect. 2. GAM model fit to the diurnal GR data revealed that GR had the highest value when the event started during the daylight (peaking around 10:00 LT) while nighttime events were less frequent and had relatively lower GR (Fig. 3). GAM model fit shows that the GR had the highest and lowest values in October and May, respectively (Fig. 3). The temporal and diurnal trend analy-sis showed positive correlation between the GR and the solar radiation. The highest GR occurred during the periods with the highest solar radiation.
3.3 Condensation sink and growth rate
re-526 F. Salimi et al.: Nocturnal new particle formation events
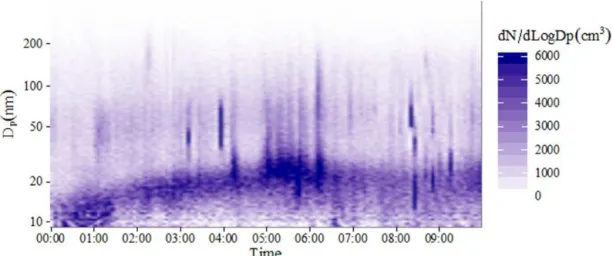
Figure 6.An example of a banana-shaped nighttime event.Dpis particle diameter and the colours of the image represent measured
concen-trations at each time.
Figure 7.Temporal trend of the nighttime events. Nucleation events were not observed in January, February, and September.
lationship between the GR and CS, which is not clearly ob-served in this study, denotes the event-quenching ability of the high CS. Svenningsson et al. (2008) concluded that high CS only allows events with high formation rate and GR to be observed, as the newly formed particles in weaker events would be scavenged by pre-existing particles. The explana-tion is only applicable to a high GR in days with high CS as it cannot justify the low GR in the days with low CS (Svenningsson et al., 2008). Salma et al. (2016) observed particle quenching and/or shrinkage events in NPFs which were linked to atmospheric conditions in Budapest, Hungary. The study observed a 25 % decrease in CS concentration during the shrinkage phase compared to the growth phase. Similar findings were observed in Po Valley, Italy (Hamed et al., 2007). To investigate this further, the relationship be-tween the calculated vapour production rate and the CS dur-ing both day and nighttime events was modelled usdur-ing GAM (Fig. 4). The condensable vapour concentration was
signifi-0 1 2 3
Daylight Nighttime
Time of event
G
ro
w
th
r
a
te
(
n
m
h
)
–1
Figure 8.Growth rate in daylight and nighttime nucleation events.
cantly lower during nighttime than daylight events, indicat-ing limited sources of condensable vapour production durindicat-ing night.
3.4 Temporal and diurnal variation of the events The relative frequency of the times at which NPF events oc-cur indicate that while the bulk of the NPF events ococ-cur dur-ing the midday period (10:00–13:00 LT), there are a num-ber of class I NPF events which occurred between 18:00 and 19:00 LT (Fig. 5).
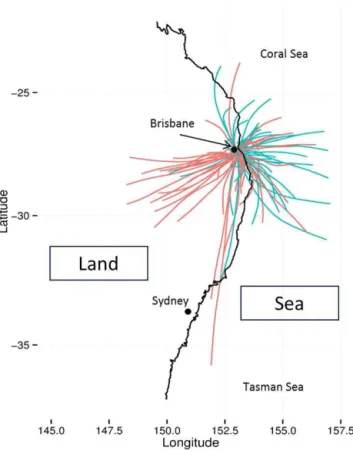
Figure 9.24 h HYSPLIT back trajectory analysis for daylight and nighttime class I events.
sudden burst of newly formed particles was observed during the nighttime events which are in contrast with the literature where only class II events were observed (Lee et al., 2008; Fig. 6). Nocturnal events occurred mostly in March and the least in December (Fig. 7). On average, GRs of nocturnal events were higher than those of daylight events (Fig. 8).
3.5 Source of the events
Air mass back trajectory analyses were conducted to inves-tigate the possible sources of both daylight and nighttime type 1 NPF events, for the 24 h preceding the start of each event (Fig. 9). The sources’ locations relative to daylight events do not form a specific cluster, and air masses coming from different locations seem to carry the required precur-sors for the daylight events. Air mass origin is found to be an influencing factor to aerosol mass concentration, chemi-cal composition, and daylight NPF events in Vienna, Austria, which agrees with our findings (Wonaschutz et al., 2015). In a recent investigation on the Korean Peninsula, Kim et al. (2016) found a link between daylight NPF events and con-tinental air mass. The relationship between nighttime NPFs and origin of air masses were not researched in those studies due to limited occurrences of NPF events at night.
Figure 9 shows that the nighttime events were linked to air masses from the east, north-east and south-east (over the ocean), pointing out the location of the sources of the pre-cursors. Biogenic dimethylsulfide (DMS) compounds were observed over the sea surface across the globe, with higher quantities in the coral reef regions (Deschaseaux et al., 2015; Kettle et al., 1999). With the presence of DMS, sulfur-containing aerosols were observed at night in the coastal regions in California, USA (Gaston et al., 2015). Biogenic DMS were found as a precursor of NPF in a coastal region in Antarctica (Yu and Luo, 2010). In a recent study, Swan et al. (2016) found that emissions from coral and reef seawater are potential sources of secondary aerosol in the Great Bar-rier Reef, Queensland, Australia. It is therefore possible that the nighttime NPFs identified in our study take their origin from the air mass containing biogenic oceanic precursors. To confirm this, it is recommended that future studies focus on comprehensive chemical characterisation of the air masses impacting on the urban study areas.
4 Conclusions
PNSD was measured at 25 sites within an urban environment and 219 NPF events were observed in 285 days of measure-ment. A new method for classification of the events was pro-posed and applied successfully to the data, and 118 and 169 of the events were categorised into class I and II respectively. Nocturnal NPF events were found to account for a surpris-ingly high proportion (30 %) of the total events. Unlike the nocturnal events observed in the literature (Lee et al., 2008), both the class I banana shape and the sudden burst of newly formed particles with no growth (class II) were observed in the PNSD surface plot of the nocturnal events. These events occurred most commonly in March and were found to have higher GR compared to daylight events. CS was calculated and averaged in the period of half an hour before the start of the events, and displayed a weak negative correlation with the GR during both day and nighttime events. In addition, back trajectory analysis revealed that precursors to NPF are being blown in to the Brisbane Metropolitan Area on the east, north-east and south-easterly winds, while the sources of precursors related to daylight events did not appear to dis-play any spatial pattern. This indicates that nocturnal NPF events may have different precursors than daylight nucle-ation. Overall, this study found that nocturnal NPF events were a significant source of ultrafine particles in an urban en-vironment; however, more studies need to be undertaken in order to determine the chemical characterisation of the night-time events and the chemical composition of their precursors.
5 Data availability
528 F. Salimi et al.: Nocturnal new particle formation events
Acknowledgements. This work was supported by the Australian
Research Council (ARC), Department of Transport and Main Roads (DTMR) and Department of Education, Training and Em-ployment (DETE) through linkage grant LP0990134. Sam Clifford wishes to acknowledge the financial support of the Institute for Future Environments (QUT) and NHRMC Centre of Research Excellence for Air quality and health Research and evaluation.
Edited by: V.-M. Kerminen
Reviewed by: two anonymous referees
References
Bae, M.-S., Schwab, J. J., Hogrefe, O., Frank, B. P., Lala, G. G., and Demerjian, K. L.: Characteristics of size distributions at urban and rural locations in New York, Atmos. Chem. Phys., 10, 4521– 4535, doi:10.5194/acp-10-4521-2010, 2010.
Cheung, H. C., Morawska, L., and Ristovski, Z. D.: Observation of new particle formation in subtropical urban environment, At-mos. Chem. Phys., 11, 3823–3833, doi:10.5194/acp-11-3823-2011, 2011.
Clifford, S., Choy, S. L., Hussein, T., Mengersen, K., and Morawska, L.: Using the Generalised Additive Model to model the particle number count of ultrafine particles, Atmos. Environ., 45, 5934–5945, doi:10.1016/j.atmosenv.2011.05.004, 2011. Covert, D., Wiedensohler, A., and Russell, L.: Particle Charging
and Transmission Efficiencies of Aerosol Charge Neutralizes, Aerosol Sci. Technol., 27, 206–214, 1997.
Creamean, J. M., Ault, A. P., Ten Hoeve, J. E., Jacobson, M. Z., Roberts, G. C., and Prather, K. A.: Measurements of Aerosol Chemistry during New Particle Formation Events at a Remote Rural Mountain Site, Environ. Sci. Technol., 45, 8208–8216, doi:10.1021/es103692f, 2011.
Dal Maso, M., Kulmala, M., Lehtinen, K., Mäkelä, J., Aalto, P., and O’Dowd, C.: Condensation and coagulation sinks and formation of nucleation mode particles in coastal and boreal forest bound-ary layers, J. Geophys. Res.-Atmos., 107, PAR 2-1–PAR 2-10, 2002.
Dal Maso, M., Kulmala, M., Riipinen, I., Wagner, R., Hussein, T., Aalto, P. P., and Lehtinen, K. E. J.: Formation and growth of fresh atmospheric aerosols: eight years of aerosol size distribution data from SMEAR II, Hyytiälä, Finland, Boreal Environ. Res., 10, 323–336, 2005.
Dal Maso, M., Sogacheva, L., Aalto, P. P., Riipinen, I., Komppula, M., Tunved, P., Korhonen, L., SUUR-USKI, V., Hirsikko, A., and Kurtén, T.: Aerosol size distribution measurements at four Nordic field stations: identification, analysis and trajectory analy-sis of new particle formation bursts, Tellus B, 59, 350–361, 2007. Delfino, R. J., Sioutas, C., and Malik, S.: Potential role of ul-trafine particles in associations between airborne particle mass and cardiovascular health, Environ. Health Persp., 113, 934–946, doi:10.1289/ehp.7938, 2005.
Deschaseaux, E., Jones, G., and Swan, H.: Dimethylated sulfur compounds in coral-reef ecosystems, Environ. Chem., 13, 239– 251, doi:10.1071/EN14258, 2015.
Dockery, D. W.: Health effects of particulate air pollution, Ann. Epi-demiol., 19, 257–263, 2009.
Dockery, D. W. and Pope, C. A.: Acute respiratory effects of partic-ulate air pollution, Annu. Rev. Publ. Health, 15, 107–132, 1994. Gaston, C. J., Furutani, H., Guazzotti, S. A., Coffee, K. R., Jung, J., Uematsu, M., and Prather, K. A.: Direct Night-Time Ejection of Particle-Phase Reduced Biogenic Sulfur Compounds from the Ocean to the Atmosphere, Environ. Sci. Technol., 49, 4861– 4867, 2015.
Gauderman, W. J., Vora, H., McConnell, R., Berhane, K., Gilliland, F., Thomas, D., Lurmann, F., Avol, E., Kunzli, N., and Jerrett, M.: Effect of exposure to traffic on lung development from 10 to 18 years of age: a cohort study, Lancet, 369, 571–577, 2007. Hamed, A., Joutsensaari, J., Mikkonen, S., Sogacheva, L., Dal
Maso, M., Kulmala, M., Cavalli, F., Fuzzi, S., Facchini, M. C., Decesari, S., Mircea, M., Lehtinen, K. E. J., and Laaksonen, A.: Nucleation and growth of new particles in Po Valley, Italy, Atmos. Chem. Phys., 7, 355–376, doi:10.5194/acp-7-355-2007, 2007.
Han, Y. M., Iwamoto, Y., Nakayama, T., Kawamura, K., Hussein, T., and Mochida, M.: Observation of new particle formation over a mid-latitude forest facing the North Pacific, Atmos. Environ., 64, 77–84, doi:10.1016/j.atmosenv.2012.09.036, 2013.
Hinds, W. C.: Aerosol technology: properties, behavior, and mea-surement of airborne particles, Book, Whole, Wiley, New York, 1999.
Holmes, N. S.: A review of particle formation events and growth in the atmosphere in the various environments and discussion of mechanistic implications, Atmos. Environ., 41, 2183–2201, doi:10.1016/j.atmosenv.2006.10.058, 2007.
Karlsson, M. N. A. and Martinsson, B. G.: Methods to measure and predict the transfer function size dependence of individual DMAs, J. Aerosol Sci., 34, 603–625, 2003.
Kerminen, V.-M., Petäjä, T., Manninen, H. E., Paasonen, P., Niem-inen, T., Sipilä, M., JunnNiem-inen, H., Ehn, M., Gagné, S., Laakso, L., Riipinen, I., Vehkamäki, H., Kurten, T., Ortega, I. K., Dal Maso, M., Brus, D., Hyvärinen, A., Lihavainen, H., Leppä, J., Lehtinen, K. E. J., Mirme, A., Mirme, S., Hõrrak, U., Berndt, T., Stratmann, F., Birmili, W., Wiedensohler, A., Metzger, A., Dommen, J., Baltensperger, U., Kiendler-Scharr, A., Mentel, T. F., Wildt, J., Winkler, P. M., Wagner, P. E., Petzold, A., Minikin, A., Plass-Dülmer, C., Pöschl, U., Laaksonen, A., and Kulmala, M.: Atmospheric nucleation: highlights of the EUCAARI project and future directions, Atmos. Chem. Phys., 10, 10829–10848, doi:10.5194/acp-10-10829-2010, 2010.
Kettle, A., Andreae, M., Amouroux, D., Andreae, T., Bates, T., Berresheim, H., Bingemer, H., Boniforti, R., Curran, M., and DiTullio, G.: A global database of sea surface dimethylsulfide (DMS) measurements and a procedure to predict sea surface DMS as a function of latitude, longitude, and month, Global Bio-geochem. Cy., 13, 399–444, 1999.
Kim, Y., Kim, S.-W., Yoon, S.-C., Park, J.-S., Lim, J.-H., Hong, J., Lim, H.-C., Ryu, J., Lee, C.-K., and Heo, B.-H.: Characteristics of formation and growth of atmospheric nanoparticles observed at four regional background sites in Korea, Atmos. Res., 168, 80–91, 2016.
Kulmala, M. and Kerminen, V.-M.: On the formation and growth of atmospheric nanoparticles, Atmos. Res., 90, 132–150, 2008. Kulmala, M., Vehkamäki, H., Petäjä, T., Dal Maso, M., Lauri, A.,
and growth rates of ultrafine atmospheric particles: a review of observations, J. Aerosol Sci., 35, 143–176, 2004.
Kulmala, M., Petäjä, T., Mönkkönen, P., Koponen, I. K., Dal Maso, M., Aalto, P. P., Lehtinen, K. E. J., and Kerminen, V.-M.: On the growth of nucleation mode particles: source rates of condensable vapor in polluted and clean environments, Atmos. Chem. Phys., 5, 409–416, doi:10.5194/acp-5-409-2005, 2005.
Laiman, R., He, C. R., Mazaheri, M., Clifford, S., Salimi, F., Crilley, L. R., Mokhtar, M. A. M., and Morawska, L.: Char-acteristics of ultrafine particle sources and deposition rates in primary school classrooms, Atmos. Environ., 94, 28–35, doi:10.1016/j.atmosenv.2014.05.013, 2014.
Lee, S. H., Young, L. H., Benson, D. R., Suni, T., Kulmala, M., Jun-ninen, H., Campos, T. L., Rogers, D. C., and Jensen, J.: Obser-vations of nighttime new particle formation in the troposphere, J. Geophys. Res.-Atmos., 113, doi:10.1029/2007JD009351, 2008. Lehtinen, K. E. J., Korhonen, H., Dal Maso, M., and Kulmala, M.:
On the concept of condensation sink diameter, Boreal Environ. Res., 8, 405–411, 2003.
Li, N., Sioutas, C., Cho, A., Schmitz, D., Misra, C., Sempf, J., Wang, M., Oberley, T., Froines, J., and Nel, A.: Ultrafine particu-late pollutants induce oxidative stress and mitochondrial damage, Environ. Health Persp., 111, 455–460, 2003.
Man, H. Y., Zhu, Y. J., Ji, F., Yao, X. H., Lau, N. T., Li, Y. J., Lee, B. P., and Chan, C. K.: Comparison of Daytime and Nighttime New Particle Growth at the HKUST Supersite in Hong Kong, Envi-ron. Sci. Technol., 49, 7170–7178, doi:10.1021/acs.est.5b02143, 2015.
McMurry, P. H., Shepherd, M. F., and Vickery, J. S.: Particulate matter science for policy makers: A NARSTO assessment, Cam-bridge University Press, 2004.
Mejía, J. F. and Morawska, L.: An investigation of nucleation events in a coastal urban environment in the Southern Hemisphere, At-mos. Chem. Phys., 9, 7877–7888, doi:10.5194/acp-9-7877-2009, 2009.
Mejía, J. F., Morawska, L., and Mengersen, K.: Spatial variation in particle number size distributions in a large metropolitan area, Atmos. Chem. Phys., 8, 1127–1138, doi:10.5194/acp-8-1127-2008, 2008.
Ortega, I. K., Suni, T., Boy, M., Grönholm, T., Manninen, H. E., Nieminen, T., Ehn, M., Junninen, H., Hakola, H., Hellén, H., Valmari, T., Arvela, H., Zegelin, S., Hughes, D., Kitchen, M., Cleugh, H., Worsnop, D. R., Kulmala, M., and Kerminen, V.-M.: New insights into nocturnal nucleation, Atmos. Chem. Phys., 12, 4297–4312, doi:10.5194/acp-12-4297-2012, 2012.
Pirjola, L., Kulmala, M., Wilck, M., Bischoff, A., Stratmann, F., and Otto, E.: Formation of Sulphuric Acid Aerosols and Cloud Condensation Nuclei: An Expression for Significant Nucleation and Model Comprarison, J. Aerosol Sci., 30, 1079–1094, 1999. Pope II, C. A. and Dockery, D. W.: Health effects of fine particulate
air pollution: lines that connect, Air Waste Manag. Assoc., 56, 709–742, 2006.
Salimi, F., Mazaheri, M., Clifford, S., Crilley, L. R., Laiman, R., and Morawska, L.: Spatial variation of particle number concentration in school microscale environments and its impact on exposure assessment, Environ. Sci. Technol., 47, 5251–5258, 2013. Salimi, F., Ristovski, Z., Mazaheri, M., Laiman, R., Crilley, L. R.,
He, C., Clifford, S., and Morawska, L.: Assessment and ap-plication of clustering techniques to atmospheric particle
num-ber size distribution for the purpose of source apportionment, Atmos. Chem. Phys., 14, 11883–11892, doi:10.5194/acp-14-11883-2014, 2014.
Salimi, F., Crilley, L. R., Stevanovic, S., Ristovski, Z., Mazaheri, M., He, C., Johnson, G., Ayoko, G., and Morawska, L.: In-sights into the growth of newly formed particles in a subtropi-cal urban environment, Atmos. Chem. Phys., 15, 13475–13485, doi:10.5194/acp-15-13475-2015, 2015.
Salma, I., Németh, Z., Weidinger, T., Kovács, B., and Kristóf, G.: Measurement, growth types and shrinkage of newly formed aerosol particles at an urban research platform, Atmos. Chem. Phys., 16, 7837–7851, doi:10.5194/acp-16-7837-2016, 2016. Shen, L., Wang, H., Lü, S., Li, L., Yuan, J., Zhang, X., Tian,
X., and Tang, Q.: Observation of aerosol size distribution and new particle formation at a coastal city in the Yangtze River Delta, China, Sci. Total Environ., 565, 1175–1184, doi:10.1016/j.scitotenv.2016.05.164, 2016.
Silverman, B. W.: Density estimation for statistics and data analysis, CRC press, 1986.
Solomon, S., Qin, D., Manning, M., Marquis, M., Averyt, K., Tig-nor, M., MILLER, H., and Chen, Z.: Climate Change 2007. The Physical Science basis: Summary for policymakers, Contribution of Working Group I to the Fourth Assessment Report of the Inter-governmental Panel on Climate Change, Climate Change 2007: The Physical Science basis: Summary for policymakers, Contri-bution of Working Group I to the Fourth Assessment Report of the Intergovernmental Panel on Climate Change, 2007. Suni, T., Kulmala, M., Hirsikko, A., Bergman, T., Laakso, L.,
Aalto, P. P., Leuning, R., Cleugh, H., Zegelin, S., Hughes, D., van Gorsel, E., Kitchen, M., Vana, M., Hõrrak, U., Mirme, S., Mirme, A., Sevanto, S., Twining, J., and Tadros, C.: Formation and characteristics of ions and charged aerosol particles in a na-tive Australian Eucalypt forest, Atmos. Chem. Phys., 8, 129–139, doi:10.5194/acp-8-129-2008, 2008.
Svenningsson, B., Arneth, A., Hayward, S., Holst, T., Massling, A., Swietlicki, E., Hirsikko, A., Junninen, H., Riipinen, I., and Vana, M.: Aerosol particle formation events and analysis of high growth rates observed above a subarctic wetland–forest mosaic, Tellus B, 60, 353–364, 2008.
Swan, H. B., Crough, R. W., Vaattovaara, P., Jones, G. B., De-schaseaux, E. S., Eyre, B. D., Miljevic, B., and Ristovski, Z. D.: Dimethyl sulfide and other biogenic volatile organic com-pound emissions from branching coral and reef seawater: poten-tial sources of secondary aerosol over the Great Barrier Reef, J. Atmos. Chem., 73, 303–328, doi:10.1007/s10874-016-9327-7, 2016.
Wand, M. P. and Jones, M. C.: Kernel smoothing, Crc Press, 1994. WHO: Air Quality Guidelines: Global Update 2005: Particulate
Matter, Ozone, Nitrogen Dioxide, and Sulfur Dioxide, World Health Organization Europe, 2005.
530 F. Salimi et al.: Nocturnal new particle formation events
S., Moerman, M., Henzing, B., de Leeuw, G., Löschau, G., and Bastian, S.: Mobility particle size spectrometers: harmonization of technical standards and data structure to facilitate high qual-ity long-term observations of atmospheric particle number size distributions, Atmos. Meas. Tech., 5, 657–685, doi:10.5194/amt-5-657-2012, 2012.
Willeke, K.: Temperature dependence of particle slip in a gaseous medium, J. Aerosol Sci., 7, 381–387, doi:10.1016/0021-8502(76)90024-0, 1976.
Wonaschutz, A., Demattio, A., Wagner, R., Burkart, J., Zikova, N., Vodicka, P., Ludwig, W., Steiner, G., Schwarz, J., and Hitzenberger, R.: Seasonality of new particle forma-tion in Vienna, Austria – Influence of air mass origin and aerosol chemical composition, Atmos. Environ., 118, 118–126, 10.1016/j.atmosenv.2015.07.035, 2015.
Wood, S. N.: Thin plate regression splines, J. Roy. Stat. Soc. B, 65, 95–114, 2003.
Wu, Z., Hu, M., Liu, S., Wehner, B., Bauer, S., Wiedensohler, A., Petäjä, T., Dal Maso, M., and Kulmala, M.: New particle forma-tion in Beijing, China: Statistical analysis of a 1-year data set, J. Geophys. Res.-Atmos., 112, doi:10.1029/2006JD007406, 2007. Yu, F. and Luo, G.: Oceanic dimethyl sulfide emission and new