Isolated and synergistic
effects of PM
10and average
temperature on cardiovascular
and respiratory mortality
Efeitos isolados e sinérgicos do
MP
10e da temperatura média
na mortalidade por doenças
cardiovasculares e respiratórias
I Programa de Pós-Graduação em Patologia. Departamento de Patologia. Faculdade de Medicina. Universidade de São Paulo. São Paulo, SP, Brasil
II Departamento de Patologia. Faculdade de Medicina. Universidade de São Paulo. São Paulo, SP, Brasil
III Department of Environmental Health. Harvard School of Public Health. Boston, MA, United States
Correspondence:
Samya de Lara Lins de Araujo Pinheiro Rua Santa Luíza, 289 apto 201 Maracanã 20550-155 Rio de Janeiro, RJ, Brasil E-mail: [email protected]
Received: 11/2/2013 Approved: 5/23/2014
Article available from: www.scielo.br/rsp
ABSTRACT
OBJECTIVE: To analyze the effect of air pollution and temperature on mortality due to cardiovascular and respiratory diseases.
METHODS: We evaluated the isolated and synergistic effects of temperature and particulate matter with aerodynamic diameter < 10 µm (PM10) on the mortality of individuals > 40 years old due to cardiovascular disease and that of individuals > 60 years old due to respiratory diseases in Sao Paulo, SP, Southeastern Brazil, between 1998 and 2008. Three methodologies were used to evaluate the isolated association: time-series analysis using Poisson regression model, bidirectional case-crossover analysis matched by period, and case-crossover analysis matched by the confounding factor, i.e., average temperature or pollutant concentration. The graphical representation of the response surface, generated by the interaction term between these factors added to the Poisson regression model, was interpreted to evaluate the synergistic effect of the risk factors.
RESULTS: No differences were observed between the results of the case-crossover and time-series analyses. The percentage change in the relative risk of cardiovascular and respiratory mortality was 0.85% (0.45;1.25) and 1.60% (0.74;2.46), respectively, due to an increase of 10 μg/m3 in the PM
10 concentration. The pattern of correlation of the temperature with cardiovascular mortality was U-shaped and that with respiratory mortality was J-shaped, indicating an increased relative risk at high temperatures. The values for the interaction term indicated a higher relative risk for cardiovascular and respiratory mortalities at low temperatures and high temperatures, respectively, when the pollution levels reached approximately 60 μg/m3.
CONCLUSIONS: The positive association standardized in the Poisson regression model for pollutant concentration is not confounded by temperature, and the effect of temperature is not confounded by the pollutant levels in the time-series analysis. The simultaneous exposure to different levels of environmental factors can create synergistic effects that are as disturbing as those caused by extreme concentrations.
DESCRIPTORS: Particulate Matter, adverse effects.
Temperature. Cardiovascular Diseases, mortality. Respiratory Tract Diseases, mortality. Air Pollution. Time Series Studies.
Samya de Lara Lins de Araujo PinheiroI
Paulo Hilário Nascimento SaldivaII
Joel SchwartzIII
Climate change affects human health through a variety of factors and mechanisms.13 Air temperature is relevant to public health even in developed countries. Extreme temperature events, such as heat waves and cold spells, are a direct cause of mortality.5,12,14 A study that analyzed mortality data from Catalonia, Spain, between 1983 and 2006, indicated a 19.0% increase in total daily mortality during three consecutive days of extreme heat.4 Large metropoles, including Sao Paulo, experience remarkable increases in the population necessitating urgent medical care after experiencing intense and long-lasting periods of extreme air moisture.9,22 Similarly, tropical storms and changes in the rainfall patterns cause structural damage and changes in the patterns of infectious diseases.8,11
Air pollution is also responsible for climate change. However, atmospheric concentrations of
RESUMO
OBJETIVO: Analisar o efeito da poluição do ar e da temperatura na mortalidade por doenças cardiovasculares e respiratórias.
MÉTODOS: Foram analisados os efeitos da temperatura e do material particulado com diâmetro aerodinâmico < 10 micrômetros (MP10), isolado e sinérgico, na mortalidade de indivíduos > 40 anos por doenças cardiovasculares e na mortalidade de indivíduos > 60 anos por doenças respiratórias em São Paulo, SP, entre 1998 e 2008. Três tipos de metodologias foram aplicadas para avaliar a associação isolada: análise de séries temporais com regressão de Poisson, análise case-crossover com pareamento temporal bidirecional e análise case-crossover com pareamento pelo fator confundidor, i.e.,
temperatura média ou poluente. Foi interpretada a representação gráica da superfície
resposta, gerada por termo de interação entre tais fatores adicionado à regressão de Poisson, para avaliar o efeito sinérgico entre os fatores de risco.
RESULTADOS: Não foram observadas diferenças entre os resultados das análises case-crossover e de séries temporais. Estimou-se mudança percentual no risco relativo para mortalidade cardiovascular e respiratória de 0,85% (0,45;1,25) e 1,60% (0,74;2,46), respectivamente, devido ao aumento de 10 μg/m3 na concentração do MP
10. O padrão de associação da temperatura para mortalidade cardiovascular foi de U-shape e para mortalidade respiratória foi de J-shape, representando maior risco relativo em
temperaturas altas. As iguras do termo de interação indicaram maior risco relativo
em baixas temperaturas para mortalidade cardiovascular e em altas temperaturas para mortalidade respiratória em níveis de poluição em torno de 60 μg/m3.
CONCLUSÕES: A associação positiva parametrizada no modelo de regressão de Poisson para os poluentes não sofre confusão da temperatura, bem como o efeito da temperatura não sofre confusão dos níveis de poluentes na análise de séries temporais. A simultaneidade de exposição a diferentes níveis de fatores ambientais pode gerar condições de efeito combinado, tão preocupantes quanto as de extremas concentrações.
DESCRITORES: Material Particulado, efeitos adversos. Temperatura Ambiente. Doenças Cardiovasculares, mortalidade. Doenças Respiratórias, mortalidade. Poluição do Ar. Estudos de Séries Temporais.
INTRODUCTION
particulate matter and gases are also associated with health outcomes,15,18,24 which may become more frequent and intense in the population due to the effect of adverse weather conditions and air quality.5,7,12 Furthermore, cardiorespiratory morbidity and mortality
are signiicantly associated with both factors.
The characterization of the role of each risk factor helps elucidate the mechanisms involved and implement mitigation and control strategies. However, exposure to pollution and weather conditions occurs simulta-neously. Therefore, in addition to their isolated effects, the interaction between these factors must be evalu-ated by determining whether they act as effect
modi-iers. The combination of these risk factors can follow
deine more realistic risk estimates, and establish new
guidelines for public health.
This study aimed to examine the effect of both air pollu-tion and temperature on mortality due to cardiovascular and respiratory diseases.
METHODS
Daily mortality data available in the Programa de Aprimoramento das Informações de Mortalidade (PRO-AIM – Program for the Improvement of Data on Mortality) of Sao Paulo were selected for the
basic causes deined according to the International Classiication of Diseases no. 10 (ICD-10). Data on
mortality due to respiratory causes (ICD-10-X) were selected for individuals > 60 years old and that due to cardiovascular causes (ICD-10-IX) were selected for individuals > 40 years old between 1998 and 2008.
A crossover approach with different types of case-control matching was used. We aimed to better charac-terize the isolated effect of each risk factor using controls that were intrinsic to the study design and without param-eterization. The variability of the mortality rates in the case-crossover analyses was compared between the days of the same month with some similar characteristic, e.g., same day of the week or days with similar temperature values. Therefore, it was ensured that the variability of
the outcome was not because of the inluence of this
variability, and the inclusion of terms to control this variability in the model was unnecessary, as occurs in traditional time-series analyses.
The traditional time-series analysis was also applied. The comparison of the results of the traditional time-series analysis with those of the case-crossover analysis allowed us to examine whether the parameterizations adjusted in the traditional models for factors such as pollution and temperature were accurate or because of confounding factors in the model. The synergistic effects between pollution and temperature were analyzed using response surface analysis of the terms of interaction between the variables, and these terms were added to the Poisson regression model for the time series.
Meteorological parameters were provided by the meteorological station of the Instituto de Astronomia, Geofísica e Ciências Atmosféricas da Universidade de São Paulo (IAG-USP – Institute of Astronomy, Geophysics, and Atmospheric Sciences, University of Sao Paulo). Daily maximum temperature data (°C), average temperature (°C), and minimum relative humidity (%) were obtained for the years evaluated.
Air quality data were provided by the Companhia de Tecnologia de Saneamento Ambiental (CETESB – Environmental Sanitation Technology Company). We used daily average values for particulate matter with diameter < 10 µm (PM10) from datasets provided by the
air quality stations located in Diadema, Santana, down-town, Sao Miguel Paulista, and Pinheiros. CETESB has 14 air quality stations that automatically monitor PM10 levels in the city of Sao Paulo. However, the number and
spatial coniguration of this network varied considerably
over the period evaluated. One station was used in each region of the city, including one in the downtown area, and these stations provided valid data for most of the period evaluated. However, the Parelheiros station was operational at the time of study but its dataset had many gaps and inconsistent observations. Considering that no other station in the Southern region was available during the entire study period, we used data from the Diadema station, which is the neighboring city close to the capital.
During the 11-year study period, not all the 4,018 days covered in the mortality and meteorological datasets were analyzed because of the unavailability of data on air pollution, resulting in a decrease of 13.8% in the data evaluated. The descriptive analysis of variables was performed to characterize their context. We used
two main statistical methods to investigate the speciic
effect of environmental factors on mortality.
Poisson regression analysis was used in generalized additive models to iteratively determine the best struc-ture, linearity, association between mortality and
envi-ronmental variables, and to deine the best control for
seasonality as well as long-term tendencies. The loga-rithm of the number of deaths was dependent on the risk and on the confounding factors described using linear or spline functions, as described by Curriero et al.7
Different time lags and moving averages of the explanatory variables were tested. The selection of the most appropriate model structures, i.e., meteorological parameters, lags, and adjusted functions that should be used, was based on the minimization of the Akaike information criterion (AIC)1 and maximization of the explained variance of the model.
Seasonality was controlled by the inclusion of a non-parametric spline function to a days-elapsed vari-able. Other temporal tendencies were controlled by intro-ducing variables for weekdays and holidays in the model.
We compared the results of the time-series analysis with
those of case-crossover analysis stratiied by time, temper -ature, or pollutant concentration, using conditional logistic regression models. The case-day exposure was compared with the control-day exposure (period immediately before and after the case-day) by applying the case-crossover methodology, which is a variation of the case-control approach.6 Using this approach, it is possible to intrinsi-cally control for several invariable confounding factors in the short-term in addition to the control for seasonality. When the control-days are selected in the same month by the approximate value of one of the explanatory variables, i.e., temperature or pollution concentration, this factor can also be controlled without the need for the inclusion of terms or functions for model parameterizations.21
This comparative analysis allowed the validation of the results of the Poisson regression analysis. When the case-crossover analysis is matched by period (weekday and month), it generates estimates without confounding factors related to time, weekday, and seasonality. When the case-crossover analysis is matched by period and temperature, estimates are obtained for the association of pollutant concentra-tion without confounding factors related to tempera-ture, which is similar to the time-pollutant matching. If the associations estimated in the traditional analysis using Poisson regression are similar to those estimated in the case-crossover analysis, the parameterizations adjusted in the traditional model captures the effect of each risk factor without confounding it with the effect of other factors. The effect of temperature or season-ality is not attributed to the pollutant concentration.21
Control-days were selected in the same month and weekday of the case-day, even for months with similar temperature, i.e., 1°C above or below the rounded temperature value of the case-day, or even for months with similar pollutant concentration, i.e., 2 μg/m3 above or below the rounded concentration value of the case-day for case-crossover matching. Linear terms for PM10, spline function with four degrees of freedom for temperature and control for weekday were included when necessary. In addition, we controlled
for relative humidity and used the same variables selected in the previous time-series analysis on all models.
The association between the outcome and pollutant concentration generated a β-coeficient and a response curve for temperature in each analysis (traditional, temporal case-crossover, and time-temperature/ pollutant concentration stratified case-crossover). We calculated the percentage change in mortality for every variation of the risk factor using the equation (expβ*Δ- 1) × 100%. The percentage changes in the rela-tive risk were calculated to estimate both the effect of pollutant concentration on mortality due to the increase of 10 μg/m3 in the PM
10 concentration and their coni -dence intervals. We extracted the function adjusted for the models to estimate the dose-response association between mortality and temperature, and graphically represented the percentage change in the relative risk due to the variation of 1°C as a function of the metrics of the selected temperature.
The interaction effect between temperature and pollu-tion concentrapollu-tion was characterized by response surface analysis of the interaction term between these variables. This term was included in the additive models generalized in Poisson regression and controlled for seasonality, weekday, holidays, and relative humidity.
Analyses were performed using R software version 3.0.2. The gam() function was used for the traditional analysis and coxph() function was used for the conditional logistic
regres-sion analysis, and a signiicance level of ≤ 0.05 was adopted.
RESULTS
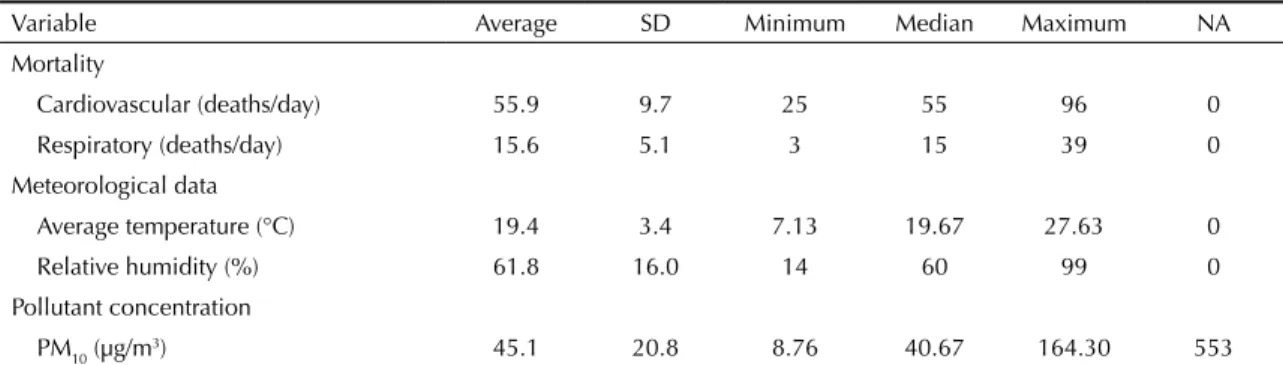
The average temperature was selected as the best parameter to represent the effect of temperature on the models and the maximum and minimum values were 27.63°C and 7.13°C, respectively (Table 1).
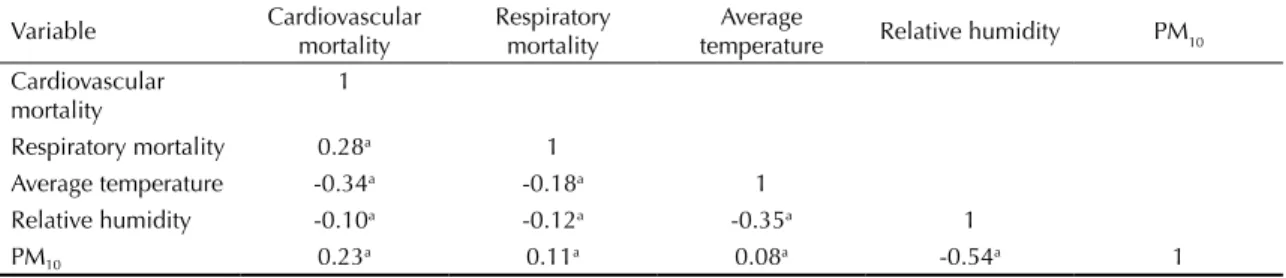
All study variables were essentially correlated (Table 2). The cardiovascular mortality showed a higher corre-lation with temperature and pollutant concentration
Table 1. Descriptive analysis of the study variables. Sao Paulo, Southeastern Brazil, 1998-2008.
Variable Average SD Minimum Median Maximum NA
Mortality
Cardiovascular (deaths/day) 55.9 9.7 25 55 96 0
Respiratory (deaths/day) 15.6 5.1 3 15 39 0
Meteorological data
Average temperature (°C) 19.4 3.4 7.13 19.67 27.63 0
Relative humidity (%) 61.8 16.0 14 60 99 0
Pollutant concentration
PM10 (µg/m3) 45.1 20.8 8.76 40.67 164.30 553
Source: Programa de Aprimoramento de Informações de Mortalidade da Prefeitura do Município de São Paulo (PROAIM); Companhia de Tecnologia de Saneamento Ambiental (CETESB); Instituto de Astronomia e Geofísica da Universidade de São Paulo (IAG).
Table 2. Pearson correlation between mortality and environmental variables. Sao Paulo, Southeastern Brazil, 1998-2008.
Variable Cardiovascular
mortality
Respiratory mortality
Average
temperature Relative humidity PM10
Cardiovascular mortality
1
Respiratory mortality 0.28a 1
Average temperature -0.34a -0.18a 1
Relative humidity -0.10a -0.12a -0.35a 1
PM10 0.23a 0.11a 0.08a -0.54a 1
PM10: particulate matter a p < 0.05
compared to the respiratory mortality. The average temperature and relative humidity were negatively correlated with mortality, whereas the pollutant concen-tration was positively correlated with health outcomes. The sign of the Pearson correlation index indicated a positive correlation between mortality and PM10 and a negative correlation between mortality and temperature. Pollutant concentration and relative humidity showed
the most signiicant negative correlation, relecting the
mechanical removal of many particles on rainy days, which consequently had higher relative humidity.
The percentage change in the relative risk of mortality due to the increase of 10 μg/m3 in the PM
10 concen-tration was positive and signiicant in all analyses
(Figure 1). The case-crossover analysis matching time yielded estimates of 0.85% (0.45;1.25) for cardiovascular mortality, which is consistent with the time-series methodology (0.64%; 0.29;1.00). The
case-crossover matching time and temperature esti-mates (0.67%; 0.21;1.12) proved to be less accurate.
When estimating the effect of PM10 on respiratory mortality, a gradual increase in the result between the methodologies used was observed (Figure 1). The lowest value was esti-mated using the time-series approach (0.8%; 0.14;1.47). The
irst case-crossover analysis showed results consistent with
the previous analysis (1.0%; 0.24;1.73). However, the esti-mate of the case-crossover analysis matching temperature, although consistent with other PM10 estimates, showed a greater effect (1.6%; 0.74;2.46).
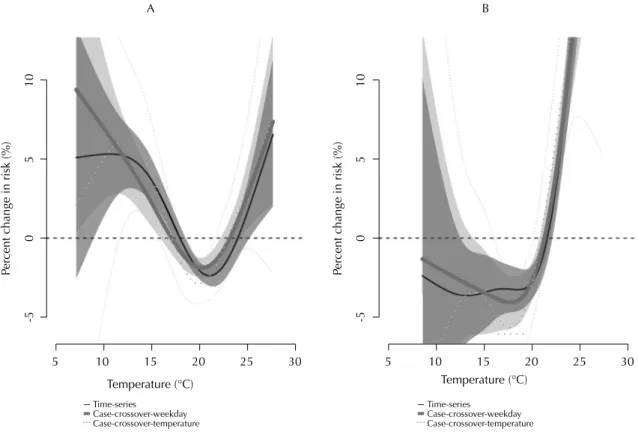
The average temperature of the corresponding day was used in the models for assessing cardiovascular mortality whereas the two-day moving average of the average temperature was used for assessing respiratory mortality. Furthermore, the results of the three statis-tical approaches were consistent (Figure 2).
-0.5
0
0.5
1
1.5
2
Time-series
Case-crossover-weekday Case-crossover-temperature
Cardiovascular mortality
Pe
rcent c
hange (%)
Respiratory mortality
Figure 1. Percentage change in the relative risk for every increase of 10 µg/m3 in the PM
The iterative process deined in each case, the number of
degrees of freedom of the dose-response surface for the association between mortality, and the interaction between temperature and particulate matter in the interaction
5
-5
05
10
-5
05
10
10 15 20
Temperature (°C)
Time-series
Case-crossover-weekday Case-crossover-temperature
Pe
rcent c
hange in risk (%)
Pe
rcent c
hange in risk (%)
Temperature (°C)
25 30
5 10 15 20 25 30
Time-series
Case-crossover-weekday Case-crossover-temperature
Figure 2. Smoothing functions for average temperatures (cardiovascular mortality): (A) two-day moving average of average temperature (respiratory mortality), (B) confidence intervals; controlled for PM10. Sao Paulo, Southeastern Brazil, 1998-2008.
terms are illustratively represented (Figure 3). The linear tendency expected for the association between PM10 and
mortality was inluenced by the effect of temperature,
generating surfaces that were more complex.
log
(risco relat
ivo
)
PM10 (µg/m
3)
0.25 0.20 0.15 0.10 0.05 0.00 -0.05 -0.10
20 10
15 20
25
4060 80100
120140 160
Temper ature (ºC)
log
(r
isco relati
vo)
g
PM10 (µg/m
3)
0.25 0.20 0.15 0.10 0.05 0.00 -0.05 -0.10
20 10
15 20
25
4060 80100
120140 160
Temper ature (ºC)
log
(relati
ve
risk)
PM10 (µg/m
3)
0.25
0.20
0.15
0.10
0.05
0.00
20 10
15 20
25
4060 80100
120140 160
Temper ature (ºC)
B A
Figure 3. 3D dose-response surface for the interaction between pollutant concentration (PM10) and temperature: (A) cardiovascular mortality, (B) respiratory mortality. Sao Paulo, Southeastern Brazil, 1998-2008.
DISCUSSION
Results of the case-crossover and time-series anal-yses were similar, indicating that the parameter-izations adjusted in the time-series model were effective in determining the impact of tempera-ture and pollutant concentration on mortality. The percentage change in the relative risk of cardiovas-cular mortality estimated using a case-crossover analysis with temporal matching and the change in the relative risk of respiratory mortality estimated using a case-crossover analysis with temperature matching was about of 0.85% (0.45;1.25) and 1.60% (0.74;2.46), respectively, due to the increase of 10 μg/m3 in the PM
10 concentration. The pattern of association of temperature with cardiovascular mortality was U-shaped, whereas that with respira-tory mortality was J-shaped, indicating increased relative risk at high temperatures. Considering the effect of the interaction between temperature and pollutant concentration, there is a high association under low temperatures on cardiovascular mortality, as well as that under high temperatures on respira-tory mortality where the pollutant concentration is approximately 60 μg/m3.
T h e p o s i t i v e a s s o c i a t i o n b e t w e e n P M1 0 a n d mortality has been previously reported in Sao Paulo and other cities in Latin America and overseas. Saldiva19 reported this positive association with mortality among individuals > 65 years old in 1995. The multi-city project Estudio de Salud del Aire y Contaminación en Latinoamérica (ESCALA)17 reported a consolidated increase in the relative risk of cardiovascular and respiratory mortalities of 0.7% and 1.2%, respectively, for all age groups. Similar results were found for individuals > 65 years in all of the cities evaluated, including Sao Paulo, between 2006 and 2009.
The association between temperature and mortality has presented more varied patterns in the literature from linear correlations to curves with J, U, and V forms.2,3,23 Gouveia et al10 addressed the correla-tion between all-cause mortality and temperature in the city of Sao Paulo between 1992 and 1994. The U-shaped pattern was identified as the most representative and parameterization was consid-ered linear for the cold weather and linear for the hot weather initiating from an optimum temperature of 20°C. The association with respiratory mortality was higher at lower temperatures but these find-ings differ from our results. Sharovsky7 reported similar results for the pattern of correlation between mortality from myocardial infarction and temper-ature; the temperature of minimum relative risk corresponded to 21.6ºC-22.6ºC.
The selection of control-days according to the temper-ature (tempertemper-ature-time matching) or according to the pollutant concentration (time-concentration matching) yielded values similar to those calcu-lated with two other analyses, the traditional time-series, and case-crossover with temporal matching. Therefore, the positive association between these factors and mortality was not the effect of the confounding factor used in matching.21 Therefore, the case-crossover methodology is an alternative to the time-series analysis. This avoids the use of parameterization functions for controlling, which must often be user-defined. Similarly, the case-cross-over methodology validates the results of Poisson regression models.
We introduced an interaction term between pollutant concentration and temperature in the Poisson regres-sion model to identify the isolated effect of each factor and how the combination of effects occurs. The values generated do not provide easily interpretable estimates for the relative risk but indicate the interactive effect of these factors.
The dose-response surface of the exposure to temperature and particulate matter showed no change in the effect on respiratory mortality. The relative risk of cardiovascular mortality was lower for median concentrations (approximately 40 μg/m3) when combined with median tempera-tures. The risk at high temperatures was higher than that found at low temperatures in this concentra-tion range. Ren16 used a similar model in Australia to determine the synergistic effects of PM10 and temperature and identified decreases for certain concentration ranges.
The scenario of exposure to environmental risk factors is complex. Other confounders and effect modifiers that are proven to affect associations, including socioeconomic status, demographic developments in long-term studies, and use of air conditioning,7,20 were not considered in this analysis. Individual-based studies that address the same types of questions can complement the understanding of this dynamics, among many other factors, so that policymakers can plan mitigation actions that are more effective and multisectoral based on consolidated data.
ACKNOWLEDGMENTS
Research supported by the Coordenação de Aperfeiçoamento de Pessoal de Nível Superior (CAPES – Process BEX 4965/10-8) and by the Conselho Nacional de Desenvolvimento Científico e Tecnológico (CNPq – 57813/2008-6).
Presented at the 26th Annual International Society for Environmental Epidemiology Conference held in Seattle in 2014. Based on the PhD thesis of Pinheiro SLLA, entitled: “Clima e mortalidade: uma abordagem observacional ecológica na cidade de São Paulo”, presented at the Graduate Program in Pathology at the Faculdade de Medicina of the Universidade de São Paulo in 2014.
The authors declare no conflict of interest.
1. Akaike H. A new look at the statistical identification problem. IEEE Trans Auto Control. 1974;19:716-23.
2. Alam N, Lindeboom W, Begum D, Streatfield PK. The association of weather and mortality in Bangladesh from 1983-2009. Glob Health Action. 2012;5:53-60.
3. Armstrong B. Models for the relationship between ambient temperature and daily mortality. Epidemiology. 2006;17(6):624-31. DOI:10.1097/01.ede.0000239732.50999.8f
4. Basaga-a X, Sartini C, Barrera-Gómez J, Dadvand P, Cunillera J, Ostro B, et al. Heat waves and cause-specific mortality at all ages. Epidemiology. 2011;22(6):765-72. DOI:10.1097/EDE.0b013e31823031c5
5. Basu R, Samet JM. Relation between elevated ambient temperature and mortality: a review of the epidemiologic evidence. Epidemiol Rev. 2002;24(2):190-202. DOI:10.1093/epirev/mxf007
6. Bateson TF, Schwartz J. Selection bias and confounding in case- crossover analyses of environmental
time-series data. Epidemiology. 2001;12(6):654-61. DOI:10.1097/00001648-200111000-00013
7. Curriero FC, Heiner KS, Samet JM, Zeger SL, Strug L, Patz JA. Temperature and mortality in 11 cities of the eastern United States. Am J Epidemiol. 2002;155(1):80-7. DOI:10.1093/aje/155.1.80
8. Descloux E, Mangeas M, Menkes CE, Lengaigne M, Leroy A, Tehei T, et al. Climate-based models for understanding and forecasting dengue epidemics. PLoS Negl Trop Dis. 2012;6(2):e1470. DOI:10.1371/journal.pntd.0001470
9. Freitas C, Bremner SA, Gouveia N, Pereira LAA, Saldiva PHN. Hospital admissions and mortality: association with air pollution in São Paulo, Brazil, 1993 to 1997. Rev Saude Publica. 2004;38(6):751-7. DOI:10.1590/S0034-89102004000600001
10. Gouveia N, Hajat S, Armstrong B. Socioeconomic differentials in the temperature-mortality relationship in São Paulo, Brazil. Int J Epidemiol. 2003;32(3):390-7. DOI:10.1093/ije/dyg077
11. Hunter PR. Climate change and waterborne and vector-borne disease. J Appl Microbiol. 2003;94Suppl:37-46. DOI:10.1046/j.1365-2672.94.s1.5.x
12. Martens WJ. Climate change, thermal stress and mortality changes. Soc Sci Med. 1998;46(3):331-4. DOI:10.1016/S0277-9536(97)00162-7
13. Patz JA, McGeehin MA, Bernard SM, Ebi KL, Epstein PR, Grambsch A, et al. The potential health impacts of climate variability and change for the United States:
executive summary of the report of the health sector of the U.S. National Assessment. Environ Health Perspect. 2000;108(4):367-76. DOI:10.1289/ehp.00108367
14. Patz JA, Engelberg D, Last J. The effects of changing weather on public health. Annu Rev Public Health. 2000;21:271-307. DOI:10.1146/annurev.publhealth.21.1.271
15. Pope CA 3rd. What do epidemiologic findings tell us about health effects of environmental aerosols? J Aerosol Med. 2000;13(4):335-54. DOI:10.1089/jam.2000.13.335
16. Ren C, Tong S. Temperature modifies the health effects of particulate matter in Brisbane, Australia. Int J Biometeorol. 2006;51(2):87-96. DOI:10.1007/s00484-006-0054-7
17. Romieu I, Gouveia N, Cifuentes LA, Leon AP, Junger W, Vera J, et al. Multicity study of air pollution and mortality in Latin America (the ES- CALA study). Res Rep Health Eff Inst. 2012;(171):5-86.
18. Rückerl R, Schneider A, Breitner S, Cyrys J, Peters A. Health effects of particulate air pollution: A review of epidemiological evidence. Inhal Toxicol. 2011;23(10):555-92. DOI:10.3109/08958378.2011.593587
19. Saldiva PH, Pope CA 3rd, Schwartz J, Dockery DW, Lichtenfels AJ, Salge JM, et al. Air pollution and mortality in elderly people: a time-series study in Sao Paulo, Brazil. Arch Environ Health. 1995;50(2):159-63. DOI:10.1080/00039896.1995.9940893
20. Schwartz J. Assessing confounding, effect modification, and thresholds in the association between ambient particles and daily deaths. Environ Health Perspect. 2000;108(6):563-8. DOI:10.1289/ehp.00108563
21. Schwartz J. The effects of particulate air pollution on daily deaths: a multi- city case crossover analysis. Occup Environ Med. 2004;61(12):956-61. DOI:10.1136/oem.2003.008250
22. Sharovsky R, César LAM, Ramires JAF. Temperature, air pollution, and mortality from myocardial infarction in São Paulo, Brazil. Braz J Med Biol Res. 2004;37(11):1651-7. DOI:10.1590/S0100-879X2004001100009
23. Stafoggia M, Schwartz J, Forastiere F, Perucci CA, SISTI Group. Does temperature modify the association between air pollution and mortality? A multicity case-crossover analysis in Italy. Am J Epidemiol. 2008;167(12):1476-85. DOI:10.1093/aje/kwn074
24. Veras MM, Caldini EG, Dolhnikoff M, Saldiva PHN. Air pollution and effects on reproductive-system functions globally with particular emphasis on the Brazilian population. J Toxicol Environ Health B Crit Rev. 2010;13(1):1-15. DOI:10.1080/10937401003673800