Floral parts of
Gomphrena globosa
L. as a novel alternative source of
betacyanins: Optimization of the extraction using response surface
methodology
Custódio Lobo Roriz
a,b, Lillian Barros
a,c,⇑, M.A. Prieto
a,d, Patricia Morales
b, Isabel C.F.R. Ferreira
a,⇑ aMountain Research Centre (CIMO), ESA, Polytechnic Institute of Bragança, Campus de Santa Apolónia, Apartado 1172, 5300-253 Bragança, PortugalbDpto. Nutrición y Bromatología II, Facultad de Farmacia, Universidad Complutense de Madrid (UCM), Plaza Ramón y Cajal, s/n, E-28040 Madrid, Spain
cLaboratory of Separation and Reaction Engineering – Laboratory of Catalysis and Materials (LSRE-LCM), Polytechnic Institute of Bragança, Campus de Santa Apolónia, 1134, 5301-857 Bragança, Portugal
dNutrition and Bromatology Group, Faculty of Food Science and Technology, University of Vigo, Ourense Campus, E32004 Ourense, Spain
a r t i c l e
i n f o
Article history:
Received 12 December 2016
Received in revised form 11 February 2017 Accepted 15 February 2017
Available online 20 February 2017
Keywords:
Gomphrena globosaL. Food colorants Betacyanins extraction Optimization
Response surface methodology
a b s t r a c t
The present study describes a novel mechanical process for the pigmented parts ofGomphrena globosa L. The effects of the variables of the maceration extraction of betacyanins have not been properly described. Therefore, this study also aims to optimize the conditions that maximize betacyanins extraction from G. globosaas an alternative source. Assisted by response surface methodology, an experimental design was developed for testing the extraction variables (time, temperature, ethanol-water proportion and solid-liquid ratio). The responses used were betacyanins quantification (by HPLC-PDA-MS/ESI and spectrophotometric analysis), the extraction-yield and the colour intensity of the produced powder. The betacyanins identified were gomphrenin and isogomphrenin II and III. The highest betacyanins content (45 mg/g) was obtained by 165 min, 25°C, 0% of ethanol and 5 g/L of solid-liquid ratio. The betacyanins content from the floral parts ofG. globosais higher than those normally found in other sources highlighting its industrial application.
Ó2017 Elsevier Ltd. All rights reserved.
1. Introduction
Colour is often the first sensory quality by which we judge all the things that surrounds us including food and food products. Col-orants have been used for a long time in the food industry, and the major reason is to improve the attractive and appetizing of foods for the final consumer (Chen, Mou, Hou, Riviello, & Ni, 1998). This kind of additives are also used to compensate the colour loss due to the conditions of manufacturing and storage, enhance natural col-our, provide colour to a colourless food, but also to allow the con-sumers to identify some products by sight (González, Gallego, & Valcárcel, 2002).
Food dyes or colorants can be classified as natural (or nature-identical) or synthetic; natural dyes when compared with the syn-thetic ones have a lower tinctorial strength, and are more sensitive to environmental conditions such as light, temperature, pH, among others. Due to their potential harmful features, the usage of most synthetic pigments has been restricted, becoming extremely
important the application of natural colorants in the food industry (Amchova, Kotolova, & Ruda-Kucerova, 2015; Martins, Roriz, Morales, Barros, & Ferreira, 2016). This relates not only to the restrictions in using synthetic dyes, but also to the need to satisfy consumers, which over time become more and more demanding about the quality of the products they are purchasing.
Today, most consumers prefer foods without additives or with natural additives in place of the synthetic ones, which have been associated with some toxic effects (Gengatharan, Dykes, & Choo, 2015). There are many natural dyes used in the food industry, in particular carotenoids, anthocyanins and betalains. The betalains are very similar to the anthocyanins, and include compounds hav-ing colours ranghav-ing from red-violet (betacyanins) to yellow-orange (betaxanthins) (Carocho, Morales, & Ferreira, 2015). Betacyanin structures have some variations in the acyl groups and sugar moi-eties; the basic structural unit of most of the betacyanins is betani-din, followed by its C15 epimer, so a considerable number of
different betacyanins can be obtained by glycosylation of one of the hydroxyl groups (Delgado-Vargas, Jiménez, & Paredes-López, 2000).
Table 1 shows a bibliographic summary of betalains content from different plant materials. Among the various sources of
http://dx.doi.org/10.1016/j.foodchem.2017.02.073
0308-8146/Ó2017 Elsevier Ltd. All rights reserved.
⇑ Corresponding authors at: Mountain Research Centre (CIMO), ESA, Polytechnic Institute of Bragança, Campus de Santa Apolónia, Apartado 1172, 5300-253 Bragança, Portugal (L. Barros and I.C.F.R. Ferreira).
E-mail addresses:[email protected](L. Barros),[email protected](I.C.F.R. Ferreira).
Contents lists available atScienceDirect
Food Chemistry
Table 1
Bibliographic summary of betacyanins content from different source materials using maceration extraction techniques and different conditions.
Source material Plant part Extraction conditions Total content Main compound Reference
Solvent Temperature Time
– (°C) (min) (mg/g)
Beta vulgarisL. cv. Detroit Dark Red Fresh hairy roots Ethanol:Water (50:50) – – 9.6a Betanin Pavlov and Bley (2006)
Beta vulgarisL. cv. (Cardeal-F1, Egyptian, Bicor, Kestrel)
Pomace Ethanol:Water (50:50) – 30 0.62 to 1.99a Betanin, Isobetanin Vulic´ et al. (2012)
Disphyma australe(W. T. Aiton) Fresh leaf Methanol 4 60 2.23a Lampranthin II Jain and Gould (2015)
Phytolacca americanaL. Fruits Acidified Water – – 0.79a Betanin Jerz, Skotzki, Fiege,
Winterhalter, and Wybraniec (2008) Amaranthus hypochondriacusL. Leaves, stalks, seeds, flower Methanol:Water (80:20) 25 900 0.07 to 16.90 Amaranthine Li et al. (2015)
Iresine herbstiiHook. ex Lindl. Leaves Water – – 1.54a Iresinin I Jerz et al. (2014)
Celosia argenteaL. Leaf Methanol:Water (80:20) – – 1.42a Betanin Mastuti, Arumingtyas, and
Fatinah (2015)
Gomphrena globosaL. Inflorescences Methanol 100 5 0.47a Isogomphrenin III Silva et al. (2012)
Inflorescences Water 25 30 2.10a Isogomphrenin III Silva et al. (2012) Talinum triangulare(Jacq.) Willd Leaf, stem, flower Methanol:Water (80:20) – 30 0.06 to 4.13b Betanin Swarna, Lokeswari, Smita,
and Ravindhran (2013)
Mesembryanthemum crystallinumL. Leaf tips Methanol:Water (50:50) – – 6.02a Betanin Vogt et al. (1999)
Amaranthus caudatusL. Leaves, stalks, seeds, flower, spouts
Methanol:Water (80:20) 25 900 0.96 to 20.93a Amaranthine Li et al. (2015)
Hylocereus polyrhizus(Weber) Britton & Rose Fruits Ethanol:Water (80:20) – 30 0.79a Phyllocactin Taira, Tsuchida, Katoh, Uehara, and Ogi (2015)
Amaranthus cruentusL. Stalks, seeds Methanol:Water (80:20) 25 900 0.23 to 0.56a Amaranthine Li et al. (2015)
Celosia argenteavar. cristata (L.) Kuntze Inflorescences, Leaf, Epidermal Layers of stem
Methanol:Water (80:20) – 30 1.34 to 3.16a Amaranthin Schliemann, Cai, Degenkolb, Schmidt, and Corke (2001) Celosia argenteavar. plumosa (Burvenich) Voss Inflorescences Methanol:Water (80:20) – 30 1.23a Betaxanthins Schliemann et al. (2001)
Beta vulgarisL. var. conditiva Alef., cv. Piatta d’Egitto Root Methanol – – 0.28 to 0.53b – Stagnari, Galieni, Speca, and
Pisante (2014)
amg/g of dry weight. b mg/g of fresh weigh.
C.L.
Roriz
et
al.
/Food
Chemistry
229
(2017)
betalains, the most explored one is red beet (Beta vulgarisL.), due to its very high concentration in these pigments (Nemzer et al., 2011), but there are less explored alternative sources, such as flow-ers from the amaranthaceae family,Gomphrena globoseL. Native to Latin America and commonly known as globe amaranth, this plant contains a variety of compounds with biological activity, being betacyanins one of them. Therefore, this plant is a good candidate as an alternative source to obtain the mentioned pigments (Roriz, Barros, Carvalho, Santos-Buelga, & Ferreira, 2014).
Different solid-liquid systems (maceration, microwave, ultra-sound, among many others) are available for the extraction of com-pounds. There is not a universal approach better than the others, focussing in reducing the time of extraction, amount of solvents, the energy costs and the degradation patterns (Alonso-Salces et al., 2001; Dai & Mumper, 2010; Ince, Sßahin, & Sßümnü, 2013). Betacyanins are generally extracted by maceration extraction tech-nique with water as the main solvent, but aqueous organic solvent mixtures have shown certain improvements in the final extractions yields obtained. Maceration extraction is a conventional method easily transferable to industrial scale and traditionally used in the extraction of bioactive compounds. The main advantage is its sim-plicity, but if the variables are not properly optimized, very often requires long time periods and high temperatures resulting in high-energy costs and bioactive compounds degradation.
The maceration extraction depends on several process variables whose values cannot be generalized for all matrices due to their specificity in terms of composition and target compounds. Thus, the optimization of the variables involved in the process is needed to select the best conditions to ensure a maximum yield, minimum time, energy and solvent consumption, squeezing the utmost from the maceration system. Traditionally, optimization is achieved by monitoring the influence of one factor at a time. However, by using the response surface methodology (RSM), optimization is done simultaneously and in a more precise manner obtaining polyno-mial models able to describe within the experimental range tested the optimal conditions that maximize the response criteria used (Bezerra et al., 2008; Ferreira et al., 2007; Kalil & Maugeri, 2000).
Therefore, the aims of the present study were: 1) to develop a process in a pre-industrial form for the isolation of the floral parts (mainly bracts and bracteoles ofG. globosaflowers); and 2) opti-mize the primary variable conditions of the maceration system (time, temperature, ethanol-water proportion and solid-liquid ratio) and maximize betacyanins extraction assisted by the statistical RSM technique, contributing to the understanding of the potential of betacyanins from G. globosa for industrial applications.
2. Material and methods
2.1. Reagents
Acetonitrile of HPLC grade and ethanol p.a. were purchased by Fisher Scientific (Lisbon, Portugal). Water was treated in a Milli-Q water purification system (TGI Pure Water Systems, Greenville, SC, USA). All other chemicals and solvents were of an analytical grade and purchased from common suppliers.
2.2. Sample collection
Gomphrena globosaL. plants were purchased by Ervital, a Por-tuguese company from Castro Daire, established in a mountain region full of diversity. This company markets different certified plant material with different origins such as local spontaneous spe-cies and farming exogenous spespe-cies. After harvesting the plants, they processed them by in-storage and low temperature drying
methods. After reception and botanical identification of the plant material, carried out by Dr. Ana Maria Carvalho, responsible of the medicinal plant collection of the Herbarium of the School of Agriculture, Polytechnic Institute of Bragança (Portugal), the plant material was subjected to a mechanical separation, in order to iso-late the flowers (bracts and bracelets), that are considered the pig-mented parts, from the inflorescences.
2.3. Betacyanins or structural analog compounds used as standards for quantification purposes
For quantification purposes three different criteria were evalu-ated as possible standards: 1) commercial product of betanin (C24H26N2O13, Mw = 550.47, obtained from red beet extract diluted
with dextrin, CDS000584) acquired from Sigma-Aldrich (St. Louis, MO, USA); 2) gomphrenin III (C33H32N2O15, Mw = 728 g/mol)
iso-lated by preparative Liquid Chromatography (LC); and 3) amaran-thine (C30H34N2O19, Mw = 726.6 g/mol) with extinction coefficient
(
e
) of 56.6103L/mol.cm (Casique-Arroyo, Martínez-Gallardo, De La Vara, & Délano-Frier, 2014; Piattelli, de Nicola, & Castrogiovanni, 1971).The preparative separation was performed with an extract ofG. globosausing an Agilent 1260 Infinity series Preparative LC (Agilent Technologies, Santa Clara, CA, USA). This equipment consisted of a thermostated autosampler, 2 coupled preparative pumps, which formed a binary system, a diode array detector and a thermostated sampler collector, controlled by OpenLab CDS Chemstation Work-station software (version C.01.04; Agilent Technologies). The sepa-ration was performed using an Agilent Prep-C18 column (5
l
m, 21.1 mm150 mm, Agilent Technologies, Santa Clara, CA, USA) thermostated at 35°C. The solvents used were: (A) 2.5% acetic acidin water and (B) methanol, being the gradient elution as followed: from 20 to 40% B for 10 min, 40% B for 5 min, from 40 to 43% B for 5 min, from 43 to 45% B for 5 min, from 45 to 50% B for 5 min, from 50 to 100% B for 10 min, and 100% B for 10 min, using a flow rate of 15 mL/min. The chromatogram was recorded at 530 nm, which is the maximum absorbance for betacyanins and the compound cor-responding to gomphrenin III (most abundant compound in the sample) was collected in a sampler collector.
Afterwards, the samples were concentrated using a SpeedVacTM
Systems (ThermoFisher Scientific, San Jose, CA, USA), in order to remove the methanol and further lyophilized to obtain the dry compound. The purity of gomphrenin III was confirmed by HPLC-PDA and used to obtain a 7-level calibration curve (1000–50mg/
mL) for the spectrophotometric assay (y = 0.00481x + 0.001,
R2= 0.9986) and HPLC-PDA system (y = 16,003x 139,539,
R2= 0.9995).
2.4. Maceration extraction
The powdered samples of the selected pigmented parts were extracted at different time (t), temperature (T), water-ethanol pro-portion (Et) and solid/liquid ratio (S/L) ranging as defined by the RSM design. The solvent volume was fixed at 20 mL and samples were stirred using a CIMAREC i Magnetic Stirrer with a fixed agita-tion speed (500 rpm, Thermo Scientific, San Jose, CA, USA). After that, the mixture was filtered and centrifuged at 14,000 rpm for 10 min. The pellet was discarded and the supernatant was care-fully collected and divided in two parts. One part was used to quantify the powder yield extract and its light intensity. The sec-ond part of the supernatant was employed to quantify the total betacyanin compounds content by: 1) reading the extracts absor-bance in a spectrophotometer (AnalytikJena, Jena, Germany) at 530 nm (subtracting the turbidity absorbance obtained at 650 nm); and 2) HPLC-PDA-MS/ESI analysis identifying the indi-vidual betacyanin compounds. Part A of Fig. 1shows a diagram
of the different steps carried out for the betacyanins extraction, identification and quantification.
2.5. Responses criteria used to evaluate the extraction process
2.5.1. Quantitative techniques for betacyanins identification and/or quantification
2.5.1.1. Spectrophotometric method for the quantification of
beta-cyanins content. For each sample, total colour compounds were
measured in the spectral range for betacyanins maximum absor-bance at thek= 530 nm. As for the quantitative examination, a cal-ibration curve was obtained after reading the absorbance of known compound concentrations and the results were expressed in mg of the total colour compounds in the spectral range of betacyanins per g of dry weightG. globosaplant (mg/g).
2.5.1.2. Betacyanins identification and quantification by HPLC-PDA-MS/ESI. An LC-PDA analysis was performed for betacyanins deter-mination, using a Dionex Ultimate 3000 UPLC instrument (Thermo Scientific, San Jose, CA, USA) coupled with a diode-array detector. The chromatographic system contained a quaternary pump, an autosampler maintained at 5°C, a degasser, a photodiode-array
detector and an automatic thermostatic column compartment. The chromatographic separation was done by a Waters Spherisorb S3 ODS-2 C18 (3
l
m, 4.6 mm150 mm, Waters, Milford, MA, USA) column thermostatted at 35°C. The solvents used were: (A)0.1% trifluoroacetic acid (TFA) in water, (B) acetonitrile. The gradi-ent elution followed these parameters: 10% B for 3 min, from 10 to 15% B for 12 min, 15% B for 5 min, from 15 to 18% B for 5 min, from 18 to 30% B for 20 min, from 30 to 35% B for 5 min, and from 35 to 10% B for 10 min. Sixty minutes was the resulting total run time, followed by column reconditioning of 10 min, using a flow rate of 0.5 mL/min. The chromatogram was recorded at 530 nm, which is the maximum absorbance for betacyanins. The identification of these compounds were previously performed by authors (Roriz et al., 2014) and confirmed in this study. Four betacyanin com-pounds were found: P1, gomphrenin II ([M H] at m/z 697) at t = 39.7 min (C33H32N2O15); P2, gomphrenin III ([M H] at m/z
727) at t = 40.2 min (C34H34N2O16); P3, isogomphrenin II ([M H]
atm/z697) at t = 41.2 min (C33H32N2O15); and P4, isogomphrenin
III ([M H] atm/z727) at t = 42.2 min (C34H34N2O16). For
quanti-tative analysis, a calibration curve was obtained by injection of compound known concentrations and the results were expressed in mg of the compound per g of dry weight ofG. globosa(mg/g).
2.5.2. Colour parameters analysis
A Minolta spectrophotometer (Konica Minolta Sensing, Inc., Chroma Meter CR-400, Japan) was used to measure colour of the extract powder. Using the illuminant C and a diaphragm aperture of 8 mm, the CIEL⁄a⁄b⁄colour space values were reported through
Average values were considered to determine the colour coordinates, whereL⁄represents lightness,a⁄represents
chromatic-ity on a green ( ) to red (+) axis, andb⁄represents chromaticity on a
blue ( ) to yellow (+) axis. Since the colour that we are interested of is the red one, only measurements of parameter a⁄ were taken
into account for further analysis. The instrument was calibrated with standard white tiles before analysis (Spectra Magic NX Instruc-tion Manual, Konica Minolta Sensing, Inc. (ver. 2.0), 2009, Japan).
2.5.3. Extraction yield determination
The residue determination was achieved after drying a portion of the filtered sample (10 mL) in an oven at 60°C to evaporate the
ethanol, and then elevated at 100°C to evaporate the residual water.
After the complete drying of the sample, it was removed from the oven and allowed to cool, and the residue was calculated by difference.
2.6. Experimental design, model analysis and statistical evaluation
2.6.1. Experimental design
The influence of different independent variables was investi-gated using one-factor-at-a-time to select the significant ones and to determine the preliminary range of the processing vari-ables. Based on these experimental results (data not shown), the variablesX1(time ort, min),X2(temperature orT,°C),X3(ethanol proportion or Et, %) and X4 (solid/liquid ratio or S/L, g/L) were selected for the RSM design. Therefore, the combined effect of these four variables on the production of betacyanins (maximizing responses individually or globally) was studied usingcentral com-posite designas proposed byBox, Hunter, and Hunter (2005). The responses were solved using 25 independent combinations and 4 replicates at the centre of the experimental domain. In this design, the points of experiments are generated on a sphere around the centre point. The centre point is supposedly an optimum position for the response and is repeated to maximize the prediction (Box & Hunter, 1957). This design also requires 5 levels of each factor. Experimental runs were randomized to minimize the effects of unexpected variability in the observed responses. A detailed description of the mathematical expressions to calculate the design distribution and to decode and code the tested variable’s ranges can be found in the Supplemental material section (Table A1).
2.6.2. Mathematical model
The response surface models were fitted by means of least-squares calculation using the following second-order polynomial equation:
Y¼b0þ
Xn
i¼1
biXiþ
Xn 1
i¼1 j>i
Xn
j¼2
bijXiXjþ
Xn
i¼1
biiX2i ð1Þ
where Y is the dependent variable (response variable) to be modelled,XiandXjdefine the independent variables,b0is the
con-stant coefficient,biis the coefficient of linear effect,bijis the coef-ficient of interaction effect,biithe coefficients of quadratic effect andnis the number of variables. As dependent variable responses were used the yield extract, the analytical colour parametera⁄as
qualitative response and the quantitative responses of betacyanin compounds either by spectrophotometric and chromatographic analysis.
2.6.3. Procedure to optimize the variables to a maximum response
For optimization of betacyanin compounds extraction, a maxi-mized process of the model produced responses was achieved,
using a simple method tool to solve non-linear problems (Heleno et al., 2016; Pinela et al., 2016). Limitations were made to the vari-able coded values to avoid unnatural conditions (i.e., times lower than 0).
2.7. Fitting procedures and statistical analysis
The fitting procedures of equations to the responses were per-formed on a Microsoft Excel spreadsheet. Coefficients estimation and statistical calculations of the experimental results to the pro-posed equations were carried out in three phases:
1) Coefficients estimation was obtained by minimization of the sum of quadratic differences between the observed and model-predicted values, using the nonlinear least-squares (quasi-Newton) method provided by the macro Solver in
Microsoft Excel(Kemmer & Keller, 2010).
2) The significance of the coefficients of the parametric confi-dence intervals was calculated using the ‘‘SolverAid” (Prikler, 2009). The model was simplified by dropping terms, which were not statistically significant (p-value > 0.05). 3) The uniformity of the model was checked by applying the
following statistical assessment criteria: a) The Fisher F -test (
a
= 0.05) was used to determine whether the con-structed models were consistent to describe the observed data; b) The ‘SolverStat’ macro was used for the assessment of the parameter and model prediction uncertainties (Comuzzi, Polese, Melchior, Portanova, & Tolazzi, 2003); c) R2and R2adjwere interpreted as the proportion of variability
of the dependent variable explained by the model; d) The fit-ting to experimental data was evaluated by calculafit-ting the bias and accuracy factors of all equations, such as the Mean Squared Error (MSE), the Root Mean Square of the Errors (RMSE), the Mean Absolute Percentage Error (MAPE); and the Durbin-Watson coefficient (DW).
3. Results and discussion
3.1. Producing food colorants from the floral part of G. globosa
The pigmented portion of the plant is only a part of the inflorescence, so to not compromise the effectiveness of the pro-cess it is nepro-cessary to separate the parts of interest from the remaining plant material. This will increase the effectiveness of the pigment extraction, without the interference of other portions of the plant that are not pigmented. To overcome this problem a mechanical separation process was used for isolating the pigmented parts (bracts and bracteoles) from the flowers within the inflorescence. Parts B and C ofFig. 1show, respectively, the relevant morphological parts ofG. globosaand the mechanical sep-aration process to isolate the pigmented parts (bracts and brace-lets) from the flower heads. In the first phase of the separation process, the pigmented parts of the flower within bracts and bracteoles (52% of the inflorescence) were removed from the bract-like leaf-pair (12% of the inflorescence) and heads (36% of the inflorescence) in a rotary sieve device. Then, in the second phase, the flowers within bracts and bracteoles were blended and sieved (2
l
m) to separate the fibrous inner part of the flower (non-pigmented, 66% of the flowers and 34% of the inflorescence) from the pigmented parts (34% of the flowers and 18% of the inflo-rescence). By performing the separation process it was possible to concentrate the pigmented parts approximately five times more than using the inflorescences. The process was automatized in two steps procedure for its industrial transference.3.2. Optimization of the betacyanin compounds extraction by RSM
After separating the pigmented parts of the plant and selecting the most suitable options for compounds quantification, the extraction of the pigments was carried out.Table 1shows a bibli-ographic summary of betalains content from different source materials using ME technique under different conditions in order to compare the results obtained with the results presented in this work.
There are several factors that may interfere. For optimizing the extraction of the pigment molecules, it is necessary to take into account during the extraction process, factors like extraction time (X1,t), temperature (X2,T), type and proportion of the solvent used (X3,Et) and solid-liquid ratio used (X4,S/L). The RSM technique con-sists of an assembly of mathematical and statistical techniques that with the aid of a polynomial equation, helps to describe the behaviour of this data set with the goal of making statistical pre-dictions. This technique becomes extremely useful when the response is influenced by several variables, and aims to optimize the levels of these variables in order to obtain the best performance from the system (Bezerra et al., 2008). Preliminary tests were examined individually to determine their experimental domain (keeping other ones constant) in order to obtain a proper RSM design by analysing their general pattern responses. In conclusion, the five level ranges of the four tested variables evaluated in a
CCCD RSM for the maceration process were: t (5–165 min), T
(25–85°C),Et(0–100%) andS/L(5–45 g/L). The processing
condi-tions were optimized based on the pigmented residue extracted (yield), the analytical colour parametera⁄and the quantification
of betacyanin compounds either by spectrophotometric (total
amount) or chromatographic analysis (compounds identified as P1-4 and total amount). The experimental results for the 28 runs are presented inTable 2.
3.2.1. Development of theoretical response surface models and statistical verification
Fitting the models for the selected responses is crucial to eluci-date how precisely the RSM mathematical model can predict ideal variances. The models for each response were built by fitting the second-order polynomial model of Eq.(1)(independent variables in coded values) to the experimental values (Table 2) through non-linear least-squares estimations. The resulting models are pre-sented below.
When the extraction yield response was considered:
YYield¼40:1þ0:9x2 4:9x3 2:8x4 0:9x2
1 1:3x23
þ0:9x1x2þ0:9x1x4 0:45x2x3 0:5x3x4 ð2Þ
When the peaks of the betacyanin compounds (P1-4) and the total amount were considered:
YP1¼1:4 0:2x2 0:8x3 0:6x4þ0:2x23þ0:5x42 0:2x1x2 ð3Þ
YP2¼2:5 0:5x2 2:3x3 1:0x4þ0:7x2
3þ1:0x23 0:5x1x2 0:3x3x4
ð4Þ
YP3¼1:5 0:2x2 0:7x3 0:5x4þ0:1x23þ0:3x42 0:2x1x2 ð5Þ
YP4¼2:1 0:4x2 1:6x3 0:6x4þ0:2x21þ0:5x23þ0:5x24
0:3x1x2 ð6Þ
Table 2
Results of the response surface experimental plan for the optimization of independent variables of time (t), temperature (T), ethanol content (Et) and solid-liquid ratio (S/L) of the maceration system for the extraction of betacyanins. Response criteria comprise the following: % yield of extraction, gomphrenin II content (P1), gomphrenin III content (P2), isogomphrenin II content (P3), isogomphrenin III content (P4) and total betacyanins content (P1 + P2 + P3 + P4).
Experimental domain Residue Betacyanins content by HPLC Other resp.
X1: t X2: T X3: Et X4: S/L Yield P1 P2 P3 P4 TOTAL ABS Colour
min °C % g/L % mg/g mg/g mg/g mg/g mg/g mg/g b*
1 1(45) 1(40) 1(25) 1(15) 45.52 3.15 6.59 2.85 5.03 17.62 17.65 34.22 2 1(125) 1(40) 1(25) 1(15) 40.38 4.23 8.93 3.78 6.66 23.59 24.34 33.11 3 1(45) 1(70) 1(25) 1(15) 45.80 3.42 7.36 3.10 5.46 19.34 20.04 34.51 4 1(125) 1(70) 1(25) 1(15) 48.09 2.72 5.44 2.54 4.19 14.90 11.61 33.98 5 1(45) 1(40) 1(75) 1(15) 41.40 2.16 3.68 1.95 2.77 10.56 25.51 28.67 6 1(125) 1(40) 1(75) 1(15) 31.42 2.06 3.21 1.85 2.52 9.65 21.66 19.04
7 1(45) 1(70) 1(75) 1(15) 35.60 1.74 2.93 1.62 2.05 8.34 13.00 18.82
8 1(125) 1(70) 1(75) 1(15) 37.82 1.43 1.68 1.34 1.41 5.87 6.89 20.48
9 1(45) 1(40) 1(25) 1(35) 41.46 2.67 6.11 2.40 4.62 15.81 20.58 22.62 10 1(125) 1(40) 1(25) 1(35) 37.52 3.15 7.53 2.88 5.62 19.18 23.39 17.08 11 1(45) 1(70) 1(25) 1(35) 37.78 2.63 6.23 2.39 4.73 15.97 19.88 26.26 12 1(125) 1(70) 1(25) 1(35) 44.06 2.25 5.35 2.15 4.18 13.93 15.73 13.35
13 1(45) 1(40) 1(75) 1(35) 31.08 0.69 0.75 0.71 0.86 3.01 6.11 15.53
14 1(125) 1(40) 1(75) 1(35) 27.30 0.88 1.31 0.91 1.26 4.36 13.34 11.99
15 1(45) 1(70) 1(75) 1(35) 27.57 0.86 1.09 0.80 1.07 3.82 9.45 11.87
16 1(125) 1(70) 1(75) 1(35) 33.83 0.71 0.97 0.79 1.02 3.49 7.41 10.23
17 2(5) 0(55) 0(50) 0(25) 36.76 1.59 2.70 1.69 2.62 8.60 18.72 22.31
18 2(165) 0(55) 0(50) 0(25) 36.13 1.51 2.60 1.94 2.66 8.71 19.10 19.72 19 0(85) 2(25) 0(50) 0(25) 37.75 1.95 3.25 1.81 3.04 10.04 23.19 21.14
20 0(85) 2(85) 0(50) 0(25) 41.22 0.90 1.13 0.92 1.18 4.13 4.06 22.48
YP4¼7:7 1:2x2 5:5x3 2:8x4þ1:5x2
3þ2:4x24 1:2x1x2 0:6x3x4
ð7Þ
When the spectrophotometric quantification and colour deter-mination were considered:
YABS¼20:5 3:6x2 3:8x3 1:8x4 1:9x22 2:2x23 2:1x1x2
þ1:7x2x4 2:3x3x4 ð8Þ
YColour¼20:5 1:6x1 5:6x3 5:5x4þ1:2x3x4 ð9Þ
whereX1(extraction time),X2(temperature),X3(ethanol pro-portion) andX4(solid/liquid ratio),Yis the response, sub-indices indicate the analytical criteria used as responses for RSM.
Because some coefficients were statistically non-significant, as described inTable A2, only those parameters of Eq.(1)that showed statistically significant confidence intervals (or in other words that the effects of their variables were important) were used for devel-oping the models of Eqs.(2) to (9). This is well documented in the bibliography in which only the parameters useful to predict the results of untested operating conditions are considered (Ranic et al., 2014) and the complexity of the mathematical equations can be related to the number of factors that affect the response. Several ‘‘lack of fit” tests were used to evaluate the competence of the obtained models (Eqs.(2) to (9)) and it was confirmed that no considerable improvement was achieved by the exclusion of the statistically non-significant effects (Table A2). This was also verified by the values of R2and R2
adj(Table A2) that did not show
any drop in their numerical value by excluding these non-significant coefficients.
In mathematical terms, the sign of the effect of the coefficients of the models marks the performance of the response, when a coef-ficient shows a positive effect, the response pattern increases as the variable increases, and when a coefficient has a negative effect, the response decreases as the variable increases. The higher the absolute value of a coefficient is, the more important the weight of the corresponding variable is.
In this regard, different response criteria lead to diverse com-plex model solutions. In general, all of them present a combination of linear, quadratic and interactive parameters to describe the pat-terns of their individual behaviour. Being the only exception the colorimetric response (Eq.(9)) in which the variable time (X1) did not characterize any substantial effect, but in all others, the four variables involved played a significant role. Nonetheless, based on the mathematical expressions, the response of the yield extrac-tion (Eq.(2)) was the most complex one, showing high number of interactive coefficients between the variables with a high numeric value. The model with less parametric solutions was the colorimet-ric response of Eq.(9). All the other models (Eqs.(3) to (8)), repre-senting the effects for the four HPLC compounds quantification of betacyanins identified (P1, P2, P3 and P4), the total sum of HPLC compounds quantification identified and the spectrophotometric quantification, showed an intermediate complexity with linear and quadratic effects with some interactive terms.
In statistical terms, the tests used to evaluate the competence of the obtained models (Eqs.(2) to (9)), confirmed the consistency of the final solutions provided (Table A2). As verified by the val-ues of R2 and R2
adjshowing in all cases numerical values higher
than 0.9, indicating that the variability of each response is explained satisfactorily by the models (Table A2). Additionally, the distribution of residuals was always randomly scattered around zero and grouped data and autocorrelations were not observed (data not shown). This means that these models are practicable and can be applied in the subsequent prediction and optimisation stages. It also indicates a good agreement between the experimen-tal and predicted values.
The patterns of the extraction can be explained by means of the parametric values of the second-order polynomial models described in Eqs.(2) to (9)as described above, or can be illustrated by graphical representations. Thus, Figs.2, andA1 (supplementary material)show the 3D surface responses in 2D contour plots as a function of the four studied variables. The variables excluded in each contour graphs were positioned at the centre of their experi-mental domain, i.e.,t= 85 min,T= 55°C,Et= 50% andS/L= 25 g/L.
From this graphical analysis and the information derived from the mathematical terms of the models developed, the response patterns of the variables to the responses criteria used is depicted satisfactorily and described in detail in the following section
3.2.2. Effects to the extraction variables on the responses criteria that are used to evaluate the betacyanins content
The responses used as criteria to evaluate the betacyanin com-pounds extracted were the HPLC and spectrophotometric analysis as quantitative ones, and the colorimetric analysis as qualitative one. In general, all of them showed similar patterns with some minor differences that can be straightforwardly understood by the parametric content of the models (Table A2) or by the graphical representation ofFig. 2.
3.2.2.1. Quantitative responses determined by HPLC and spectropho-tometric analysis. In the HPLC profile ofG. globosaextracts (Fig. A2
part A), it was possible to notice four main peaks corresponding to gomphrenin II att= 39.65 min (P1, C33H32N2O15), gomphrenin III at
t = 40.21 min (P2, C34H34N2O16), isogomphrenin II att= 41.23 min
(P3, C33H32N2O15) and isogomphrenin III at t= 42.15 min (P4,
C34H34N2O16). All compounds were affected in a similar mode by
the processing conditions, as can be observed comparing each con-tour graph showed inFig. A1 (supplementary material)and in the correlation matrix presented in Table A3 (supplementary mate-rial). The same patterns are observed when the total sum of the four peaks (P1 + P2 + P3 + P4) is analysed and presented inFig. 2. For representation purposes, the variables excluded in each con-tour graphs were positioned at the centre of their experimental domain,i.e.,t= 85 min,T= 55°C,Et= 50% andS/L= 25 g/L. In
gen-eral, for all the HPLC responses the following patterns could be observed:
– It was verified that shortertand highTor hightand shorterT
lead to an increase on the extraction of betacyanin compounds, whereas in any other combination, the extraction will gradually be decreased, probably due to degradation phenomena or insuf-ficient extraction conditions. The patterns described show com-plex interactions with linear, quadratic and interactive effects. – The effect of the solvent proportion followed a nearly linear
rela-tion and water (Et= 0%) was the preferred extraction solvent con-dition. In fact, betacyanin compounds are polar molecules, so the extraction yield increases with increasing water content accord-ing to the ‘‘like dissolves like” principle (Schmid, 2001). Addition-ally, water may enhance swelling of cell material, increasing the contact surface area between plant matrix and solvent, resulting also in an increased extraction yield (Hayat et al., 2009). – As expected, theS/Lhad linear, quadratic and occasionally some
interactive effects with decreasing patterns with the increase of theS/L, showing the lower ratio (5 g/L) as the condition that favoured the extraction of betacyanin compounds. On an indus-trial scale, high ratios are desirable since it is important to max-imize the extraction with a minimal solvent consumption, but the information provided will guide to perform more appropri-ate conditions.
Regarding the spectrophotometric results, similar conclusions as those found in the HPLC were determined, however the HPLC
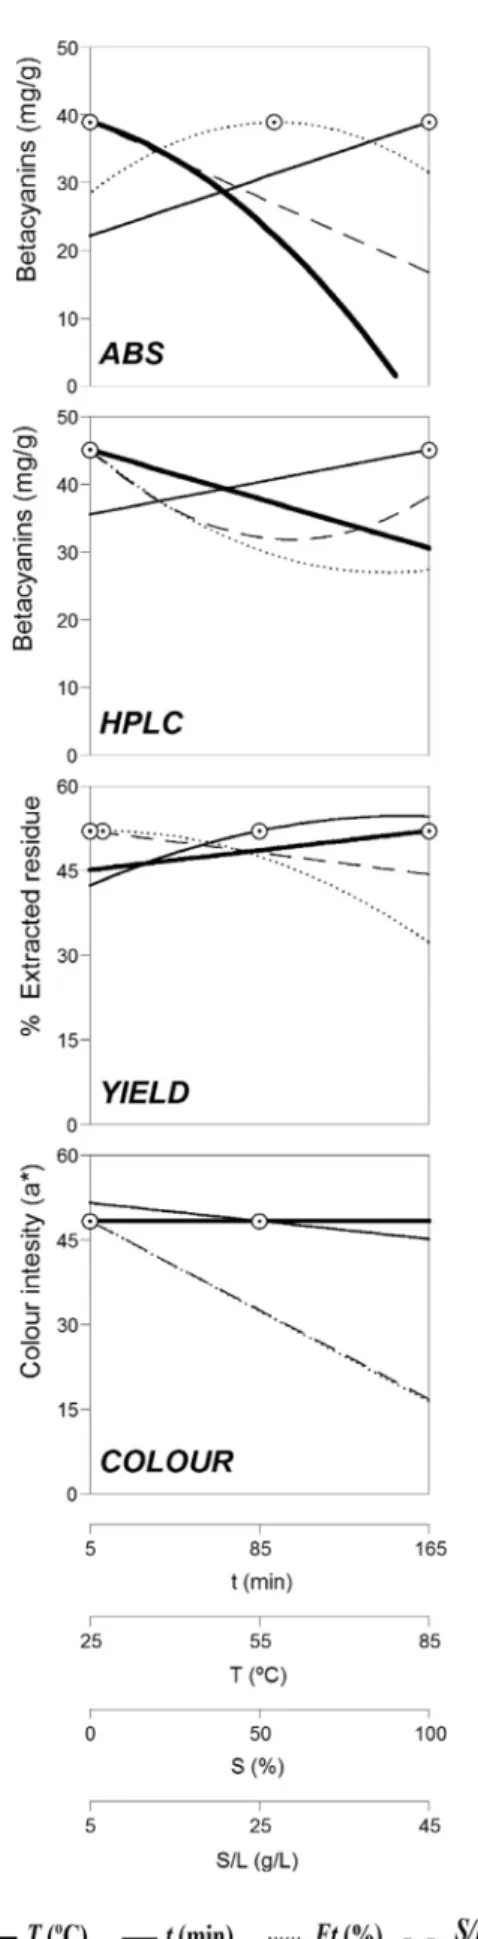
Fig. 2.Matrix combination of the spectrophotometric (ABS), total betacyanins content (P1 + P2 + P3 + P4), % yield of the extracted residue, and colour intensity (a*values)
results did not correlate with the results found in the spectropho-tometric analysis, as it can be observed inTable A3 (supplementary material). Shorter values oftand highTor hightand shorterTlead to an increase in the extraction of betacyanin compounds. The sol-vent proportion effect was the variable that causes the lack of cor-relation showing major differences in respect to the HPLC results, founding linear and quadratic patterns that lead to a high extrac-tion pattern at intermediate values of water-ethanol rather than in water. This issue will be discussed later on together with the unreliable consequences of using spectrophotometric results for quantification. TheS/Lhad mainly linear effects with decreasing patterns as theS/Lincreases.
3.2.2.2. Qualitative response determined by colorimetric analysis. The effects of the studied independent variables on the colorimetric analysis are presented inFig. 2. The patterns were similar to the quantitative analysis but with simple and less interactive result solutions. However, the HPLC results did not correlate with the results found in either spectrophotometric or colorimetric analysis, as it can be seen inTable A3 (supplementary material). Theteffect was not found significant and the effect ofTwas minor compared to the effects found in the other responses criteria. The solvent pro-portion andS/Leffects showed an important linear decrease with the increase in the variables, as also observed in the quantitative analysis.
3.2.3. Effects of the extraction variables on the extracted yield material response criterion
The effects of the studied independent variables on the extracted residue (% extraction yield) are presented inFig. 2. In almost all variables, the parametric patterns described by the mod-els (Table A2) show complex interactions with linear, quadratic and interactive effects. Shortertand highTor hightand shorter
T lead to an increase in the extraction of the extracted residue; any other condition will decrease yield material. The effect of the solvent proportion followed a hyperbolic decreasing relation with optimum values around 20% of ethanol, in contrast with beta-cyanin compounds affinity to polar molecules. TheS/Lhad a nearly linear decreasing pattern with the increase of theS/L, showing the
lower ratio (5 g/L), the condition that favoured yield of the residue material.
3.3. Optimal extraction conditions for maximizing the responses criteria
Table 3andFig. 3show the operating conditions that maximize all the responses individually (% yield of extraction, colorimetric intensity, content of P1 to P4 betacyanin compounds and total betacyanins content) and globally.
The optimal processing conditions for each of the P1 to P4 beta-cyanin compounds were identical (165 min; 25°C; 0% ethanol and
5 g/L) obtaining the following maximum compound recovery (mg/ g; Media ± SD): 8.6 ± 0.5 for P1 (gomphrenin II), 17.9 ± 0.8 for P2 (gomphrenin III), 6.9 ± 0.5 for P3 (isogomphrenin II) and 13.5 ± 0.7 for P4 (isogomphrenin III). The optimal conditions for the total betacyanin compounds content (P1 + P2 + P3 + P4) were evidently at the same conditions of 165 min, 25°C, 0% ethanol
and 5 g/L yielding 45.1 ± 1.3 mg/g. In terms of the colorimetric intensity, the optimal processing conditions were 85 min, 25°C,
0% of ethanol and 5 g/L allowing a maximum value of 48.3 ± 1.4 (a⁄ values). The spectrophotometric determination showed the
optimal conditions at 165 min, 25°C, 0% of ethanol and 5.0 g/L
obtaining a maximum of 39.0 ± 1.2 mg/g. Regarding the extraction of the residue material, the optimal processing conditions were 85 min, 85°C, 20.9% of ethanol and 5 g/L allowing a recovery
max-imum of 51.9 ± 1.4%.
The global processing conditions that allowed to maximize all the evaluated responses were also calculated using a simplex method tool to solve linear problem. Restrictions were made to the variable coded values, in order to avoid the variable involved in the equations of being considered unnatural conditions (i.e.
lower times than 0). These global processing conditions were based on middle processing oft(132.1 min) andT(28.5°C) and low
val-ues of Et(0%) and S/L (5 g/L) producing maximum responses of 45.64% of residue material, 7.73 mg of P1/g, 15.77 mg of P2/g, 6.19 mg of P3/g, 11.35 mg of P4/g, 39.86 mg of total HPLC com-pounds/g, 19.95 mg of total spectrophotometric compounds/g and 48.11 of colour intensity (a⁄values).
Table 3
Operating conditions that maximize the extraction of betacyanins fromG. globosaand optimal response values for the parametric response criteria. Response criteria comprise the following: % yield of extraction, gomphrenin II content (P1), gomphrenin III content (P2), isogomphrenin II content (P3), isogomphrenin III content (P4) and total betacyanins content (P1 + P2 + P3 + P4).
Optimal extraction conditions Response optimum
X1: t (min) X2: T (°C) X3: Et (%) X4: S/L (g/L)
Residue
Yield 85.0 85.0 20.9 5.0 51.9 ± 1.4 %
Betacyanins content by HPLC
Gomphrenin II (P1) 165.0 25.0 0.0 5.0 8.6 ± 0.5 mg/g
Gomphrenin III (P2) 165.0 25.0 0.0 5.0 17.9 ± 0.8 mg/g
Isogomphrenin II (P3) 165.0 25.0 0.0 5.0 6.9 ± 0.5 mg/g
Isogomphrenin III (P4) 165.0 25.0 0.0 5.0 13.5 ± 0.7 mg/g
Total (P1 + P2 + P3 + P4) 165.0 25.0 0.0 5.0 45.1 ± 1.3 mg/g
Other responses
ABS 165.0 25.0 54.1 5.0 39.0 ± 1.2 mg/g
COLOUR 85.0 25.0 0.0 5.0 48.3 ± 1.4 a*values
Global analysis based on all the response criteria
Yield 132.1 28.5 0.0 5.0 45.64 %
Gomphrenin II (P1) 7.73 mg/g
Gomphrenin III (P2) 15.77 mg/g
Isogomphrenin II (P3) 6.19 mg/g
Isogomphrenin III (P4) 11.35 mg/g
Total (P1 + P2 + P3 + P4) 39.86 mg/g
ABS 19.95 mg/g
COLOUR 48.11 a*values
3.4. Comparing the quantification procedure and standards appropriated for determination of betacyanins
From the bibliographic material, two aspects need to be reviewed regarding the quantification procedure in the extraction of betacyanin compounds fromG. globosaor similar plant matrices with betacyanins as the target compounds:
1) Standard compound applied to build the calibration curve. In general, the three common solutions are: 1) Commercial product of betanin (C24H26N2O13, Mw = 550.47, obtained
from red beet extract diluted with dextrin), with a 44% of betanin purity (betanidin-5-O-glucoside, as tested in our laboratory) and with similar structure to those betacyanin compounds evaluated in our sample; 2) Isolated compound from sample matrix (in our case gomphrenin III, C33H32N2O15, Mw = 728 g/mol); and 3) Using the reported
extinction coefficient of amaranthine (
e
= 56.6103L/mol.cm, C30H34N2O19, Mw = 726.6 g/mol) as described elsewhere
as reliable solution (Casique-Arroyo et al., 2014; Piattelli et al., 1971). The concentration range of the commercial betanin compound was 0.1 to 10 mg/mL for the spectropho-tometer and 0.25 to 10 mg/mL for the HPLC determination, meanwhile for the isolated compound of gomphrenin III the range was 0.05 to 0.5 mg/mL for the spectrophotometer and 0.1 to 1.0 mg/mL for the HPLC determination.
2) The quantification technique employed. In general, to the best of our knowledge, there are two general options in lit-erature: a) techniques that measured the global colour intensity, such as the spectrophotometric analysis, that are fast quantification systems but not very reliable due to the presence of very diverse range of compounds from natural sources that could interfere with the target compounds; b) techniques such as the HPLC systems that are described as a very reliable quantification alternative with the advantage of specifically identifying the pigmented compounds but involving a much greater experimental effort.
In order to review which technique and standard compounds that could be more suitable for the quantification of betacyanin pigments all combinatory solutions were evaluated.
The calibration curve with the commercial product of betanin lead to the highest betacyanin compounds quantification results followed by the compound of gomphrenin III isolated from our plant material sample (Fig. A2part A shows the HPLC-PDA profile and molecular structure of the betacyanin pigments present inG. globosa) and followed by the results derived using the reported extinction coefficient of amaranthine compound. Using the avail-able data derived fromTable 2, it was concluded that the results derived from the molar extinction coefficient of amaranthine (
e
= 56.6103L/mol.cm) estimated 10 times lower results ofbetacyanins content than those found with the compound isolated in our sample (gomphrenin III) and100 times lower than those found with the commercial standard of betanin. Although the typ-ical form to quantify betacyanins is performed by using the reported extinction coefficient of amaranthine, it is also very mon to use extracts from red beet as an equivalent value for com-parison purposes. However, the average differences were found surprisingly high, and more advanced analysis may be need to be addressed in order to clarify the most adequate standard com-pounds to quantify the total content of betacyanins in plant sample materials. In this work, the values of the commercial product of betanin and molar extinction coefficient of amaranthine were dis-carded and the only results computed were those obtained using the calibration curve of the isolated compound gomphrenin III (
e
= 4967.6 L/mol.cm).Regarding the spectrophotometric and HPLC quantification techniques employed, it is obvious that the HPLC is the most reli-able one. However, it is common to perform evaluations only by direct spectrophotometric analysis. By using the results of the opti-mization responses obtained, it can be seen that the HPLC results did not correlate with the spectrophotometric results (Table A3, supplementary material). In this regard, it was found that the sol-vent proportion was the variable that causes the lack of correlation. As the proportion of ethanol increases over the 20% the differences between both quantification systems increases and as long as the proportion is lower than 20%, the quantification of betacyanins by both techniques match reasonably well.Fig. A2part C shows the data reorganized as function of this rule and it can be seen that when the solvent proportion is lower than the 20% the correlation between the quantification results derived from the spectrophoto-metric and the HPLC techniques is identical, but when the solvent proportion is higher than the 20%, the spectrophotometric tech-nique overestimates the amount of betacyanin compounds up to 3 times higher than the real amount. Since these differences cannot be attributed to the oxidation compounds generated during the extraction process (Fig. A2part B), it can be hypothesized that as the solvent proportion increases also increases the extraction of other non-polar compounds that could have a similar range of light absorbance (k= 530 nm) than the betacyanin polar compounds, causing the increase in the signal intensity and producing the over-estimation of the real betacyanins content in the sample.
4. Conclusions
Betacyanins are betalain pigments that display a red-violet col-our that have been reported to be three times stronger than the red-purple-blue dye produced by anthocyanins. The applications of betacyanins cover a wide range of matrices, mainly as additives or supplements in the food industry, cosmetics, pharmaceuticals and livestock feed. Although being less commonly used than anthocyanins and carotenoids, betacyanins are stable between pH 3 and 7 and well suited for colouring low acid matrices. In addi-tion, betacyanins have been reported to display interesting medic-inal character as powerful antioxidant and chemopreventive compounds inin vitroandin vivomodels.
G. globosais a plant used typically to treat respiratory system diseases, diabetes, hypertension, urinary system conditions, as well as kidney and prostate problems, among others (Roriz et al., 2014). It is consumed preferentially in the form of infusion, but due to its extremely strong and attractive colour and composition, other potential uses not yet properly exploited could be developed for new purposes (Carocho et al., 2015).
In this work, a mechanical separation process for isolating the pigmented parts (bracts and bracelets) from the flower heads was developed. The process has the potential to be transferred easily to an industrial form and comprise two main steps: a first phase in which the bracts and bracteoles were removed from the bract-like leaf-pair and heads in a rotary sieve device, and a second phase in which the bracts and bracteoles were blended and sieved (2
l
m) to separate the fibrous inner part from the pigmented parts. Then, the processing conditions (t,T,EtandS/L) of maceration for extracting the betacyanin compounds were successfully opti-mized in a five-level full factorial design to maximize the responses. The response criteria were the pigmented residue extracted (yield), the analytical colour parametera⁄and thequan-tification of betacyanin compounds either by spectrophotometric (total amount) or chromatographic analysis (compounds identified P1-4 and total amount). In all cases, the system variables had sig-nificant effects on the studied responses. Different optimal condi-tions were determined for each of the responses, as well as the global processing conditions. These values would not be possible
to be found without optimizing the conditions of the extraction of betacyanins, which moreover showed contrasting trends to what it has been described in the scientific bibliography. More specifically, concerning the time and temperature variables, in which an increase of both values (from the common ones used in the bibliography), showed a considerable improvement on the betacyanins yield content reducing the degradation patterns.
The proposed models were statistically validated by the high values of the adjusted determination coefficient (R2> 0.90) and
non-significant differences between the experimental and pre-dicted results were found.
Additionally, a discussion of the validity of the spectrophoto-metric analysis for the determination of betacyanin compounds as well as the available standard compounds for developing cali-bration curves for quantification purposes were raised. Our find-ings show that the spectrophotometric responses should be taken into consideration cautiously due to the probable extraction of other non-polar compounds that may absorb at similar ranges as betacyanin compounds causing overestimations up to three times higher than those notified by HPLC determination. Regarding the typical available standards used to develop calibration curves for betacyanins quantification showed higher differences that need to be revaluated.
As a final highlight, this study reports the use ofG. globosaas a source of betacyanin compounds in an optimized system that would facilitate the production of extracts with high potential to be used as natural colorant additives.
Acknowledgements
The authors thank the Foundation for Science and Technology (FCT, Portugal) and FEDER under Programme PT2020 for financial support to CIMO (UID/AGR/00690/2013) and L. Barros (SFRH/ BPD/107855/2015) grant. To POCI-01-0145-FEDER-006984 (LA LSRE-LCM) funded by ERDF through POCI-COMPETE2020 and FCT. To Xunta de Galicia for financial support for the post-doctoral researcher of M.A. Prieto. The authors also thank Ana Maria Carvalho for the plant donation and Celestino Santos-Buelga for the preparative LC system utilisation.
Appendix A. Supplementary data
Supplementary data associated with this article can be found, in the online version, at http://dx.doi.org/10.1016/j.foodchem.2017. 02.073.
References
Alonso-Salces, R. M., Korta, E., Barranco, A., Berrueta, L. A., Gallo, B., & Vicente, F. (2001). Pressurized liquid extraction for the determination of polyphenols in apple.Journal of Chromatography A, 933(1–2), 37–43.
Amchova, P., Kotolova, H., & Ruda-Kucerova, J. (2015). Health safety issues of synthetic food colorants.Regulatory Toxicology and Pharmacology, 73, 914–922.
Bezerra, M. A., Santelli, R. E., Oliveira, E. P., Villar, L. S., Escaleira, E. A., & Escaleira, L. A. (2008). Response surface methodology (RSM) as a tool for optimization in analytical chemistry.Talanta, 76(5), 965–977.
Box, G., & Hunter, J. (1957). Multi-factor experimental designs for exploring response surfaces.The Annals of Mathematical Statistics, 28(1), 195–241.
Box, G. E. P., Hunter, J. S., & Hunter, W. G. (2005).Statistics for experimenters: Design, innovation, and discovery(2nd ed.).
Carocho, M., Morales, P., & Ferreira, I. C. F. R. (2015). Natural food additives: Quo vadis?Trends in Food Science & Technology, 45, 284–295.
Casique-Arroyo, G., Martínez-Gallardo, N., De La Vara, L. G., & Délano-Frier, J. P. (2014). Betacyanin biosynthetic genes and enzymes are differentially induced by (a)biotic stress in Amaranthus hypochondriacus.PLoS ONE, 9(6).
Chen, Q. C., Mou, S. F., Hou, X. P., Riviello, J. M., & Ni, Z. M. (1998). Determination of eight synthetic food colorants in drinks by high-performance ion chromatography.Journal of Chromatography A, 827, 73–81.
investigation of dioxygenated Co (II) complex formation in dimethylsulfoxide solution.Talanta, 59(1), 67–80.
Dai, J., & Mumper, R. J. (2010). Plant phenolics: Extraction, analysis and their antioxidant and anticancer properties.Molecules, 15(10), 7313–7352.
Delgado-Vargas, F., Jiménez, A. R., & Paredes-López, O. (2000). Natural pigments: Carotenoids, anthocyanins, and betalains–characteristics, biosynthesis, processing, and stability.Critical Reviews in Food Science and Nutrition, 40(3), 173–289.
Ferreira, S. L. C., Bruns, R. E., Ferreira, H. S., Matos, G. D., David, J. M., Brandão, G. C., ... dos Santos, W. N. L. (2007). Box-Behnken design: An alternative for the optimization of analytical methods.Analytica Chimica Acta, 597(2), 179–186.
Gengatharan, A., Dykes, G. a, & Choo, W. S. (2015). Betalains: Natural plant pigments with potential application in functional foods. LWT – Food Science and Technology, 64(2), 645–649.
González, M., Gallego, M., & Valcárcel, M. (2002). Automatic screening method for the rapid and simple discrimination between synthetic and natural colorants in foods.Analytica Chimica Acta, 464, 237–247.
Hayat, K., Hussain, S., Abbas, S., Farooq, U., Ding, B., Xia, S., et al. (2009). Optimized microwave-assisted extraction of phenolic acids from citrus mandarin peels and evaluation of antioxidant activity in vitro. Separation and Purification Technology, 70(1), 63–70.
Heleno, S. A., Diz, P., Prieto, M. A., Barros, L., Rodrigues, A., Barreiro, M. F., & Ferreira, I. C. F. R. (2016). Optimization of ultrasound-assisted extraction to obtain mycosterols fromAgaricus bisporusL. by response surface methodology and comparison with conventional Soxhlet extraction.Food Chemistry, 197(Pt B), 1054–1063.
Ince, A. E., Sßahin, S., & Sßümnü, S. G. (2013). Extraction of phenolic compounds from melissa using microwave and ultrasound.Turkish Journal of Agriculture and Forestry, 37(1), 69–75.
Jain, G., & Gould, K. S. (2015). Functional significance of betalain biosynthesis in leaves of Disphyma australe under salinity stress. Environmental and Experimental Botany, 109, 131–140.
Jerz, G., Gebers, N., Szot, D., Szaleniec, M., Winterhalter, P., & Wybraniec, S. (2014). Separation of amaranthine-type betacyanins by ion-pair high-speed countercurrent chromatography. Journal of Chromatography A, 1344, 42–50.
Jerz, G., Skotzki, T., Fiege, K., Winterhalter, P., & Wybraniec, S. (2008). Separation of betalains from berries of Phytolacca americana by ion-pair high-speed counter-current chromatography.Journal of Chromatography A, 1190(1–2), 63–73.
Kalil, S., & Maugeri, F. (2000). Response surface analysis and simulation as a tool for bioprocess design and optimization.Process Biochemistry, 35, 539–550.
Kemmer, G., & Keller, S. (2010). Nonlinear least-squares data fitting in Excel spreadsheets.Nature Protocols, 5(2), 267–281.
Li, H., Deng, Z., Liu, R., Zhu, H., Draves, J., Marcone, M., & Tsao, R. (2015). Characterization of phenolics, betacyanins and antioxidant activities of the seed, leaf, sprout, flower and stalk extracts of three Amaranthus species.Journal of Food Composition and Analysis, 37, 75–81.
Martins, N., Roriz, C. L., Morales, P., Barros, L., & Ferreira, I. C. F. R. (2016). Food colorants: Challenges, opportunities and current desires of agro-industries to ensure consumer expectations and regulatory practices.Trends in Food Science and Technology, 52, 1–15.
Mastuti, R., Arumingtyas, E. L., & Fatinah, A. A. (2015). Genetic diversity of celosia variants in east java based on polyphenol oxidase-PPO genes. Procedia Chemistry, 14, 361–366.
Nemzer, B., Pietrzkowski, Z., Spórna, A., Stalica, P., Thresher, W., Michałowski, T., & Wybraniec, S. (2011). Betalainic and nutritional profiles of pigment-enriched red beet root (Beta vulgaris L.) dried extracts.Food Chemistry, 127(1), 42–53.
Pavlov, A., & Bley, T. (2006). Betalains biosynthesis by Beta vulgaris L. hairy root culture in a temporary immersion cultivation system.Process Biochemistry, 41 (4), 848–852.
Piattelli, M., de Nicola, M. G., & Castrogiovanni, V. (1971). The effect of kinetin on amaranthin synthesis in Amaranthus tricolor in darkness.Phytochemistry, 10(2), 289–293.
Pinela, J., Prieto, M. A., Barreiro, M. F., Carvalho, A. M., Oliveira, M. B. P. P., Vázquez, J. A., & Ferreira, I. C. F. R. (2016). Optimization of microwave-assisted extraction of hydrophilic and lipophilic antioxidants from a surplus tomato crop by response surface methodology.Food and Bioproducts Processing, 98, 283–298.
Prikler, S. (2009). Robert de Levie: Advanced Excel for scientific data analysis, 2nd ed.Analytical and Bioanalytical Chemistry, 395(7), 1945.
Ranic, M., Nikolic, M., Pavlovic, M., Buntic, A., Siler-Marinkovic, S., & Dimitrijevic-Brankovic, S. (2014). Optimization of microwave-assisted extraction of natural antioxidants from spent espresso coffee grounds by response surface methodology.Journal of Cleaner Production, 80, 69–79.
Roriz, C. L. C. L., Barros, L., Carvalho, A. M., Santos-Buelga, C., & Ferreira, I. C. F. R. F. R. (2014). Pterospartum tridentatum, Gomphrena globosa and Cymbopogon citratus: A phytochemical study focused on antioxidant compounds. Food Research International, 62, 684–693.
Schliemann, W., Cai, Y., Degenkolb, T., Schmidt, J., & Corke, H. (2001). Betalains of Celosia argentea.Phytochemistry, 58(1), 159–165.
Schmid, R. (2001). Recent advances in the description of the structure of water, the hydrophobic effect, and the like-dissolves-like rule. Monatshefte Fur Chemie, 132, 1295.
Silva, L. R., Valentão, P., Faria, J., Ferreres, F., Sousa, C., Gil-Izquierdo, A., ... Andrade, P. B. (2012). Phytochemical investigations and biological potential screening with cellular and non-cellular models of globe amaranth (Gomphrena globosa L.) inflorescences.Food Chemistry, 135(2), 756–763.
Stagnari, F., Galieni, A., Speca, S., & Pisante, M. (2014). Water stress effects on growth, yield and quality traits of red beet.Scientia Horticulturae, 165, 13–22.
Swarna, J., Lokeswari, T. S., Smita, M., & Ravindhran, R. (2013). Characterisation and determination of in vitro antioxidant potential of betalains from Talinum triangulare (Jacq.) Willd.Food Chemistry, 141(4), 4382–4390.
Taira, J., Tsuchida, E., Katoh, M. C., Uehara, M., & Ogi, T. (2015). Antioxidant capacity of betacyanins as radical scavengers for peroxyl radical and nitric oxide.Food Chemistry, 166, 531–536.
Vogt, T., Ibdah, M., Schmidt, J., Wray, V., Nimtz, M., & Strack, D. (1999). Light-induced betacyanin and flavonol accumulation in bladder cells of Mesembryanthemum crystallinum.Phytochemistry, 52(4), 583–592.