Prevalence of malnutrition and associated
factors in hemodialysis patients
1Prevalência de desnutrição e fatores associados
em pacientes em hemodiálise
Ana Tereza Vaz de Souza FREITAS2
Inaiana Marques Filizola VAZ3
Sanzia Francisca FERRAZ4
Maria do Rosário Gondim PEIXOTO5
Marta Isabel Valente Moraes CAMPOS3
A B S T R A C T
Objective
To assess the prevalence of malnutrition and associated factors in hemodialysis patients.
Methods
This is a cross-sectional study of 344 hemodialysis patients from Goiânia, Goiás aged 18 years or more. The dependent variable, malnutrition, was investigated by the Subjective Global Assessment. The independent variables included socioeconomic, demographic, and lifestyle data, clinical history, and energy and protein intakes. The patients underwent anthropometric measurements and laboratory tests. Multiple Poisson regression determined the associated factors (p<0.05).
Results
Mild or moderate malnutrition was found in 22.4% of the patients. Malnourished patients had lower body mass index, mid-arm muscle circumference, percentage of body fat, serum creatinine (p<0.001), and normalized protein nitrogen appearance (p=0.001). Multivariate analysis identified the following factors associated with malnutrition: age between 19 and 29 years (PR=1.23, 95%CI=1.06-1.43), family income less than 2 minimum salaries (PR=1.13, 95%CI=1.01-1.27), hemodialysis vintage ≥60 months (PR=1.08, 95%CI=1.01-1.16), Kt/V≥1.2 (RP=1.12, 95%CI=1.03-1.22), calorie intake <35 kcal/kg/day (PR=1.22, 95%CI=1.10-1.34), and normalized protein nitrogen appearance <1.0 g/kg/day (PR=1.13, 95%CI=1.05-1.21).
1
Article based on doctoral dissertation of ATVS FREITAS intitled “Prevalência e fatores associados à desnutrição e à obesidade abdominal em pacientes em hemodiálise na cidade de Goiânia-GO”. Universidade Federal de Goiás; 2011.
2
Universidade Federal de Goiás, Faculdade de Nutrição. R. 227, Qd. 68, s/n., Setor Leste Universitário, 74605-080, Goiânia, GO, Brasil. Correspondência para/Correspondence to: ATVS FREITAS. E-mail: <[email protected]>.
3
Universidade Federal de Goiás, Hospital das Clínicas, Departamento de Nutrição e Dietética. Goiânia, GO, Brasil.
4
Secretaria Estadual de Saúde, Hospital de Doenças Tropicais. Goiânia, GO, Brasil.
5
Conclusion
The prevalence of malnutrition in this population was high, corroborating the literature. The prevalence was higher in patients aged less than 29 years and those with low family income, longer hemodialysis vintage, higher Kt/V, and inadequate protein and calorie intakes. Strategies to reverse this situation should include more nutritional care.
Indexing terms: Malnutrition. Nutrition assessment. Renal dialysis.
R E S U M O
Objetivo
Avaliar a prevalência e os fatores associados à desnutrição em pacientes em hemodiálise.
Métodos
Estudo transversal com 344 pacientes maiores de 18 anos em hemodiálise em Goiânia, Goiás. A variável dependente, desnutrição, foi obtida por meio da avaliação subjetiva global. As variáveis independentes envolveram aspectos socioeconômicos, demográficos, estilo de vida, história clínica, ingestão energética e proteica. Realizaram-se antropometria e exames laboratoriais. A análise dos fatores associados foi realizada por regressão de Poisson múltipla (p<0,05).
Resultados
A prevalência de desnutrição leve ou moderada foi constatada em 22,4% dos pacientes. Os pacientes desnutridos apresentaram menor índice de massa corporal, menor circunferência muscular do braço, menor porcentagem de gordura corporal, menor valor de creatinina sérica (p<0,001) e nPNA (p=0,001).O resultado final da análi-se multivariada identificou os fatores associados à desnutrição: idade de 19 a 29 anos (RP=1,23; IC95%=1,06-1,43), renda familiar <2 salários-mínimos (RP=1,13; IC95%=1,01-1,27), tempo em HD ≥60 meses (RP=1,08; IC95%=1,01-1,16), Kt/V ≥1,2 (RP=1,12; IC95%=1,03-1,22), ingestão calórica inferior a 35 kcal/kg/dia (RP=1,22; IC95%=1,10-1,34) e nPNA <1,0 g/kg/dia (RP=1,13; IC95%=1,05-1,21).
Conclusão
Observou-se alta prevalência de desnutrição na população estudada em acordo com o encontrado na literatura. A prevalência foi maior entre os pacientes com idade inferior a 29 anos, renda familiar baixa, maior tempo em hemodiálise, maior Kt/V e ingestão calórica e proteica inadequadas. Estratégias para reverter esta situação devem envolver maior atenção nutricional.
Termos de indexação: Desnutrição. Avaliação nutricional. Diálise renal.
I N T R O D U C T I O N
With a prevalence of 10 to 60%1,
malnutrition continues to be a problem in Chronic Renal Failure (CRF) patients on Hemodialysis (HD),
increasing their morbidity and mortality1,2-5.
Factors that discourage food intake and promote hypercatabolism can lead to malnutrition. Among them are anorexia due to uremia, gastrointestinal disorders, psychological factors, severe dietary restrictions, social problems, comorbidities, inflammatory processes, and hypercatabolism due to nutrient losses during
dialysis and metabolic changes6,7.
Detecting malnutrition in CRF patients is
a challenge2. There is no single objective method
capable of diagnosing malnutrition accurately in
HD patients5. Biochemical and anthropometric
indicators can be influenced by comorbidities, inflammatory status, hydration status, observer experience, and absence of reference standards
for HD individuals8.
In this context, the Subjective Global Assessment (SGA) has been used to assess the
nutrition status of HD patients9. This technique
relates objective and subjective aspects of the
clinical history and physical examination2. The SGA
interviewer training, and has good reproductibility4,10, being recommended by the National Kidney Foundation-Kidney Disease Outcomes Quality
Initiative (NKF-K/DOQI)10. Multicentric and
longitudinal studies have claimed that the SGA is associated with morbidity, mortality, and
hositalization1,2, and correlates well with
anthropometric measurements4.
In addition to diagnosing nutritional status, identifying clinically controllable risk factors that promote nutritional deficits is very important for
planning specific interventions9. However, given
the multicausality of malnutrition in CRF6,7, one
should consider the relationships between its determinants when implementing prevention, diagnostic, and control strategies.
Considering this logic, the magnitude of CRF in Brazil, its impacts on nutritional status, and the absence of data on the prevalence of malnutrition in HD patients in the Brazilian
Midwest Region, especially Goiás, this study
aimed to estimate the prevalence of malnutrition in an HD population and establish the determinants of malnutrition.
M E T H O D S
This cross-sectional study with a proportional, stratified sample from ten centers representative of the HD population of the city of Goiânia (GO) collected data from May 2009 to March 2010.
The sample size was given by the number of municipal HD patients aged 18 years or more (n=1,400), the prevalence of malnutrition, which
varies from 10 to 60% in HD patients3-5, sample
maximization to 50%, confidence interval of 95%, and error of 5%. Hence, the estimated sample size was 302 patients. An extra 20% was included to compensate for losses and refusals, totaling 362 individuals, of which 344 remained in the study. The remainder (n=18) either dropped out or did not provide all the required information.
Considering the total number of patients in each clinic, the sample was selected by simple random sampling and consisted of clinically stable, not institutionalized males and females aged 18 years or more who had been undergoing hemodialysis for at least three months.
The exclusion criteria were: infections in the last three months, cancer, tuberculosis, acquired immunodeficiency syndrome, severe chronic obstructive pulmonary disease, severe cardiovascular disease, cerebrovascular disease, symptomatic heart failure classes III and IV, pregnancy, venous catheter dialysis, and diseases or situations that prevented anthropometric and food intake assessments, such as advanced bone diseases, stroke sequelae, physical disabilities, or amputated limbs.
The study collected socioeconomic, demographic, lifestyle, and anthropometric data, clinical history, and energy intake; administered the SGA; and performed laboratory tests. Four dieticians trained specifically for this study collected the data mentioned above using standard forms, pretested in a pilot study.
Nutritional status was classified according
to the SGA, as recommended by the NKF-KDOQI10
and validated by Steiber et al.2 for HD patients.
This protocol uses a 7-point scale to measure each one of the six SGA items (changes in body weight, energy intake, gastrointestinal symptoms, functional capacity, diseases and comorbidities that affect nutritional requirements, and physical examination to investigate subcutaneous fat loss, muscle mass loss, and presence of edema or ascites). The present study used the cutoff points recommended by the KDOQI, which classifies patients as nourished when the scores 6 or 7 prevail; mildly or moderately malnourished when the scores 3, 4, or 5 prevail; and severely
malnourished when the scores 1 or 2 prevail10.
high school, and higher education); and family income according to number of minimum salaries (<2, 2-5, and >5).
Lifestyle data included smoking status (nonsmoker, smoker, ex-smoker - those who had not smoked in at least six months), alcohol intake (regardless of beverage type or amount), physical activity during leisure time (yes or no), at home (performs or not physically-demanding chores), at work (has or does not have physically-demanding tasks), and physical activity commuting (inactive if the patient uses a vehicle,
or walks or bicycles for less than ten minutes)11.
Individuals inactive in all four categories above were considered inactive, and those active in at least one category above were considered active.
The clinical history data taken from the patients’ medical records and confirmed with their physicians included CRF etiology, presence of comorbidities, and HD vintage.
Six 24-hour dietary recalls, three of HD days and three of non-HD days, excluding Sundays, collected dietary data. A program based mainly on the Brazilian Food Composition Table developed specifically for this study (www.dbcheckout.com.br/nutri) calculated the mean energy intake for those six days. Protein intake was estimated by calculating the Protein equivalent of total Nitrogen Appearance (PNA)
of the midweek dialysis10 as follows: PNA (g/day):
pre-dialysis BUN/{[25.8+(1.15÷Kt/V)]+(56.4÷Kt/ V)}+0.168, where BUN, Blood Urea Nitrogen in mg/dL= blood urea (mg/dL)÷2.14. The result was normalized to the ideal weight as recommended
by NKF-KDOQI10 and European Best Practice
Guidelines (EBPG)12. A normalized PNA (nPNA)
>1.0 g/kg was considered adequate12.
Two dieticians took the anthropometric measurements after the midweek dialysis as
recommended by Lohman et al.13 and standardized
the data as recommended by Habicht14. The
measurements included weight, height, Mid-Arm Circumference (MAC), and Triceps (TST), Subscapular (SST), Biceps (BST), and Suprailiac Skinfold Thicknesses (SIST).
Body Mass Index (BMI) was given by the dry weight-to-height squared ratio, and nutritional status was classified as recommended
by the World Health Organization (WHO)15.
Mid-Arm Muscle Circumference (MAMC) was given by the equation MAMC=MAC(cm)-{3.14x[TST(mm)÷10]}, and the result by gender was compared with the reference standards
proposed by Frisancho16 and classified as
recommended by Blackburn & Harvey17.
Body fat was estimated by adding the four skinfold thicknesses (TST, SST, BST, and SIST) using the body density equations proposed by Durnin
& Womersley18. The percentage of body fat was
given by the equation proposed by Siri19. Since
no ideal percentage of body fat has been established for HD patients, the cutoff points used by the present study were up to 25 and 32% of
males’ and females’ body weight, respectively20.
The biochemical tests included serum albumin (colorimetric method using bromocresol green) before dialysis, creatinine, and urea (kinetic method) before and after dialysis. All tests were performed by the clinical analysis laboratory of the Hospital das Clínicas of the Universidade Federal de Goiás (HC/UFG). Serum albumin >4 g/dL
and creatinine ≥10 mg/dL were considered
normal12. Dialysis was considered adequate when
the patient’s Kt/V index ≥1.221.
The data were entered twice in the program Epi Info 6.0 to check for consistency and analyzed by the statistical package Stata 8.0. The categorical variables were expressed as frequencies and percentages, and the continuous variables as mean and standard deviation after the Kolmogorov Smirnov test checked data
normality (p≥0.05).
The prevalence of malnutrition was calculated for each study variable. Simple Poisson regression investigated which factors, if any, were associated with malnutrition. Variables with a
statistical significance ≤0.20 were tested in
multivariate analysis by Poisson regression with robust variance estimate, and the Wald test assessed statistical significance. The variables with
The project was approved by the Research Ethics Committee of HC/UFG (nº 011/2009) and
of the Santa Casa de Misericórdia of Goiânia (nº
046/2009), and all participants signed an Informed Consent Form. The entire sample was being followed regularly by dieticians.
R E S U L T S
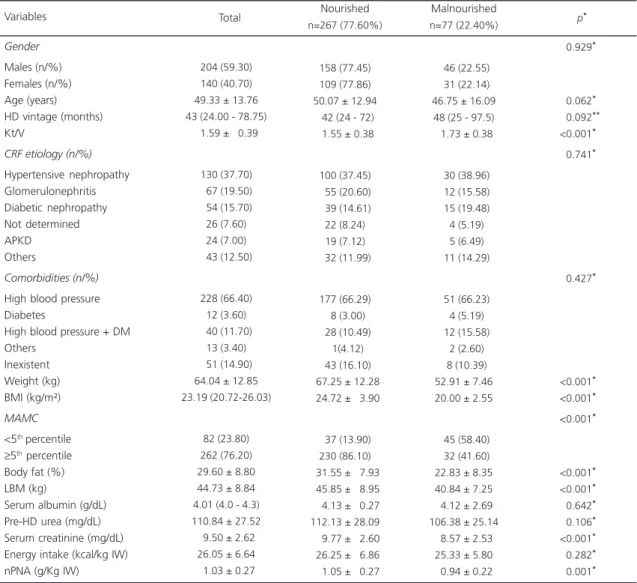
Table 1 describes the demographic, clinical, and nutritional characteristics of the study
sample (n=344). The prevalence of malnutrition according to the SGA was 22.40%. Malnutrition was either mild or moderate, regardless of gender
(p=0.92). Most malnourished individuals were
males (59.30%) with a mean age of 49.33 ± 13.76 years; the main etiologies were hypertensive nephropathy (37.70%) followed by glomerulonephritis (19.50%) and diabetic nephropathy (15.70%). High blood pressure was the most common comorbidity (66.40%). The median BMI and serum albumin were appropriate,
Table 1. Demographic, clinical, and nutritional characteristics of hemodialysis patients according to their nutritional status classified by the subjective global assessment. Goiânia (GO), Brasil, 2010.
Gender
Males (n/%) Females (n/%) Age (years) HD vintage (months) Kt/V
CRF etiology (n/%)
Hypertensive nephropathy Glomerulonephritis Diabetic nephropathy Not determined APKD Others Comorbidities (n/%)
High blood pressure Diabetes
High blood pressure + DM Others
Inexistent Weight (kg) BMI (kg/m²)
MAMC
<5th percentile
≥5th percentile
Body fat (%) LBM (kg)
Serum albumin (g/dL) Pre-HD urea (mg/dL) Serum creatinine (mg/dL) Energy intake (kcal/kg IW) nPNA (g/Kg IW) Variables
204 (59.30) 140 (40.70) 49.33 ± 13.76 43 (24.00 - 78.75)
01.59 ± 00.39
130 (37.70)
067 (19.50)
054 (15.70) 26 (7.60) 24 (7.00)
043 (12.50)
228 (66.40) 12 (3.60)
040 (11.70) 13 (3.40)
051 (14.90) 64.04 ± 12.85 23.19 (20.72-26.03)
82 (23.80) 262 (76.20) 29.60 ± 8.80 44.73 ± 8.84 4.01 (4.0 - 4.3) 110.84 ± 27.52
09.50 ± 2.62 26.05 ± 6.64
01.03 ± 0.27
158 (77.45) 109 (77.86) 50.07 ± 12.94
042 (24 - 72)
01.55 ± 0.38
100 (37.45)
055 (20.60)
039 (14.61) 22 (8.24) 19 (7.12)
032 (11.99)
177 (66.29)
08 (3.00)
028 (10.49)
01(4.12)
043 (16.10)
067.25 ± 12.28
024.72 ± 03.90
037 (13.90) 230 (86.10)
031.55 ± 07.93
045.85 ±0 8.95
004.13 ± 00.27 112.13 ± 28.09
009.77 ± 02.60
026.25 ± 06.86
001.05 ±0 0.27
Total Nourished
n=267 (77.60%)
046 (22.55)
031 (22.14) 46.75 ± 16.09 48 (25 - 97.5)
01.73 ± 0.38
030 (38.96)
012 (15.58)
015 (19.48)
04 (5.19)
05 (6.49)
011 (14.29)
051 (66.23)
04 (5.19)
012 (15.58)
02 (2.60)
08 (10.39) 52.91 ± 7.46 20.00 ± 2.55
045 (58.40)
032 (41.60) 22.83 ± 8.35 40.84 ± 7.25
04.12 ± 2.69 106.38 ± 25.14
08.57 ± 2.53 25.33 ± 5.80
00.94 ± 0.22
<0.929**
<0.062**
<0.092**
<0.001**
<0.741**
<0.427**
<0.001**
<0.001**
<0.001**
<0.001**
<0.001**
<0.642**
<0.106**
<0.001**
<0.282**
<0.001**
Malnourished
n=77 (22.40%) p
*
Note: *t test or Pearson’s Chi-square test; **Mann Whitney test.
but mean serum creatinine was low (9.50 ± 2.62 mg/dL). Based on BMI, 8.72% of the patients were underweight, 59.01% were normal weight, and 32.27% were overweight. Most patients had appropriate serum albumin (77.91%) and low serum creatinine (58.72%).
In comparison with nourished patients (SGA), malnourished patients have smaller
anthropometric parameters, namely body weight, BMI, % of body fat, MAMC, and lean body mass
(p<0.001); higher Kt/V (p<0.001); and lower
serum creatinine (p<0.001) and nPNA (p=0.001)
(Table 1).
The prevalence of malnutrition was significantly higher in patients aged 19 to 29 years (50.00%) and in those with family income below
Table 2. Sample distribution, prevalence of malnutrition according to the subjective global assessment, and prevalence ratio of hemodialysis patients according to demographic, socioeconomic, and clinical variables, energy intake, and nPNA. Goiânia
(GO), Brazil, 2010.
Age (years)
19 to 29 30 to 39 40 to 49 50 to 59 >60
Education level
No education Elementary grades 1-4 Elementary grades 5-8 High school Higher education Marital status Has partner No partner Family income <2 MS 2-5 MS >5 MS HD vintage
≥60 months <60 months Kt/V ≥1.2 <1.2 kcal/kg IW ≥35 <35
nPNA (g/kg IW)
Adequate (≥1 g) Inadequate (<1 g)
24 62 88 84 86 7 117 104 79 37 203 141 161 146 37 128 216 288 56 29 315 173 171 06.98 18.02 25.58 24.42 25.00 02.03 34.01 30.23 22.97 10.76 59.01 40.99 46.80 42.44 10.76 37.21 62.79 83.72 16.28 08.43 91.57 50.29 49.71
Variables Sample distribution
n % 12 14 17 16 18 1 33 14 21 8 39 38 44 28 5 35 42 71 6 2 75 26 51 50.00 22.58 19.32 19.05 20.93 14.29 28.21 13.46 26.58 21.62 19.21 26.95 27.33 19.18 13.51 27.34 19.44 24.65 10.71 06.90 23.81 15.03 29.82 Prevalence n %
1.24 (1.06 - 1.44) 1.01 (0.91 - 1.13) 0.98 (0.89 - 1.09) 0.98 (0.89 - 1.09)
1
0.94 (0.73 -1.20) 1.05 (0.92 - 1.19) 0.93 (0.82 - 1.05) 1.04 (0.91 - 1.19)
1
1.00 1.06 (0.99-1.14)
1.12 (1.01 - 1.25) 1.05 (0.94 - 1.17)
1
1.00 (0.99 - 1.15) 1
1.12 (1.03 - 1.22) 1
1 1.15 (1.05 - 1.27)
1 1.12 (1.05 - 1.21)
(95%CI) Crude PR >0.030 >0.050 >0.093 >0.070 >0.094 >0.005 >0.002 >0.001 p-value*
Note: *Wald test.
two minimum salaries (27.33%), whose prevalence was 1.12 times higher than that of patients with family income above five minimum salaries. Malnutrition was also associated with Kt/V above 1.2 (24.65%). An energy intake below 35 kcal/kg/day (23.81%) and nPNA below 1.0 g/kg (29.82%) increased the prevalence of malnutrition by 1.15 and 1.12 times, respectively (Table 2). The variables gender, physical activity, smoking status, alcohol intake, comorbidities, and etiology were not associated with malnutrition and were not tested in the final multivariate analysis model (p>0.20).
Multivariate analysis included the following variables: age, education level, marital status, family income, HD vintage, Kt/V, energy intake, and nPNA. In the final multivariate analysis model, the following factors remained associated with malnutrition: age between 19 and 29 years (PR=1.23; 95%CI=1.06-1.43), family income below two minimum salaries (PR=1.13; 95%CI=1.01-1.20), longer HD vintage (PR=1.08; 95%CI= 1.01-1.16), energy intake below 35 kcal/kg/ day (PR=1.22; 95%CI=1.10-1.34), and inappropriate nPNA (PR=1.13; 95%CI=1.05-1.21) (Table 3).
D I S C U S S I O N
The prevalence of mild and moderate malnutrition in the study sample was 22.40% according to the SGA. This prevalence was lower
than that found by Steiber et al.2, who found a
prevalence of moderate malnutrition of 29.00% in 156 HD patients, and higher than that found
by the multicentric contrast study3, which used
the same diagnostic method (SGA <6) and found a prevalence of moderate malnutrition of 17.00% in 560 patients. On the other hand, the percentage of malnourished patients in the present study was similar to that reported by the Netherlands Co-operative Study Adequacy of Dialysis II (NECOSAD-II), where 23.00% (n=1,601)
of the patients were moderately malnourished1.
Severe malnutrition defined by an SGA score of
1 or 2 also was not found by other studies2,3.
The prevalence of mild and moderate malnutrition found by earlier Brazilian studies
varied from 39.7 to 80.0%22-24. However,
comparison with such studies is inconclusive because they either used other SGA classification
methods22,23 or small sample sizes24.
Malnutrition in HD patients has complex etiology, possibly resulting from disease- and treatment-related factors that further reduce food intake and increase protein catabolism, such as age, poor dialysis, psychosocial problems, hormonal imbalances, comorbidities, metabolic acidosis, inflammatory processes, and HD-related nutrient losses. Early detection of nutritional changes is critical since severe malnutrition is
harder to treat25. In the present study, the risk
factors that determined nutritional inadequacies were age, family income, HD vintage, dialysis adequacy, energy intake, and nPNA.
Table 3. Final multivariate analysis model of malnutrition in hemodialysis patients. Goiânia (GO), Brazil, 2010.
Age (years)
19 to 29 30 to 39 40 to 49 50 to 59 >60
Family income
<2 MS 2-5 MS >5 MS
HD vintage
<60 months
≥60 months
Kt/V
≥1.2 <1.2
kcal/kg IW
≥35 <35
nPNA (g/kg IW)
Adequate (≥1 g) Inadequate (<1 g) Variables
1.23 1.00 0.98 0.96 1
1.13 1.05 1
1 1.08
1.12 1
1 1.22
1 1.13
1.06-1.43 0.90-1.12 0.89-1.08 0.87-1.07
-1.01-1.27 0.94-1.17
-1.01-1.16
1.03-1.22
-1.10- 1.34
-1.05-1.21
0.006 0.929 0.713 0.485
-0.020 0.356
-0.035
0.010
-<0.001
0.001 Adjusted PR 95%CI p-value*
Note: *Wald test.
The younger individuals in the study sample were at greater risk of malnutrition,
contrary to Burrowes et al.26, who found that older
patients had worse nutritional status. Our younger patients had lower weight, BMI, percentage of body fat, and lean body mass, and the main etiology was glomerulonephritis (data not shown). The factors that possibly worsened the nutritional status of these younger adults were inadequate protein intake along with higher energy expenditure secondary to age and dialysis-related
catabolism6,7. In these cases the principal
recommendations for correcting nutritional status are greater surveillance, proper food intake and more physical activity to increase body weight,
especially lean body mass5,6,9.
The inverse relationship between malnutrition and family income reinforces the influence of the latter on nutritional status, exposing the individual to food insecurity and violating one of the principles of a healthy diet, which is guaranteed physical and financial access
to appropriate food27. Poor access to appropriate
food worsens nutritional status, decreases adherence to treatment, increases mortality, and
reduces survival28.
Patients with HD vintage longer than five years were more likely to be malnourished,
corroborating Chumlea et al.29, who found a
direct association between long HD vintage and poor nutritional parameters. Additionally, hemodialysis is highly catabolic, promoting significant loss of essential nutrients, such as
amino acids, proteins, vitamins, and glucose7. If
these nutrients are not adequately replenished, nutritional status may worsen over time. Bohé &
Rennie6 claim that individuals on dialysis three
times a week lose 2 kg of lean body mass a year.
The prevalence of malnutrition was also higher in study individuals with adequate dialysis according to the Kt/V index. Since malnourished individuals have smaller body volumes, they are susceptible to an increase in Kt/V, so the possibility of malnutrition exists even when dialysis is
efficient10. However, inadequate dialysis may
indirectly compromise nutritional status, since
underdialyzed patients with Kt/V below 1.221 can
experience less hunger because of the
accumulation of uremic toxins25. Nevertheless,
some studies did not find associations between Kt/V and nutritional status or survival, and shorter HD sessions (<3 hours/session) were associated
with higher mortality, regardless of Kt/V30,31. The
Hemo study (n=1,846) found that random patients receiving a high dialysis dose (Kt/V 1.65) did not consume more energy and proteins than random patients receiving the standard dose (Kt/V 1.25); moreover, both groups experienced
similar weight loss and serum albumin reduction32.
The factors mentioned earlier, namely age, income, and HD vintage, lead to low energy and protein intakes, which directly impact nutritional status. Inadequate food intake, which generally begins before the introduction of renal replacement
therapy12, is one of the main determinants of
worse clinical outcomes in these patients, promoting weight loss, decreasing survival, and
increasing morbidity and mortality10,12.
Patients with inadequate energy and protein intakes had higher prevalence of malnutrition, suggesting that energy and protein deficits play an important role in malnutrition in dialysis patients. Low protein and especially energy intakes have been observed in HD patients24.
The vast majority of the study sample (91.57%) ingested fewer than 35 kcal/kg/day; of these, 47.97% ingested fewer than 25 kcal/kg/ day, and the nPNA of 49.71% was below 1.0 g/kg/day. This is concerning because, according
to the classical study by Slomowitz et al.25, 35-45
kcal/kg/day are necessary to revert a negative nitrogen balance in individuals consuming fewer than 25 kcal/kg/day. At least 1.0 g of protein/kg/ day is necessary to replenish the nutrients lost in hemodialysis and achieve positive nitrogen
balance in clinically stable patients12. Additionally,
adequate energy intake prevents the use of
protein for energy25.
body protein loss, and low serum albumin and
creatinine in HD patients9,25. These parameters
were lower in the malnourished study patients, except for serum albumin. This indicates the importance of HD patients gaining body weight, especially lean body mass, because weight gain would imply better functional and immune statuses, greater independence, and lower
malnutrition-related morbidity and mortality6.
One of the study limitations was the impossibility of analyzing an inflammatory marker capable of distinguishing between malnutrition and inflammation-induced malnutrition. Only eleven (14.29%) of the malnourished study patients had serum albumin below 3.8 g/dL,
suggestive of malnutrition and inflammation2, a
prevalence lower than the 18% found by Steiber et al.2. Since most of the study population had serum albumin above 4 g/dL and were not malnourished, inflammation probably had at most a small influence on their nutritional status. Another limitation is not having analyzed the residual diuresis of 27 patients to calculate PNA. However, PNA remained associated with malnutrition even when these patients’ data were excluded from data analysis.
Another limitation is the use of the 24-hour recall to investigate food intake since this instrument is subject to the interviewee’s memory and collaboration, and to underreporting and overreporting. However, the use of six dietary recalls improved the accuracy of the food intake data because it reduced the intrapersonal daily
intake variability33. The study strengths are the
use of a sample representative of the HD
population of Goiânia (GO) and analysis of the
isolated effect of many factors that can impact the nutritional status of these patients.
C O N C L U S I O N
The prevalence of malnutrition in the study population was high, corroborating the literature. The prevalence was greater in patients aged less than 29 years and in those with low family income, longer hemodialysis vintage, higher Kt/V,
and inadequate calorie and protein intakes. Strategies to revert this situation should include greater nutritional care.
C O N T R I B U T O R S
ATVS FREITAS, IMF VAZ, and SF FERRAZ helped to conceive the study; collect, analyze, and interpret the data; and write the manuscript. MRG PEIXOTO helped to analyze and interpret the results and to write the manuscript. MIVM CAMPOS helped to interpret the data. All authors reviewed the manuscript.
R E F E R E N C E S
1. Mutsert R, Grootendorst DC, Boeschoten EW, Brandts H, Manen JGV, Krediet RT, et al. Subjective global assessment of nutritional status is strongly associated with mortality in chronic dialysis patients. Am J Clin Nutr. 2009; 89(3):787-93. doi: 10.3945/ ajcn.2008.26970
2. Steiber A, Leon JB, Secker D, McCarthy M, McCann L, Serra M, et al. Multicenter study of the validity and reability of subjective global assessment in the hemodialysis population. J Ren Nutr. 2007; 17(5):336-42. doi: 10.1053/j.jrn.2007.05.004 3. Mazairac AHA, Wit GA, Grooteman MPC, Penne
EL, Weerd NC, Dorpel MA, et al. A composite score of protein-energy nutritional status predicts mortality in haemodialysis patients no better than its individual components. Nephrol Dial Transplant. 2011; 26(6):1962-7. doi: 10.1093/ndt/gfq643 4. Tapiawala S, Vora H, Patel Z, Badve S, Shah B.
Subjective global assessment of nutritional status of patients with chronic renal insufficiency and end stage renal disease on dialysis. J Assoc Physicians India. 2006; 54:923-6.
5. Combe C, McCullough KP, Asano Y, Ginsberg N, Maroni BJ, Pifer TB. Kidney Disease Outcomes Quality Initiative (K/DOQI) and the Dialysis Outcomes and Practices Patterns Study (DOPPS): Nutrition guidelines, indicators, and practices. Am J Kidney Dis. 2004; 44(Suppl. 2):S39-46. doi: 10.1053/j.ajkd.2004.08.010
6. Bohé J, Rennie MJ. Muscle protein metabolism during hemodialysis. J Renal Nutr. 2006; 16(1):3-16.doi: 10.1053/j.jrn.2005.07.005
8. Oliveira CMC, Kubrusly M, Mota RS, Silva CAB, Oliveira VN. Desnutrição na insuficiência renal crônica: qual o melhor método diagnóstico na prática clínica? J Bras Nefrol. 2010; 32(1):57-70. 9. Chumlea WC. Anthropometric and body composition
assessment in dialysis patients. Semin Dial. 2004; 17(6):466-70. doi: 10.1111/j.0894-0959.2004.1 7607.x
10. National Kidney Foundation Kidney Disease Outcomes Quality Initiative. Clinical practice guidelines for nutrition in chronic renal failure. Am J Kidney Dis. 2000; 35(Suppl. 2):17-55.
11. Organización Panamericana de La Salud. Protocolo y directrices: conjunto de ações para la reducción multifactorial de enfermedades no transmisibles (CARMEN/CINDI). México: OPAS; 1997.
12. Fouque D, Vennegoor M, Wee P, Wanner C, Basci A, Canaud B, et al. EBPG guideline on nutrition. Nephrol Dial Transplant. 2007; 22(Suppl. 2):ii45-ii87. doi: 10.1093/ndt/gfm020
13. Lohman TG, Roche AF, Martorel R. Anthropometric standardization reference manual. Champagne (IL): Human Kinetics Books; 1988.
14. Habicht JP. Estandarizacion de métodos epidemiológicos cuantitativos sobre el terreno. Bol Oficina Sanit Panam. 1974; 76(5):375-84. 15. World Health Organization. Obesity: Preventing and
managing the global epidemic. Geneva: WHO; 1997. Report of a WHO Consultation on Obesity. 16. Frisancho AR. New norms of upper limb fat and muscle areas for assessment of nutritional status. Am J Clin Nutr. 1981; 34(11):2540-5.
17. Blackburn GL, Harvey KB. Nutritional assessment as a routine in clinical medicine. Postgrad Med. 1982; 7(1):46-63.
18. Durnin JV, Womersley J. Body fat assessed from total body density and its estimation from skinfold tickness: Measurements in 481 men and women aged from 16 to 72 years. Br J Nutr. 1974; 32(1):77-9. 19. Siri WE. Body composition from fluid spaces and density analysis of methods. In: Brozek J, Henschel A, Editors. Techniques for measuring body composition. Washington (DC): National Research Council; 1961. p.223-44.
20. Lohman TG. Advances in body composition assessment. Current Issues in exercise science series. Champagne (IL): Human Kinetics; 1992.
21. The National Kidney Foundation Kidney Disease. Outcomes Quality Initiative Clinical practice guidelines for hemodialysis adequacy: Update 2006. Am J Kidney Dis. 2006; 48(1Suppl. 1):S13-97. 22. Oliveira CMC, Kubrusly M, Mota RS, Silva CAB,
Oliveira VN. Desnutrição na insuficiência renal crônica: qual o melhor método diagnóstico na prática clínica? J Bras Nefrol. 2010; 32(1):57-70.
23. Calado IL, Silva AAM, França AKTC, Santos AM, Salgado-Filho N. Diagnóstico nutricional de pacien-tes em hemodiálise na cidade de São Luís (MA). Rev Nutr. 2009; 22(5):687-96. doi: 10.1590/S1415-5 2732009000500009
24. Vegine PM, Fernandes ACP, Torres MRSG, Silva MIB, Avesani CM. Avaliação de métodos para identificar desnutrição energético-protéica de pacientes em hemodiálise. J Bras Nefrol. 2011; 33(1):55-61. 25. Stenvinkel P, Heimburguer O, Lindholm B, kaysen
GA, Bergstrom J. Are there two types of malnutrition in chronic renal failure? Evidence for relationships between Malnutrition, Inflammation and Atherosclerosis (MIA syndrome). Nephrol Dial Transplant. 2000; 15(7):953-60. doi: 10.1093/ndt/ 15.7.953
26. Burrowes JD, Cockram DB, Dwyer JT, Larive B, Paranandi L, Bergen C, et al. Cross-sectional relationship between dietary protein and energy intake, nutritional status, functional status, and comorbidity in older versus younger hemodialysis patients. J Renal Nutr. 2002; 12(2):87-95. 27. Brasil. Ministério da Saúde. Guia alimentar para a
população brasileira: promovendo a alimentação saudável. Brasília: Ministério da Saúde; 2008. Série A. Normas e Manuais Técnicos.
28. Zambonato TK, Thomé FS, Gonçalves LFS. Perfil socioeconomic dos pacientes com doença renal crônica em diálise na região noroeste do Rio Grande do Sul. J Bras Nefrol. 2008; 30(3):192-9.
29. Chumlea WC, Dwyer J, Bergen C, Burkart J, Paranandi L, Frydrych A, et al. Nutritional status assessed from anthropometric measures in the HEMO study. J Renal Nutr. 2003; 13(1):31-8. doi: 10.1053/jren.2003.50003
30. Kalantar-Zadeh K, Supasyndh O, Lehn RS, McAllister CJ, Kopple JD. Normalized protein nitrogen appearance is correlated with hospitalization and mortality in hemodialysis patients with Kt/V greater than 1.20. J Renal Nutr. 2003; 13(1):15-25. doi: 10.10 53/jren.2003.50005
31. Miller JE, Kovesdy CP, Nissenson AR, Mehrotra R, Streja E, Wyck DV, et al. Association of hemodialysis treatment time and dose with mortality and role of race and sex. Am J Kidney Dis. 2010; 55(1):100-12. doi: 10.1053/j.ajkd.2009.08.007
32. Rocco MV, Dwyer JT, Larive B, Greene T, Cockram DB, Chumlea WC, et al. The effect of dialysis dose and membrane flux on nutritional parameters in hemodialysis patients: Results of the HEMO Study. Kidney Int. 2004; 65:2321-34. doi: 10.1111/ j.1523-1755.2004.00647.x
33. Willett W. Nutritional epidemiology. 2nd ed. New York: Oxford University Press; 1998.