1
Universidade Veiga de Almeida, Curso de Nutrição, Laboratório de Nutrição. R. Ibituruna, 108, 1° andar, Bloco C, 20271-020, Tijuca, Rio de Janeiro, RJ, Brasil. Correspondência para/Correspondence to: ACML Falcão. E-mail: <[email protected]>.
2
Universidade do Estado do Rio de Janeiro, Instituto de Nutrição, Departamento de Nutrição Aplicada. Rio de Janeiro, RJ, Brasil.
3
Fundação Oswaldo Cruz, Escola Nacional de Saúde Pública Sérgio Arouca, Departamento de Epidemiologia e Métodos Quantitativos em Saúde. Rio de Janeiro, RJ, Brasil.
Article based on the dissertation of ACML FALCÃO, entitled “Associação das variáveis socioeconômicas, laborais e de saúde relacionadas à Insegurança Alimentar em trabalhadores dos Restaurantes Populares do município do Rio de Janeiro”. Universidade do Estado do Rio de Janeiro; 2013.
Association of socioeconomic, labor and
health variables related to Food Insecurity
in workers of the Popular Restaurants
in the city of
Rio de Janeiro
Associação das variáveis socioeconômicas, laborais
e de saúde relacionadas à Insegurança Alimentar
em trabalhadores dos Restaurantes Populares
do município do Rio de Janeiro
Ana Cristina Marcotullio Lopes FALCÃO1 Odaleia Barbosa de AGUIAR2
Maria de Jesus Mendes da FONSECA3
A B S T R A C T
Objective
This study aimed to analyze the prevalence of perceived food insecurity in households of employees of Popular Restaurants, as well as associate this perception with socioeconomic, labor and health variables.
Methods
Results
The estimated prevalence of food insecurity was 53.7%. The variables: education (OR=2.39; 95%CI=1.38-4.16), time working in kitchens <29 months (OR=2.72; 95%CI=1.44-5.16) and opinion on the satisfaction with food composition and regularity (OR=2.01; 95%CI=1.12-3.57) were significantly associated with food insecurity.
Conclusion
Although the study population find themselves inserted into a social facility to promote food security, food insecurity results are worrying. Additionally, factors like lower education and less time working in restaurants increased the chance to realize their households in food insecurity.
Keywords: Food security. Socioeconomic factors. Workers.
R E S U M O
Objetivo
Este estudo teve como objetivo analisar a prevalência da percepção da insegurança alimentar nos domicílios dos trabalhadores dos restaurantes populares, bem como associar essa percepção às variáveis socioeconômicas, laborais e de saúde.
Métodos
Trata-se de um estudo seccional, com 273 trabalhadores de sete restaurantes localizados no município do Rio de Janeiro. Aplicou-se um questionário com diversas escalas e foram aferidas medidas antropométricas. A avaliação da insegurança alimentar foi realizada por meio da Escala Brasileira de Insegurança Alimentar, que classificou os indivíduos em segurança alimentar e insegurança alimentar. As análises calcularam as odds ratio brutas e as ajustadas. A regressão logística foi efetuada considerando três blocos de variáveis: socioeconômicas, laborais e de saúde.
Resultados
A prevalência de insegurança alimentar estimada foi de 53,7%. As variáveis: escolaridade (OR=2,39; IC95%=1,38-4,16), tempo de trabalho em cozinhas <29 meses (OR=2,72; IC95%=1,44-5,16) e opinião sobre a satisfação na composição e regularidade da alimentação (OR=2,01; IC95%=1,12-3,57) associaram-se significativamente com a insegurança alimentar.
Conclusão
Apesar de a população estudada encontrar-se inserida em um equipamento social destinado a promover a segurança alimentar, os resultados de insegurança alimentar são preocupantes. Além disso, fatores como ter escolaridade mais baixa e menos tempo de trabalho em restaurantes aumentaram a chance de perceber seu domicílio em insegurança alimentar.
Palavras-chave:Segurança alimentar e nutricional. Fatores socioeconômicos. Trabalhadores.
I N T R O D U C T I O N
The debate about food insecurity remains in the public agendas because the world admittedly has the technology and knowledge necessary to solve most problems related to access to adequate quality food. However, the solutions do not seem to have been implemented at the necessary scale.
A study conducted in 2012 by the United States Department of Agriculture (USDA) found
a prevalence of food insecurity of 14.5%, where one or more family members reduced food intake or skipped some meals throughout the year1. In
Brazil the 2009 Pesquisa Nacional por Amostra de Domicílios (PNAD, National Household Sample Survey) found large prevalences of mild (18.7%), moderate (6.5%), and severe (5.0%) food insecurity2. Among socioeconomic factors,
food qualitatively and quantitatively to a significant percentage of the population3.
The Política Nacional de Segurança Ali-mentar e Nutricional (PNSAN, National Food Security Policy) consists of programs and actions that allow regular and permanent access to adequate quality food, and food practices that promote health and are environmentally sustainable. One of the programs is the very affordable food services called Popular Restaurants4.
Popular Restaurants produce and sell healthy and balanced meals at US$0.43. Their main objective is to form a network of social protection and promotion in areas with great concentrations of low-income workers, older adults, unemployed individuals, students, and street dwellers at risk or socially vulnerable, ensuring their right to food5.
In the State of Rio de Janeiro, Popular Restaurants are managed by the Secretaria de Estado, As-sistência Social e Direitos Humanos (SEASDH, State Department of Social Assistance and Human Rights) and run by outsourced food services6. In 2013 the Associação Brasileira das Empresas de Refeições Coletivas (ABERC, Brazilian Food Service Association) estimated that the sector had 195 thousand employees7.
The main characteristics of these workers is low skill level, low education level, low income, and high turnover8-10. This description of the
workers is similar to that of Popular Restaurants users and also of the food insecure population.
The objective of this study was to analyze the prevalence of perceived food insecurity at the households of Popular Restaurants workers and associate this perception with socioeconomic, labor, and health variables.
M E T H O D S
This is a cross-sectional study based on the thesis “Prospective study of Popular Restaurants workers from Rio de Janeiro”. The workers first contacted in 2010 to learn about the study. The first and second data collections happened in 2011 and 2013, respectively.
The study consisted of workers involved in meal preparation in seven Popular Restaurants in Rio de Janeiro (Campo Grande, Central,Bangu, Bonsucesso, Irajá, Madureira, and Méier) that were open in 2011. Trained interviewers administered a questionnaire to the workers and took their anthropometric measurements. The interviewees were dieticians, administrative assistants, stockists, stockist assistants, cooks, cook assistants, cashiers, butchers, butcher assistants, attendants, and general service assistants. One cook and seven watchmen from the night shift were excluded from the study because they were unavailable at better hours.
The first contact with the restaurants resulted in a list of positions of 401 workers in October 2010. In February, when data collection began and one of the restaurants was closed for remodeling, 308 employees were available. Of these, 17 (3.6%) had been transferred and 18 (4.9%) were on a health leave of absence. Therefore, 273 employees were interviewed and measured between February and December 2011.
The data collection team was trained for standardizing the interviews. They read the interviewer’s manual, simulated questionnaire administration, and measured height, weight, and waist circumference twice to reduce intra- and inter-measurer variation.
A simple random sampling was done in 10% of the questionnaires to check the answers and review data entry. The sampling was done by the software R version 2.15.211.
Food insecurity was assessed by the Escala Brasileira de Insegurança Alimentar (EBIA, Brazilian Food Insecurity Scale), which has been translated and validated to the Portuguese language with 14 absolute questions (yes/no)12.
The scale classifies households as food secure, mildly food insecure, moderately food insecure, and severely food insecure13 based on the
1. Set of sociodemographic variables: gender, education level (elementary school - up to nine years of formal education; high school or more - more than nine years of formal education); age group (19-39 years old; 40 or more years old); marital status (married/single); skin color (white/ brown/black); children (yes/no); home (owned or other - rented, borrowed, or others); basic sanitation composed of the variables: sanitary conditions, garbage collection, and piped water (very good/good/regular); whether the individual receives benefits: welfare, disability pension, social rent, special child; socioeconomic class according to the Associação Brasileira de Empresas de Pesquisa (ABEP, Brazilian Association of Survey Companies)14 (B1/B2, C1, C2/D); household
income per member - minimum salary (more than 2 to 5, more than 1 to 2, more than ½ to 1, more than ¼ to ½, up to ¼); satisfaction with food prices (satisfied/unsatisfied).
2. Set of labor variables: position - ADM/ Die (stockist, head cook, Administrative Assistant/ Dietician), production (cook assistant, cook, butcher), GSA/Attendant (General Service Assistant and attendant); time working in Popular Restaurants - in tertiles: <29 months, ≥29 months, and <72 months, ≥72 months); commuting time (<40 minutes, ≥40 minutes, and <60 minutes, ≥60 minutes); and whether the individual had other jobs to increase income (yes/no).
3. Set of health variables: perceived health (very good, good, regular/bad); Body Mass Index (BMI) (normal/overweight); satisfaction with diet composition and regularity (satisfied/dissatisfied); diet self-assessment (balanced/unbalanced); vegetable and fruit intake frequency (daily, 2 to 6 times a week, 1 or fewer times a week); smoker (yes/no); and whether the individual consumed alcohol in the last two weeks (yes/no).
Statistical analysis
The probabilistic model of this study scrutinized the dependent variable as absolute where a yes meant the household was food
insecure. Households with children younger than 18 years of age were not counted separately.
An exploratory analysis of the data was conducted to verify the distribution of each covariate of the sample to define the best categories. Next bivariate analysis was conducted, calculating the crude odds ratios to verify association between the outcome and the other variables of interest. All variables with p<0.20 in bivariate analysis were selected for multiple regression analyses. A p-value of 0.20 was chosen to avoid excluding potentially important study variables.
A logistic regression model was built with absolute outcome: food security or food insecurity. Initially, the socioeconomic variables (set 1) with p<0.20 in bivariate analysis were modeled and those with p<0.05 were selected to compose the model with the labor variables (set 2). The variables that resulted from this model (sets 1 + 2) with p<0.05 were selected to compose the model with the health variables (set 3). The variables that were significant (p<0.05) in this last block (sets 1 + 2 + 3) composed the final model.
The association was assessed by the likelihood-ratio test and the adjustment quality of the final logistic regression model was assessed by the goodness-of-fit test (Akaike Information Criterion). All analyses were performed by the software R version 2.1511. The project was approved
by Sub-Reitoria de Pós-Graduação e Pesquisa/ Universidade do Estado do Rio de Janeiro Research Ethics Committee under Protocol n° 062/2010.
R E S U L T S
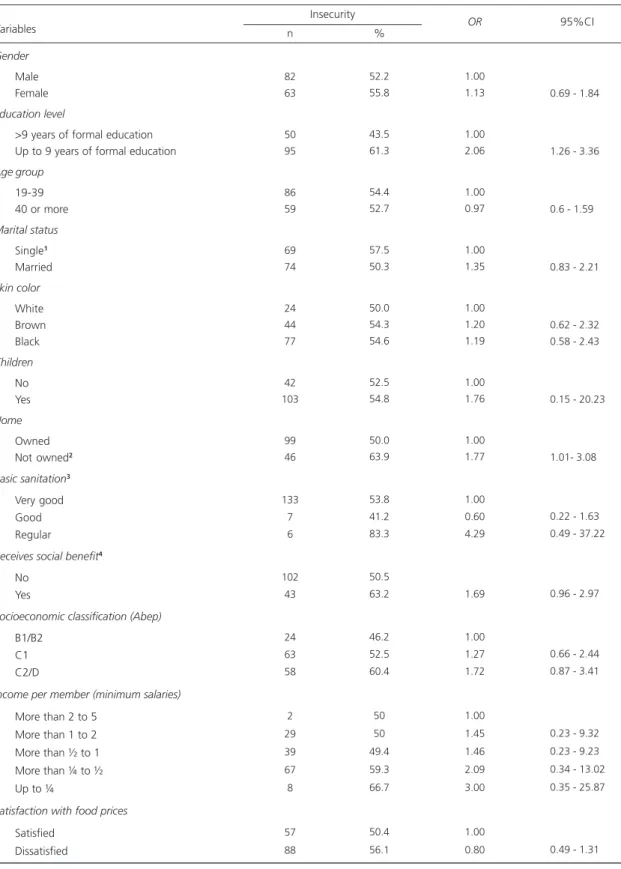
Table 1. Prevalence of food security according to categories of socioeconomic and demographic variables of a sample of popular restaurants workers from Rio de Janeiro.
Gender
Male Female
Education level
>9 years of formal education Up to 9 years of formal education
Age group
19-39 40 or more
Marital status Single1 Married Skin color White Brown Black Children No Yes Home Owned Not owned2
Basic sanitation3 Very good Good Regular
Receives social benefit4 No
Yes
Socioeconomic classification (Abep)
B1/B2 C1 C2/D
Income per member (minimum salaries)
More than 2 to 5 More than 1 to 2 More than ½ to 1 More than ¼ to ½ Up to ¼
Satisfaction with food prices
Satisfied Dissatisfied Variables
Note: 1This category includes widowers and divorcees, among others; 2Rented, borrowed, or another condition; 3Composed of the variables:
sanitary conditions, garbage collection, and piped water; 4Welfare, disability pension, social rent, disease aid, special child.
OR: Odds Ratio; 95%CI: 95% Confiance Interval; Abep: Associação Brasileira de Empresas de Pesquisa.
82 63 50 95 86 59 69 74 24 44 77 42 103 99 46 133 7 6 102 43 24 63 58 2 29 39 67 8 57 88 52.2 55.8 43.5 61.3 54.4 52.7 57.5 50.3 50.0 54.3 54.6 52.5 54.8 50.0 63.9 53.8 41.2 83.3 50.5 63.2 46.2 52.5 60.4 50 50 49.4 59.3 66.7 50.4 56.1 n % Insecurity 1.00 1.13 1.00 2.06 1.00 0.97 1.00 1.35 1.00 1.20 1.19 1.00 1.76 1.00 1.77 1.00 0.60 4.29 1.69 1.00 1.27 1.72 1.00 1.45 1.46 2.09 3.00 1.00 0.80
0.69 - 1.84
1.26 - 3.36
0.6 - 1.59
0.83 - 2.21
0.62 - 2.32 0.58 - 2.43
0.15 - 20.23
1.01- 3.08
0.22 - 1.63 0.49 - 37.22
0.96 - 2.97
0.66 - 2.44 0.87 - 3.41
0.23 - 9.32 0.23 - 9.23 0.34 - 13.02 0.35 - 25.87
0.49 - 1.31
95%CI
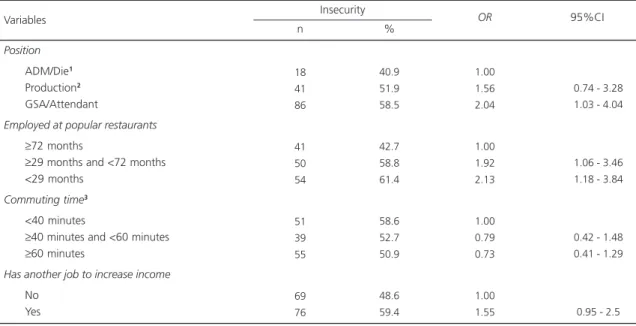
Regarding labor characteristics, 54.4% were general service assistants or attendants and 67.7% spent more than 40 minutes commuting to work with a mean commuting time of 54 minutes. Furthermore, 47.4% had other jobs to increase income.
Most (81.5%) individuals reported having good or very good health; 68.5% reported being satisfied with the composition and regularity of their diet and 52.3% informed having a balanced diet; finally, 47.0% consumed vegetables and fruits daily and 46.7% had consumed alcohol in the last two weeks.
Over half (53.7%) of the Popular Restaurants workers believed their household was food insecure as follows: 40.0% mild, 5.2% moderate, and 8.5% severe. Some statistically significant variables had a prevalence of food insecurity in excess of 60.0%: low education level, not owning a home, receiving social benefit, working in Popular Restaurants for shorter periods (<29 months), and dissatisfaction with diet composition and regularity. Additionally, individuals with low
education level, working as general service assistant or attendant, and working for less time in Popular Restaurants were twice as likely to perceive food insecurity (Tables 1, 2, and 3).
The final model showed that the households of employees with up to nine years of formal education and with less time working in Popular Restaurants were almost three times more likely to be food insecure compared with the reference categories. And employees who were dissatisfied with the composition and regularity of their diet were two times more likely to have food insecure households (Table 4).
D I S C U S S I O N
A high percentage of individuals with low education level, less time working in Popular Restaurants, and dissatisfied with the composition and regularity of their diets perceived their households as food insecure, showing the magnitude of the problem.
Table 2. Prevalence of food security according to the categories of labor variables of a sample of popular restaurants workers from
Rio de Janeiro.
Position
ADM/Die1 Production2 GSA/Attendant
Employed at popular restaurants
≥72 months
≥29 months and <72 months <29 months
Commuting time3 <40 minutes
≥40 minutes and <60 minutes
≥60 minutes
Has another job to increase income
No Yes
18 41 86
41 50 54
51 39 55
69 76
40.9 51.9 58.5
42.7 58.8 61.4
58.6 52.7 50.9
48.6 59.4
n %
Insecurity
1.00 1.56 2.04
1.00 1.92 2.13
1.00 0.79 0.73
1.00 1.55
0.74 - 3.28 1.03 - 4.04
1.06 - 3.46 1.18 - 3.84
0.42 - 1.48 0.41 - 1.29
0.95 - 2.5
95%CI
OR
Variables
Note: 1Stockist, administrative assistant, and dietician; 2Cook assistant, cook (general), butcher, and chef; 3Time spent commuting.
OR: Odds Ratio; 95%CI: 95% of Confidence Interval; ADM/Die: Administrative Assistant/Dietician; GSA/Attendant: General Service Assistant/
Table 3. Prevalence of food security according to categories of health variables of a sample of popular restaurants workers from Rio de Janeiro.
Perceived health
Very good Good Regular/bad
Body Mass Index
Normal1 Overweight2
Satisfaction with diet composition/regularity
Satisfied3 Dissatisfied
Has a balanced diet
Yes No
Fruit and vegetable intake frequency
Daily
2 to 6 times a week 1 or fewer times a week
Smoker
Yes No
Alcohol intake4 No Yes 42 72 31 58 85 91 54 68 77 66 52 27 25 120 72 73 53.8 50.7 62.0 49.6 56.3 48.9 64.3 47.2 61.1 52 53.6 58.7 56.8 53.1 50.3 57.9 n % Insecurity 1.00 0.82 1.28 1.00 0.76 1.00 1.55 1.00 0.57 1.00 1.08 1.27 1.19 1.00 1.00 0.73
0.47 - 1.44 0.62 - 2.66
0.47-1.24
0.95 - 2.5
0.35 - 0.92
0.63 - 1.85 0.64 - 2.52
0.62 - 2.31
0.45 - 1.19
95%CI
OR
Variables
Note: 1Normal:
≥18.5 - ≤24.9 kg/m2; 2Overweight:
≥25 kg/m2; 3Includes very satisfied and satisfied; 4In the last two weeks.
OR: Odds Ratio; 95%CI: 95% of Confidence Interval.
Table 4. Final logistic regression model of food insecurity in families of popular restaurants workers from Rio de Janeiro.
Socioeconomic set
Education level > than 9 years Up to 9 years
Labor set
Employed at popular restaurants
≥72 months
≥29 months and <72 months <29 months
Health set
Satisfaction with diet composition/regularity
Satisfied Dissatisfied
Note: OR: Odds Ratio; 95%CI: 95% of Confidence Interval.
0.0002 0.0140 0.0020 0.0110 Variables 1.00 2.06 1.00 1.92 2.13 1.00 1.55
1.26 - 3.36
1.06 - 3.46 1.18 - 3.84
0.95 - 2.5
OR 95%CI Crude 1.00 2.76 1.00 2.20 2.71 1.00 2.10
1.61 - 4.73
1.17 - 4.15 1.45 - 5.11
1.19 - 3.70
OR 95%CI
Adjusted
In the population of Popular Restaurants workers from Rio de Janeiro, the prevalence of food-insecure households was almost twice of that found by PNAD 2009 (30.2%). Salles-Costa et al.15 studied families from the district Campos Elíseos in Duque de Caxias, considered one of the poorest districts of Rio de Janeiro, and found a prevalence of food insecurity of 53.8%, similar to that found herein. In two municipalities characterized by low human development indices in the states of Pernambuco and Paraíba, household food insecurity prevalences reached almost 90.0%16.
Even in countries like the United States, the USDA1 found a prevalence of food insecurity
of 14.5% in 43,770 families in 2012. Between 2007 and 2008 in Canada, 7.1% of the general population was food insecure; during this same period, the prevalence of food insecurity among Canadian workers was of 4.0%. However, when categorized by sector, the highest prevalence was in the hospitality/food service sector (10.1%)17.
In 2008 in Colombia18, a reality closer to the Brazilian
reality, the prevalence of food insecurity was 40.8%.
Another relevant point in the study sample is overweight as 56.7% of the sample was overweight. However, most still perceive their households to be food insecure. In Pelotas (RS) a study made a similar finding, that is, the so-called nutrition transition19. The coexistence of nutritional
deficits and overweight, micronutrient deficiencies, and chronic non-communicable diseases within the same region or within the same household can still be found in Brazil and other developing countries. Individually, 47.0% of the Popular Restaurants workers reported consuming fruits and vegetables daily. Nonetheless, with the situation of food insecurity at home, the intake of fruits and vegetables dropped to once a week for 58.7% of the sample. When food insecurity prevalence is compared with low fruit and vegetable intake frequency, we presume that this condition together with overweight may be related to the intake of energy-dense, nutrient-poor foods.
In the case of Popular Restaurants workers who make two meals a day at work, having access to varied menus throughout the week, including fruits and non-starchy vegetables, may explain why they have a stronger tendency to perceive their households as food insecure since when they compare their food intake to the food intake of their families, they notice the difference between having or not a qualitatively healthy and quantitatively adequate diet at home. A common finding among food insecurity studies is that the individuals who are most likely to report food insecurity are those belonging to the socioeconomic classes with the lowest access to adequate quality food, a reflex of the social inequalities that persist in today’s world.
The orientation of food insecurity issues, especially in the observance of socioeconomic issues, points toward social inequalities expressed at the national, state, and municipal spheres. Although the study population consists of formally employed individuals, 31.8% reported not having enough money to eat appropriately, and of these, 68.6% reported being food insecure, indicating inadequate income. Almost half (45.3%) of the urban population of cities in Paraiba20 reported
not having enough money to buy food. Santos et al.19 found almost a tenfold prevalence (27.7%)
of food insecurity in families receiving less than two minimum salaries compared with families receiving four or more minimum salaries (2.8%). According to the Instituto Brasileiro de Análises Sociais e Econômicas (Ibase, Brazilian Institute for Social and Economic Analyses)21, the percentage
of the family income spent on food increases as family income decreases. Usually activities that do not require specific skills do not pay well enough for the families to meet their basic needs, so they have a negative impact on wellbeing and quality of life22.
formal education. Both the 2004 and 2009 PNAD2
found that education is an important factor in the determination of food security: as the years of formal education increase, the prevalence of food insecurity decreases.
Salles-Costa et al.15 found that the
education level of the family head was also significantly associated with food insecurity. In the ecological study conducted by Foley et al.23 in
South Australia with 19,037 individuals, a significant association was also found between low education level and food insecurity (p<0.01). A study in Canada also found that workers with low education level were significantly more likely to be food insecure18. Access to education may
be considered one of the factors responsible for high social inequality, and the further an individual is from quality education, the more restricted he will be in exercising his full political rights and citizenship, especially regarding the human right to appropriate food.
Roughly 63.2% of Popular Restaurants workers who perceived being food insecure reported receiving a social benefit (welfare, disability pension, social rent, disease aid, and/or special child). Studies of individuals who receive social benefits also report high prevalences of food insecurity. PNAD24 found that 66% of the
individuals who received social benefits were food insecure. IBASE found that 80% of the families on welfare were food insecure25. Surveys
conducted in Viçosa (MG)26 and Toledo (PR)27
found prevalences of 72.8% and 75.0%, respectively, of food insecurity in individuals on welfare. In the United States, 57.0% of food insecure families benefited from one or more of three food and nutrition assistance programs in the month before the survey28. Families who
benefit from social programs are more vulnerable, have low income, live in unsatisfactory basic sanitation conditions, have low education level, and their skin color, socioeconomic class, and living location are similar to those of the study sample.
Time working in Popular Restaurants was significantly associated with perceived food
insecurity at home: shorter employment time increases the likelihood of food insecurity. Aguiar et al.29 found that Popular Restaurants have
employee turnover rates of 17.3 to 40.3%. This worker may feel insecure with respect to his job, generating uncertainly regarding food acquisition.
Since this was a sectional study, it was not possible to establish causal relationships between food insecurity and the independent variables. Another limitation is the variable used as dependent in the association. Because it is a scale based on an individual’s perception of his household, and because Popular Restaurants workers are aware of what a healthy diet is and have access to varied foods during work, comparison of his food secure situation with that of his family could increase his perception of food insecurity when compared with the general population.
However, since the number of studies on Popular Restaurants workers is scarce, and although they work at a government facility that aims to promote food security, their employment status with the outsourced food service companies is uncertain, just like that of other food service employees. Hence, this study contributes to a better understanding of the socioeconomic, labor, and health situation of soup kitchen workers, and is the first study to analyze their perceived food security status.
C O N C L U S I O N
Although the study population works at a government facility that aims to promote food security, the prevalences of food insecurity are concerning. Moreover, factors such as low education level and shorter employment time at Popular Restaurants increase their chances of perceiving their household as food insecure.
A C K N O W L E D G M E N T S
C O L L A B O R A T O R S
ACML FALCÃO and OB AGUIAR helped to conceive the study; define the method; collect, process, and analyze the data; and write the article. MJM FONSECA helped to define the method; process and analyze the data; and write and review the article.
R E F E R E N C E S
1. Coleman-Jensen A, Nord M, Singh A. Household Food Security in the United States in 2012: A report summary from the Economic Research Service. Washington (DC): United States Departament of Agriculture; 2013 [cited 2013 Sept 16]. Available from: http://www.ers.usda.gov/publications/err-economic-research-report/err155.aspx#.UjdX qtKbNMd
2. Instituto Brasileiro de Geografia e Estatística. Pes-quisa nacional por amostra de domicílios, segurança alimentar: 2004-2009. Rio de Janeiro: IBGE; 2010. 3. Meade B, Valdez C, Rosen S. Brazil’s food security and food assistance programs to reduce poverty: GFA-15. Washington (DC): United States Departament of Agriculture; 2004 [cited 2012 Jun 16]. Available from: http://www.ers.usda.gov/publications/ GFA15/GFA15h.pdf
4. Brasil. Decreto nº 7.272, de 25 de agosto de 2010. Regulamenta a Lei nº 11.346, de 15 de setembro de 2006. Brasília: Ministério da Saúde; 2010 [acesso 2013 jan 15]. Disponível em: http://www4. planalto.gov.br/consea/legislacao/decreto-nb0-7-272-de-25-de-agosto-de-2010
5. Brasil. Ministério do Desenvolvimento Social e Combate à Fome. Restaurantes populares. Brasília: Ministério do Desenvolvimento Social e Combate à Fome [acesso 2013 jan 14]. Disponível em: http:// www.mds.gov.br/falemds/perguntas-frequentes/ seguranca-alimentar-e-nutricional/restaurante-popular/gestor/restaurantes-populares
6. Rio de Janeiro. Secretaria de Estado Assistência Social e Direitos Humanos. Restaurante Cidadão. Rio de Janeiro: SEASDH [acesso 2013 maio 28]. Disponível em: http://www.rj.gov.br/web/seasdh/ exibeconteudo?article-id=922982
7. Associação Brasileira das Empresas de Refeição Coletiva. Mercado Real. São Paulo: Aberc [acesso 2013 jun 28]. Disponível em: http://www.aberc. com.br/mercadoreal.asp?IDMenu=21
8. Cavally S, Salay E. Gestão de pessoas em unidades produtoras de refeições comerciais e a segurança alimentar. Rev Nutr. 2007; 20(6):657-67. http:// dx.doi.org/10.1590/S1415-52732007000600008
9. Aguiar OB, Valente JG, Fonseca MJM. Descrição sócio-demográfica, laboral e de saúde dos tra-balhadores do setor de serviços de alimentação dos restaurantes populares do estado do Rio de Janeiro. Rev Nutr. 2010; 23(6):969-82. http://dx.doi.org/ 10.1590/S1415-52732010000600004
10. Departamento Intersindical de Estatística e Estudos Sócioeconômicos. Rotatividade e flexibilidade no mercado de trabalho. São Paulo: DIEESE; 2011 [acesso 2014 mar 5]. Disponível em:http://www. dieese.org.br/livroRotatividade11.pdf
11. R Development Core Team. R: A language and environment for statistical computing. Vienna: R Foundation for Statistical Computing [cited 2012 Jun 16]. Available from: http://www.R-project.org/ 12. Segall-Corrêa AM, Marin-León L, Melgar-Quiñonez
H, Escamilla RP. Refinement of the Brazilian
Household Food Insecurity Measurement Scale: Recommdation for a 14-item EBIA. Rev Nutr. 2014; 27(2):241-51. http://dx.doi.org/10.1590/1415-52 732014000200010
13. Brasil. Ministério do Desenvolvimento Social e Com-bate à Fome. Escala Brasileira de Insegurança Alimentar: análise psicométrica de uma dimensão da segurança alimentar e nutricional. Estudo Técni-co nº 1/2014/SAGI/MDS. Brasília: Ministério do De-senvolvimento Social e Combate à Fome; 2014 [acesso 2014 set 25]. Disponível em: http:// aplicacoes.mds.gov.br/sagirmps/simulacao/ estudos_tecnicos/pdf/73.pdf
14. Associação Brasileira de Empresas de Pesquisa. Critério de classificação econômica Brasil. São Paulo: Abep; 2009 [acesso 2012 maio 16]. Disponí-vel em: http://www.abep.org/novo/Content.aspx? ContentID=302
15. Salles-Costa R, Pereira RA, Vasconcellos MTL, Veiga GV, Marins VMR, Jardim BC, et al. Associação entre fatores socioeconômicos e insegurança alimentar: estudo de base populacional na região metropo-litana do Rio de Janeiro, Brasil. Rev Nutr. 2008; 21(Supl.):99s-109s.
16. Oliveira JS, Lira PIC, Veras ICL, Maia SR, Lemos MCC, Andrade SLL, et al. Estado nutricional e insegurança alimentar de adolescentes e adultos em duas loca-lidades de baixo índice de desenvolvimento huma-no. Rev Nutr. 2009; 22(4):453-65. http://dx.doi.org/ 10.1590/S1415-52732009000400002
17. Mclntyre L, Bartoo AC, Emery JCH. When working is not enough: Food insecurity in the Canadian labour force. Rev Public Health Nutr. 2012; 17(1):49-57. http://dx.doi.org/10.1017/S13689800 12004053
19. Santos JV, Gigante DP, Domingues MR. Prevalência de insegurança alimentar em Pelotas, Rio Grande do Sul, Brasil, e estado nutricional de indivíduos que vivem nesta condição. Cad Saúde Pública. 2010; 26(1):41-9. http://dx.doi.org/10.1590/S010 2-311X2010000100005
20. Vianna RPT, Segall-Corrêa AM. Insegurança alimentar das famílias residentes em municípios do interior do estado da Paraíba, Brasil.Rev Nutr. 2008; 21(Supl.):111s-22s.
21. Repercussões do Programa Bolsa Família na Segu-rança Alimentar e Nutricional das famílias bene-ficiadas. Documento Síntese. 2008. Rio de Janeiro: Ibase; 2008 [acesso 2013 dez 10]. Disponível em: http://www.ibase.br/userimages/ibase_bf_ sintese_site.pdf
22. Ricarte TL, Melo MRB, Targino I. Pobreza e trabalho no setor de serviços no nordeste brasileiro. Rev Econ Desenv. 2013; 12(1):161-79.
23. Foley W, Ward P, Carter P, Coveney J, Tsourtos G, Taylor A. An ecological analysis of factors associated with food insecurity in South Australia, 2002-7. Public Health Nutr. 2009; 13(2):215-21. http://dx. doi.org/10.1017/S1368980009990747
24. Instituto Brasileiro de Geografia e Estatística. Pesquisa nacional por amostra de domicílios: segu-rança alimentar 2004. Rio de Janeiro: IBGE; 2006. 25. Segall-Corrêa AM, Salles-Costa R. Novas possibi-lidades de alimentação a caminho? Democracia
Vi-va n° 39. Brasília: Ibase; 2008 [acesso 2013 dez 11]. Disponível em: http://ibase.br/userimages/ DV_39_indicadores2.pdf
26. Souza NN, Dias MM, Sperandio N, Franceschini SCC, Priore SE. Perfil socioeconômico e segurança alimentar e nutricional de famílias beneficiárias do Programa Bolsa Família no município de Viçosa, estado de Minas Gerais, Brasil, em 2011: um estudo epidemiológico transversal. Rev Epid Serv Saúde. 2012; 21(4):655-62. http://dx.doi.org/10.5123/S16 79-49742012000400015
27. Anschau F, Matsuo T, Segall-Corrêa AM. Inseguran-ça alimentar entre beneficiários de programas de transferência de renda. Rev Nutr. 2012; 25(2):177-89. http://dx.doi.org/10.1590/S1415-5273201200020 0001
28. Coleman-Jensen A, Nord M, Andrews M, Carlson S. Household Food Security in the United States in 2011: Statistical supplement. Administrative Publication. Washington (DC): USDA; 2012 [cited 2013 Jun 5]. Available from: http://www.ers. usda. gov/media/884603/apn-058.pdf
29. Aguiar OB, Kraemer FB, Silva TM, Guedes TWG. Rotatividade em empresas de alimentação coletiva no município do Rio de Janeiro. Rev Nutr Pauta. 2013; 21(123):21-8.