ISSN 1517-7076 artigo 11675, pp.1-10, 2016
Tensile properties and color and mass
variations of GFPR composites under
alkaline and ultraviolet exposures
Guilherme Chagas Cordeiro 1, Janine Domingos Vieira 2, Carolina Mattedi Có 1
1 Laboratory of Civil Engineering, Universidade Estadual do Norte Fluminense Darcy Ribeiro, Av. Alberto Lamego 2000,
28013-602, Parque Califórnia, Campos dos Goytacazes/RJ, Brasil. e-mail: [email protected]; [email protected]
2 Department of Civil Engineering, Universidade Federal Fluminense, Rua Passo da Pátria, 156, CEP 24210-240,
Nite-rói/RJ, Brasil.
e-mail: [email protected]
ABSTRACT
The objective of the present study was to evaluate the influence of two different environmental conditions on the quantitative change of color and mass, tensile strength and modulus of elasticity of glass fiber reinforced polymers (GFRP) produced in Brazil. For this purpose, specimens were taken from pultruded composite pro-files with two different matrices (vinylester and phenolic resins) reinforced with glass fibers. The first condi-tion consisted of exposing them to cycles of ultraviolet radiacondi-tion followed by water spray. In the second envi-ronment, the specimens were continuously exposed to alkaline solution at a constant temperature of 40 °C. After the exposure, both vinylester and phenolic composites were characterized according to the following parameters: variation of mass, tensile strength and modulus of elasticity. The CIE 1976 L*a*b* color system was used to determinate the color variation of the specimens after degradation using a spectrophotometer. Results indicated significant reductions in tensile strength values for both composites, in addition to expres-sive variations of mass and color. However, the color variation was not directly related with the loss of me-chanical strength.
Keywords: Fiber reinforced polymer, Composite, Environmental degradation, Mechanical properties, Color.
1. INTRODUCTION
Pultruded glass fiber reinforced polymer (GFRP) has increasingly been used in Civil Engineering since the 1980’s. It is well established that GFRP profiles are used as structural elements mainly due to their low spe-cific gravity, low electrical conductivity and high resistance to corrosion. Moreover, GFRP structures can be easily fabricated using adhesives and/or bolted joints where inspection and maintenance procedures are un-complicated [1]. Production of pultruded GFRP of varied shapes and high mechanical strength enables its use in different structures such as bridges, walkways, and stairs. Presently, GFRP structural profiles are common-ly used in oil and gas plants where the material is exposed to the corrosive platform and refinery environ-ments. In spite of its numerous advantages, several studies have shown that the durability of GFRP can be seriously affected by long-term ultraviolet (UV) radiation and water exposures due to the plasticization and swelling of polymeric matrices and leaching in glass fibers [2, 5]. These adverse effects can be accelerated in the presence of alkali ions [6] and high temperature [3]. A way to overcome this problem is to understand how GFRP behaves under severe environmental conditions, as has been reported by several studies [3,6-9] In general, GFRP degradation has been initially observed by the change of the resin color. Neverthe-less, the discoloration is often subjective and cannot be associated with loss of strength, stiffness or some other im-portant mechanical property of the composites. Although GFRP photodegradation has been exten-sively studied [4,7, 9-12], there is little information on the quantitative color variation and its influence on the mechanical behavior of GFRP composites. In this study, the influence of the accelerated degradation of two types of GFRP composites produced in Brazil on the quantitative change of color was investigated. Moreover, measurements of change of mass, tensile strength and modulus of elasticity were also carried out in two types
Autor Responsável: Guilherme Chagas Cordeiro Data de envio: 05/08/2013 Data de aceite: 10/09/2015
of GFRP composite specimens (vinylester and phenolic resins reinforced with E-glass fiber) exposed to two environments: (i) ultraviolet radiation followed by water spray; and (ii) alkaline solution at a constant tem-perature of 40 °C. GFRP degradation was investigated by detailed measurements of the direct longitudinal tensile test, water absorption, spectrophotometry, and scanning electronic microscopy.
2. MATERIALS AND METHODS
2.1 Materials
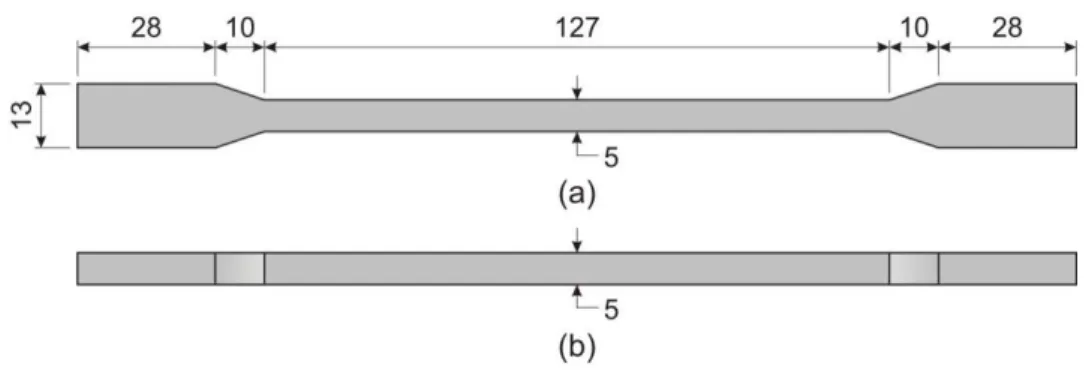
The GFRP pultruded profiles used in this study were fabricated using a standard pultrusion process in a com-posite company in São Paulo, Brazil. In the pultrusion process, fibers were impregnated with a low viscous liquid polymer in a resin bath and then the pre-impregnated composites were pulled and cured through a heated die [13]. The profiles were made with matrices of vinylester and phenolic resins reinforced with E-glass fiber (fiber content of 50 and 60 wt.%, respectively) in the longitudinal direction. The E-E-glass fiber had a diameter of 20 μm, density of 2570 kg.m-3, tensile strength of 1.2 GPa, and modulus of elasticity of 70 GPa. The vinylester resin was made with 1.7 wt.% of methyl ethyl ketone peroxide, 0.5 wt.% cobalt chloride as catalyst and accelerator, respectively. The phenolic resin was cured in an oven at 210 °C for 15 min. Speci-mens for the different tests were accurately extracted from the pultruded profiles using a Discovery 560 Romi vertical machining center. Figure 1 shows the dimensions of the specimens that were based on the studies performed by Vieira [14].
Figure 1: Dimension of the specimens used in the tensile properties tests (values in mm). Top (a) and lateral (b) views.
2.2 Exposure conditions
The GFRP specimens were exposed to both UV/spray condition and an alkaline immersion condition. These tests were separate and independent of each other. Prior to the UV/spray and alkaline exposures, the speci-mens were oven-dried at 60 °C to a constant mass. For the UV/spray conditions, the exposure of 280-330 nm UV radiation was made artificially in a weathering machine (ADEXIM-COMEXIM). The aging conditions required for one complete cycle were as follows: 60 min. exposure to light; 60 min. without light plus water spray; 10 min. under ventilation. The water temperature was maintained at 40 °C. The tests of tensile strength, mass variation, and color change were carried out after 160, 320 and 480 complete cycles.
The alkaline exposure was represented by continuously maintaining specimens of both GFRP compo-sites in high-density polyethylene boxes containing a 40 °C alkaline solution. This solution was formed by using mass concentrations of 1.0% NaOH, 1.4% KOH, and 0.16% Ca(OH)2 in 1 L deionized water to provide a high pH level (pH 13). This exposure condition was previously used by KIM et al. [6]. During the exposure, the volume of alkaline solution was equal to three times the volume of the samples and the solution was peri-odically stirred. Specimens of both composites were taken out after 90 and 120 days from immersion to measure the different properties.
2.3 Test methods
The mass variation of the samples over time was defined by Equation 1 [6]. The same specimens used to evaluate the tensile strength during 480 UV/water spray cycles and 120 days of alkaline immersion were used in the mass variation tests. Before the mechanical test, the specimens were dried in an oven at 60 °C for 24 h.
Mv = 100∙(Mt – Mi)∙Mi–1 (1)
Where: Mv is the variation of mass (in percent); Mt is the mass of the specimen at time t; and Mi is the initial
mass of the specimen (t = 0).
The direct tensile tests were performed in an Emic universal testing machine at a crosshead speed of 0.5 mm/min and load cell of 50 kN. The strain values were obtained by an electric clip-gage with a gage length of 50 mm. The modulus of elasticity was calculated considering the slope of the linear portion of the stress-strain curve. Results were expressed as an average of 5 specimens ± standard deviation. The results were validated by statistical testing using Analysis of Variance (ANOVA) and Duncan’s Multiple Range Tests with probability ≤ 0.05 [17].
The color measurements were performed using a GretagMacbeth ColorEye XTH spectrophotometer with the CIE D65 standard illuminant. The CIE 1976 L*a*b* color system was used for quantitative deter-mination of color variation [15]. In this system, the total color difference (ΔE*) is calculated in accordance with Equation 2. A ΔE* equal to 3.3 is the critical value of human visual perception [16]. Eight color meas-urements were made on four 30 mm wide by 50 mm long specimens. Then, the average values were calculat-ed for both GFRP composites. Measurements were made after 160, 320 and 480 UV/water spray cycles and 60, 90 and 120 days of alkaline immersion. The results of the color variation tests were also validated by ANOVA and Duncan’s Multiple Range Tests (p ≤ 0.05).
ΔE* = [(ΔL*)2 + (Δa*)2 + (Δb*)2]0.5 (2)
Where: ΔE* is the total color difference, ΔL* is the variation of brightness and Δa* and Δb* are chro-matic variations - red-green (value scale a*) and yellow-blue (value scale b*).
Scanning electronic microscopy (SEM) analyses were performed to clarify the degradation for both types of composites after severe exposures. Microscope Jeol JXA840-A images were taken from the compo-site sur-face and fractured section of the specimens. The samples were gold-coated under vacuum and the secondary electron images were taken on 15 kV.
All tested specimens from both the UV/water spray and the alkaline exposures were compared with GFRP reference specimens (vinylester and phenolic) tested under room-conditions (unexposed specimens).
3. RESULTS AND DISCUSSION
3.1 Mass variation
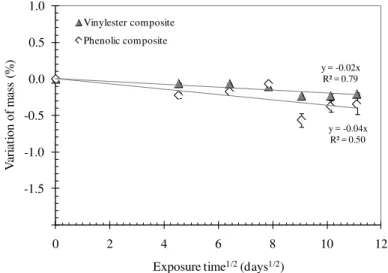
The mass variation of the vinylester and phenolic composites during cycles of UV/water spray is presented in Figure 2. There was no expressive mass variation irrespective of the composite type. As can be seen, 0.2 and 0.3% loss of mass values were observed to vinylester and phenolic composites, respectively, after 480 UV/water spray cycles, indicating only a surface phenomenon. This behavior was confirmed by SEM analy-sis as discussed in section 3.4. In this case, the loss of mass is likely to be due to the volatiles and residual moisture in the specimens.
Figure 2: Mass variation over time (square root) of the vinylester and phenolic composites exposed to the UV/water
spray cycles.
y = -0.02x R² = 0.79
y = -0.04x R² = 0.50
-2.0 -1.5 -1.0 -0.5 0.0 0.5 1.0
0 2 4 6 8 10 12
V
ar
ia
tio
n
of
ma
ss
(
%
)
Exposure time1/2(days1/2)
Vinylester composite Phenolic composite
The mass variation was more pronounced in the alkaline exposure than those in UV/spray cycles, mainly for the phenolic composites. Figure 3 shows that the vinylester specimens presented a 0.7% gain of mass after 71 days of continuous alkaline immersion. The gain of mass for the phenolic composite was about 15% in the same immersion period. In both composite types, the gain of mass over the square root of time increased with a constant rate (linear curves with R2 higher than 90%). This behavior roughly follows a Fick-ian diffusion behavior, as it was observed by KIM et al. [6]. Severity of alkaline exposure on the loss of mass for polyester GFRP was also reported by CORREIA et al. [4]. Results of gain in mass for vinylester GFRP were also previously observed [4,6]. However, the gain of mass determined in this study for phenolic compo-sites was much higher than verified by other works. This behavior can be explained to a progressive visible delamination observed in all phenolic GFRP specimens during the alkaline immersion period. In this case, the longitudinal delamination of the phenolic composite can be attributed to a progressive swelling (Figure 4).
Figure 3: Mass variation over time (square root) of the vinylester and phenolic composites exposed to the alkaline
solu-tion.
Figure 4: Lateral view of a phenolic composite specimen after 71 days of alkaline exposition.
3.2 Mechanical properties
Figure 5 shows the stress versus strain curves for unexposed (reference) and all ultimate exposed composites, where expressive differences in strength and modulus of elasticity were observed due to the studied degrada-tion environments. Both UV/water spray and alkaline exposures reduced the tensile strength of the sites. Based on the obtained values of tensile strength (Table 1), it can be observed that both types of compo-sites presented different strength in relation to the references after 480 UV/water spray cycles. In this case, a reduction in strength of about 10% was observed for both types of composites. A similar reduction was ob-served in GFRP with isophtalic matrix after about 80 days of UV exposure [4].
y = 0.07x R² = 0.90 y = 1.95x R² = 0.98
-3 0 3 6 9 12 15 18
0 2 4 6 8 10
V
ar
ia
tio
n
of
ma
ss
(
%
)
Immersion time1/2(days1/2)
Vinylester composite
Phenolic composite
Figure 5: Typical stress versus strain curves of the vinylester and phenolic GFRP specimens.
Table 1: Mechanical properties of the reference and exposed UV/water spray (UV) and alkaline (AS) composites
(stand-ard deviation is indicated within bracket).
Composite Tensile strength (MPa) Modulus of elasticity (GPa)
Reference-Vinylester 394.4 (± 15.7) 30.0 (± 1.5)
Reference-Phenolic 201.7 (± 9.5) 27.3 (± 1.4)
Vinylester-UV160 355.6 (± 27.3) 29.9 (± 3.4)
Vinylester-UV320 340.9 (± 31.6) 30.4 (± 4.9)
Vinylester-UV480 356.1 (± 23.1) 32.2 (± 1.7)
Phenolic-UV160 171.0 (± 10.9) 28.6 (± 2.2)
Phenolic-UV320 189.0 (± 13.4) 30.7 (± 3.2)
Phenolic-UV480 185.6 (± 24.4) 28.1 (± 1.3)
Vinylester-AS90 316.9 (± 22.2) 29.7 (± 2.5)
Vinylester-AS120 241.3 (± 25.4) 30.3 (± 1.7)
Phenolic-AS90 34.6 (± 4.0) 19.2 (± 2.0)
Phenolic-AS120 23.7 (± 5.3) 19.2 (± 1.7)
Comparing the tensile strengths of the UV/water spray vinylester composites with different exposure times, no significant differences were observed between them. The same trend was observed for the tensile strength results of phenolic-UV composites based on statistical analysis. This was probably due to post cur-ing of unreacted resin matrix durcur-ing the agcur-ing tests. SOOKAY et al. [18] observed this behavior in a study with epoxy-based composites. For both types of composites, UV/water spray exposure did not cause a signif-icant difference in modulus of elasticity (Table 1). It is important to note that in this work we opted to con-duct longitudinal tensile tests, in respect to the fiber direction, to simulate real structural applications. In this case, the strength is dominated by the fiber properties, which it seems, did not significantly change after UV/water spray cycles.
The differences in the stress-strain curves of the reference and the alkaline specimens (Figure 5) clear-ly showed the aggressive action of the alkaline environment on the tensile properties. In fact, the reduction in tensile strength of both composites was more pronounced in the alkaline solution immersion than those in the UV/water spray exposure. After 120 days of immersion, significant reductions of about 40 and 90% in strengths were observed for the vinylester and phenolic composites, respectively, in relation to the references. Reductions of about 20 and 80% were observed for the vinylester and phenolic composites, respectively, after 90 days. In spite of the alkaline-vinylester composites presenting similar modulus of elasticity values in relation to the reference, the final slope of the curves decreased while strain increased. For phenolic compo-sites, no significant differences were observed between the modulus of elasticity values after 90 and 120 days
0 100 200 300 400
0 3500 7000 10500 14000
Te
nsi
le
st
re
ss
(MP
a)
Specific strain (x 10-6)
Reference-Vinylester
Reference-Phenolic
Vinylester-UV480
Vinylester-AS120
Phenolic-UV480
Phenolic-AS120
of immersion. However, both alkaline-exposed composites presented significant lower modulus of elasticity values (70%) than the phenolic reference. The loss of tensile strength in the phenolic composites exposed to the alkaline solution was linked with the high mass variation (Figure 3), fiber degradation, and delamination (Figure 4).
3.3 Color variation
The total color difference (ΔE*) values for all exposed composites increased with the exposure time, as can be seen in Figure 6. Based on statistical analysis (ANOVA), the ΔE* was significantly influenced by the number of cycles and immersion time for UV/water spray and alkaline exposure, respectively. A good linear correlation between the ΔE* and the square root of time was found for all curves (R2 > 0.97). The vinylester composites had the ΔE* values between 3.8 (after 160 cycles) and 6.8 (after 480 cycles) And the ΔE* values of the phenolic composites ranged between 6.8 and 9.5 after 160 and 480 UV/water spray cycles, respective-ly. Considering the measurements performed immediately after 60 days of alkaline immersion for both com-posite types, the ΔE* values were 8.6 and 4.2 for vinylester and phenolic composites, respectively.
Figure 6: Total color difference (ΔE*) values of vinylester and phenolic GFRP specimens exposed to the UV/water spray
cycles (UV) and alkaline solution (AS).
It is important to note that the visual observations of the discoloration of the specimens were very in-formative. In fact, the specimens of both phenolic and vinylester composites presented detectable color changes after all observed times indicated in Figure 6. This occurred because the ΔE* values were higher than the difference values (ΔE* = 3.3) recognizable by all people [19], i.e., the color changes after the expo-sure was easily distinguished by the human eye. The photodegradation of the vinylester composite was mani-fested by yellowing of the composite (increase of b* value in the CIE 1976 L*a*b* color system), while the UV/water spray exposure darkened the color of the phenolic specimens (decrease of L* and increase in a* and b* parameters). The results showed that the continuous exposure in the alkaline solution also darkened the color of the phenolic specimens. On the contrary, the vinylester composites exposed to the alkaline solu-tion lightened, with increases in L* value.
It is important to note that the color variation was not directly related with the reduction in mechanical strength, mainly for the vinylester composite. However, esthetical aspects are important in several projects and should be considered by designers, mainly when GFRPs are used in outdoor applications.
3.4 SEM observations
SEM micrographs of the surface morphologies of different specimens before and after both UV/water spray and alkaline exposures are shown in Figure 7. Both vinylester and phenolic unexposed composites were ini-tially smooths (Figures 7a and 7b, respectively). The surface of vinylester and phenolic composites was ex-pressively degraded after 480 cycles of the UV/water spray, as indicated in Figures 7c and 7d, respectively. In fact, microcracks appeared on each composite indicating, as expected, that the photodegradation of poly-meric composites caused apparent surface microcracking. A similar microcracking phenomenon under UV
0 2 4 6 8 10 12 14
0 5 10 15 20
To tal co lo r d if fer en ce ( Δ E *)
Exposure time1/2(days1/2)
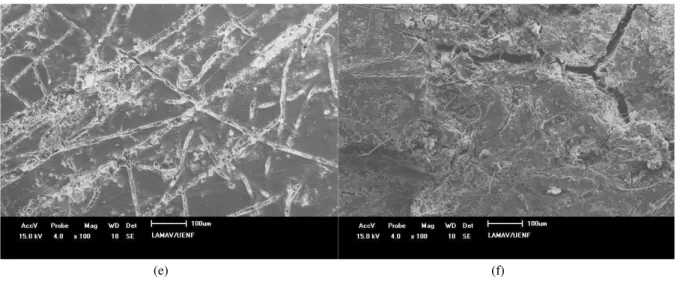
exposure has been previously reported by others authors [10-12,10]. After 120 days in alkaline immersion, both vinylester and phenolic composites presented evidence of resin erosion, which induced the appearance of microcracks (Figures 7e and 7f, respectively). This behavior was more pronounced on the phenolic com-posites, where delaminations along the side of the specimens (longitudinal) were visually observed. This was consistent with the results of mass variation shown in Figure 3.
The clean surface of a fiber from the vinylester composite exposed to the alkaline solution, shown in Figure 8a, confirmed that the microcracking indicated in Figure 7e was a surface phenomenon. This corrobo-rated with the mechanical behavior of the vinylester composite (Figure 5 and Table 1). It was confirmed that the vinylester resin could inhibit the penetration of alkalis into GFRP composites immersed in alkali solu-tions [21]. On the other hand, the continuous exposure to the alkaline solution affected the fiber surface of the phenolic composite. In this case, with the delamination, there was a direct contact between the glass fibers and the alkaline solution. Thus, clusters of hydrated compounds were observed around the fibers, as shown in Figure 8b. This helped to understand the expressive reduction in tensile strength observed with the alkaline-exposed phenolic composite in comparison with the reference composite. Moreover, it seems evident that the damage mechanisms of phenolic composite exposed to the alkaline solution were mainly interfacial (fiber-matrix bond) and fiber related mechanisms.
(a) (b)
(c) (d)
(e) (f)
Figure 7: SEM micrographs of composites: (a) unexposed vinylester composite; (b) unexposed phenolic composite; (c)
vinylester composite exposed to 480 UV/water spray cycles; (d) phenolic composite exposed to 480 UV/water spray cycles; (e) vinylester composite exposed to 120 days in alkaline solution; (f) phenolic composite exposed to 120 days in alkaline solution.
(a) (b)
Figure 8: SEM micrographs of glass fiber of the (a) vinylester and (b) phenolic composites exposed to 120 days in
alka-line solution.
4. CONCLUSIONS
Based on experimental results, the following conclusions can be drawn:
There was no expressive mass variation for both composites due to the UV/water spray exposure. During the alkaline exposure, the mass variation was very pronounced, mainly for the phenolic composite. This composite presented a visible delamination;
No significant tensile strength variations were observed for both composites exposed to the UV/water spray up to 480 days. On the contrary, the alkaline long-term exposures significantly reduced the tensile strength for both composites. In this case, the reduction was more expressive for phenolic composites;
It was clear that both degradation exposure conditions caused perceptible discoloration as a function of time for the vinylester and phenolic composites. The values of the total color difference observed on the exposed composites were higher than the minimum recognizable value by all people in a col-or test. However, the colcol-or variation was not directly related to the mechanical strength loss; Evidence of environmental degradation was obtained by surface microcraking on both composites.
5. ACKNOWLEDGEMENTS
The authors would like to acknowledge the financial support by FAPERJ (Brazilian Agency). The authors are also indebted with the Laboratory of Technology of the Department of Forest Engineering (UnB, Brazil), where the color measurements were performed, and the Laboratory of Mechanical Properties of the Depart-ment of Metallurgical and Materials Engineering (COPPE/UFRJ, Brazil), where the tensile tests were made.
6. BIBLIOGRAPHY
[1] BANK, L.C., Composite for construction: structural design with FRP materials, 1 ed., New Jersey, John Wiley & Sons, 2006.
[2] PRIAN, L., BARKATT, A., “Degradation mechanism of fiber-reinforced plastics and its implications to prediction of long-term behavior”, Journal of Materials Science, v. 34, n. 16, pp. 3877-3889, August 1999. [3] LIAO, K., SCHULTHEISZ, C.R., HUNSTON, D.L., “Effects of environmental aging on the properties of pultruded GFRP”, Composites: Part B, v. 30, n. 5, pp. 485-493, July 1999.
[4] CORREIA, J.R., CABRAL-FONSECA, S., BRANCO, F.A., FERREIRA, J.G., EUSÉBIO, M.I., RO-DRIGUES, M.P., “Durability of pultruded glass-fiber-reinforced polyester profiles for structural applica-tions”, Mechanics of Composite Materials, v. 42, n. 4, pp. 325-338, July 2006.
[5] TURVEY, G.J., WANG, P., “Failure of pultruded GRP single-bolt tension joints under hot–wet condi-tions”, Composite Structures, v. 77, n. 4, pp. 514-520, October 2007.
[6] KIM, H.Y., PARK, Y.H., YOU, Y.J., MOON, C.K., “Durability of GFRP composite exposed to various environmental conditions”, KSCE Journal of Civil Engineering, v. 10, n. 4, pp. 291-295, July 2006.
[7] MICELLI, F., NANNI, A., “Durability of FRP rods for concrete structures”, Construction and Buildings Materials, v. 18, n. 7, pp. 491-503, September 2004.
[8] BANK, L.C., GENTRY, T.R., BARKATT, A., “Accelerated test methods to determine the long-term behavior of FRP composite structures: environmental effects”, Journal of Reinforced Plastics and Compo-sites, v. 14, n. 6, pp. 559-587, January 1995.
[9] CHIN, J.W., NGUYEN, T., AOUADI, K., “Effects of environmental exposure on fiber-reinforced plastic (FRP) materials used in construction”, Journal of Composite Technology & Research, v. 19, n. 4, pp. 205-213, October 1997.
[10] RABEK, J.F., Polymer photodegradation: mechanisms and experimental methods, 1 ed., London, Chapman & Hall, 1995.
[11] KUMAR, B.G., SINGH, R.P., NAKAMURA, T., “Degradation of carbon fiber-reinforced epoxy com-posites by ultraviolet radiation and condensation”, Journal of Composite Materials, v. 36, n. 24, pp. 2713-2721, December 2002.
[12] WOO, R.S.C., CHEN, Y., ZHU, H., et al., “Environmental degradation of epoxy–organoclay nanocom-posites due to UV exposure. Part I: Photo-degradation”, Comnanocom-posites Science and Technology, v. 67, n. 15-16, pp. 3448-3456, Mar. 2007.
[13] CARLSSON, A., ASTROM, B. T., “Modeling of heat transfer and crystallization kinetics in thermo-plastic composites manufacturing: pultrusion”, Polymer Composites, v. 19, n. 4, pp. 352-359, August, 1998. [14] VIEIRA, J. D., Study of the structural behavior of the pultruded profiles under high temperature effect, Thesis of D.Sc., COPPE/UFRJ, Rio de Janeiro, RJ, Brazil, 2008.
[15] WYSZECKI, G., STILES, W.S., Color science: concepts and methods quantitative data and formulae, 2 ed., New York, John Wiley & Sons, 1982.
[16] SCHULZE, K.A., MARSHALL, S.J., GANSKY, S.A., et al., “Color stability and hardness in dental composites after accelerated aging”, Dental Materials, v. 19, n. 7, pp. 612-617, November 2003.
[17] MONTGOMERY, D.C., Design and analysis of experiments, 5 ed., New York, John Wiley & Sons, 2006.
[18] SOOKAY, N.K., VON KLEMPERER, C.J., VERIJENKO, V.E., “Environmental testing of advanced epoxy composites”, Composite Structures, v. 62, n. 3-4, pp. 429-433, February 2003.
[19] HOSOYA, Y., “Five-year color changes of light-cured resin composites: influence of light-curing times”, Dental Materials, v. 15, n. 4, pp. 268-274, July 1999.
[20] STARK, N.M., MATUANA, L.M., “Surface chemistry and mechanical property changes of wood-flour/high-density-polyethylene composites after accelerated weathering”, Journal of Applied Polymer Sci-ence, v. 94, n. 6, pp. 2263-2273, October 2004.
[21] KAMAL, A.S.M., BOULFIZA, M., “Durability of GFRP rebars in simulated concrete solutions under accelerated aging conditions”, Journal of Composites for Construction, v. 15, n. 4, pp. 473-481, August 2011.