*e-mail: [email protected]
Recebido: 27/04/2012 / Aceito: 28/07/2012
Investigating the center of pressure velocity Romberg’s quotient
for assessing the visual role on the body sway
Paulo José Guimarães da Silva, Jurandir Nadal, Antonio Fernando Catelli Infantosi*
Abstract The classical Romberg’s test based on stabilometric tests in eyes open (EO) and closed (EC) conditions was used for investigating the inluence of visual feedback in the body sway control in healthy adult subjects. Stabilograms from 144 subjects (aged 18-40) resting over a force platform were recorded for 30 s in EO and 30 s in EC conditions. The mean velocity was obtained for EO (VmEO) and EC (VmEC) in both anterior-posterior (y) and medial-lateral (x) directions and in the (x,y) plane, and thus used for computing the respective Romberg’s quotient (RQV). All Vm and RQV parameter histograms presented unimodal asymmetric shapes, which were adequately itted to lognormal distributions (Kolmogorov-Smirnov test, p > 0.05). These indings suggest a single homogeneous group in terms of visual strategy. Taking the threshold scores (95% conidence interval) of the Vm and RQVdistributions, only four subjects (2.7%) presented values below the lower limit, as expected by the conidence level (two tailed, 5%). A strong dependence was also found between each RQV and the respective VmEC (Spear correlation ≥ 0.86, R2 ≥ 74.0%), with Vm
EO presenting almost negligible coeficients of determination (R2 ≤ 2.9%). One can conclude that RQ
V derived from a single stabilometric trial could be not suficient for the diagnosis of body sway control impairment by vision. Nevertheless, the RQV could be useful to indicate subjects to carry out additional tests to investigate a possible deicit in the integration of the visual information in the postural control system.
Keywords Body sway control, Center of pressure velocity, Lognormal distribution, Romberg’s test, Visual system.
Avaliando a importância da visão nas oscilações posturais utilizando o
quociente de Romberg da velocidade do centro de pressão
Resumo O Teste de Romberg clássico, baseado em testes estabilométricos nas condições de olhos abertos (EO)
e fechados (EC), tem sido utilizado para investigar a inluência da realimentação visual no controle das oscilações posturais em sujeitos adultos saudáveis. Estabilogramas de 144 sujeitos (18 a 40 anos) em posição ortostática sobre uma plataforma de força foram coletados durante 30 s na condição EO e 30 s em EC. As
velocidades médias para EO (VmEO) e EC (VmEC), obtidas nas direções anteroposterior (y), mediolateral (x) e no plano (x,y), foram utilizadas no cálculo dos respectivos quocientes de Romberg (RQV). Os histogramas dos parâmetros Vm e RQV apresentaram morfologia unimodal assimétrica, aos quais foram ajustadas distribuições lognormais (Teste de Kolmogorov-Smirnov, p > 0,05). Tais distribuições sugerem haver um
único grupo homogêneo no que concerne à estratégia visual. Considerando o intervalo de coniança de 95%, somente quatro sujeitos (2,7%) apresentaram valores de Vm e QRV abaixo do limite inferior, percentual este compatível com o teste bicaudal. A Correlação de Spear entre o RQV e seu respectivo VmEC foi sempre superior a 0,86, sendo o coeiciente de determinação R2 ≥ 74,0%, enquanto que com VmEO R2 ≤ 2,9%. Tais achados sugerem que o RQV obtido a partir de um único teste estabilométrico não seria adequado ao diagnóstico de problemas de controle das oscilações posturais ocasionados pela visão. No entanto, o RQV pode ser útil para indicar a realização de testes adicionais com vistas a investigar possível déicit na integração da informação visual no sistema de controle postural.
Introduction
The human postural control during upright standing depends upon the central integration of afferent information from vestibular, somatosensory and visual systems (Bear etal., 2007; Jones, 2000; Kelly,
1991). The sensorimotor integration developed by the brain constitutes the strategy for controlling the body sway and also requires updating the reliable inputs available to maintain the balance (Carver etal., 2005; Peterka, 2002; Sozzi etal., 2011). It is well accepted that in healthy subjects, feedback information from different subsystems is complementary and partially redundant, contributing in several ways to the body sway stabilization (Chiari et al., 2000; Jeka etal., 2008). Otherwise, when sensory information from vestibular, somatosensory or visual systems is inaccurate, balance can be compromised (Horak and MacPherson, 1996; Maurer etal., 2006; McGuire
and Sabes, 2009).
Under a stable environmental condition and a ixed support base, sensorial feedbacks are able to stabilize the body sway around the gravitational axis, producing a limited center of pressure (COP) displacement (stabilogram), which can be monitored as an output measure (Rougier, 2003). Speciically, the vision provides information about the environment to reduce body sway in a negative feedback mode (Kelly et al., 2005; Wurtz and Kandel, 2000). However, in a large proportion of individuals (30 to 40%), the reduction on COP sway upon eyes open condition when compared to eyes closed, is not in fact observed (Chiari etal., 2000; Da Silva etal., 2006). According to Gagey
and Weber (2005), this effect might be only partially explained by the wide inter-individual differences in the maintenance of balance and can also be used for the diagnosis of impaired body sway control.
During stabilometric test (30 s recording), the position of the COP in both directions in the horizontal plane and the respective sway area have been used to obtain quantitative assessment of the sensorimotor strategy mechanisms over the sway in both eyes open (EO) and closed (EC) conditions (Chiari etal., 2000; Da Silva etal., 2006; Gagey and Weber,
2005; Percio etal., 2007, 2009; Rougier, 2003;
Sozzi etal., 2011). Usually, the inluence of visual
input in the postural control has been studied using the classical Romberg’s Quotient test (RQ) based on the elliptical sway area (RQA), deined as the ratio
between the area values in EC and EO conditions (Chiari et al., 2000; Da Silva etal., 2006; Gagey
and Weber, 2005; Lacour etal., 1997). Considering RQA as Gaussian distributed after excluding outliers
and using a threshold based on the 95% conidence
interval, Gagey and Weber (2005) only assumed as healthy those subjects with RQA > 100. On the other
hand, Chiari etal. (2000), Da Silva etal. (2006)
and Lacour etal. (1997) have found a bimodal RQA
distribution in healthy subjects.
Although changes in the COP position represent valuable inputs to the central nervous system for maintaining the orthostatic posture by vision (Percio etal., 2007, 2009), this information is not
enough to promote effective balance. According to Jeka etal. (2004, 2008) and Masani etal. (2003), the proprioceptive muscle sensors could provide additional information to stabilize body sway, since they are more sensitive to the velocity of the center of mass (COM) than to its position or acceleration. Nevertheless, undisturbed postural stance condition produces small COM sways (and hence COP sways, due to their dynamical relationship), so that those muscles sensors would be less inluenced (Rougier, 2003). Additionally, the COP velocity has also the lowest reproducibility error and inter-subjects variability coeficient according to Raymakers etal. (2005). Thus,
the RQ based on COP velocity (RQV) allows inding
the cases where the velocity in EC condition exceeds the EO one and, according to Cornilleau-Pérès etal. (2005), could be more reliable to investigate the integrity of the body sway control.
In this study, the Romberg’s Quotient of the COP mean velocity from a large sample of healthy subjects is used for investigating whether all of them present similar changes in body sway when the eyes are closed, or some subjects may be considered as presenting impaired body sway control. Using a single stabilometric trail with one minute recording, the methodology consists irstly in adjusting a lognormal distribution to the RQV data. Then, based on the cumulative density function, determining the statistical limits for which subjects can be considered as properly using the visual system to control the upright posture sway.
Materials and Methods
Participants
using lens or glasses were included. Moreover, the subjects provided informed consent before inclusion in the study.
Experimental protocol
The stabilometric tests were conducted at the same environmental conditions for all subjects. In the experimental protocol the subjects were in the upright position, quite standing in the force platform with bare-footed, feet in 30° with two centimeters apart and arms along the trunk, as recommended by the French Posturology Association - Rule 85 (Bizzo etal., 1985).
The data was irstly collected with the subject in the eyes open condition during 30 s and then with eyes closed for the same time duration. In the EO condition, the subjects were instructed to focus a central ixed target 1.5 m in front of the force platform.
The stabilometric signal was acquired by a portable force platform composed with three load cells model MS50 (Excel Sensors, Brazil), with quadratic base of 0.16 m2. The signal of each load cell were ampliied (600×) and iltered (anti-aliasing: 25 Hz) using the MCS 100 conditioner (Lynx Technology, Brazil). The COP displacement signal was then sampled at 50 Hz (sample time interval ∆t = 0.02 s), using the data acquisition system CAD 1232 (Lynx Technology, Brazil) with 12 bits resolution, stored into a standard Pentium III PC (Intel, USA) and processed using Matlab v. 6.5 (The Mathworks, USA).
Body sway velocity parameters
The COP position signal was low-pass iltered by applying a 2nd order Butterworth ilter, with cut-off frequency in 7 Hz, in direct and reverse order to
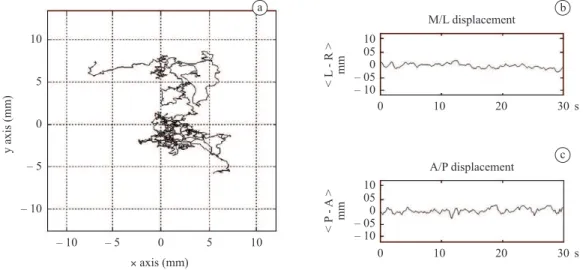
avoid phase shifts. Using the statokinesiogram and both COP displacement in the M/L and A/P axes (Figure 1), the mean velocity from EO (VmEO) and EC (VmEC) conditions was obtained by dividing the total COP sway path by the respective time duration.
Thus, for the M/L and A/P direction:
1
1
( 1) ( )
( )
−
= + −
∑ =
∆
K
i
dir i dir i Vm dir
k
(1)
where dir indicates the x variable in the M/L direction or y in A/P direction and ∆k = K∆t is the trial time duration, with K = 1500. In the (x,y) plane:
[
] [
]
1 2 2
1
( 1) ( ) ( 1) ( )
( , ) −
= + − + + −
∑ =
∆
K
i
x i x i y i y i
Vm x y
k
(2)
The RQV was thus calculated for both directions and the (x,y) plane as the relationship between the
Vm scores with EC and EO:
100 • •
•
= EC×
V m EO
Vm RQ
V (3)
where • indicates the M/L direction, the A/P direction or the (x,y) plane.
Posturographic analysis and statistics
Initially, for each VmEO, VmEC and the respective RQV
parameters, the irst (µˆ) and second (σˆ) moments were estimated including all casuistry (144 subjects) and the Student t-test (α = 0.05) was applied with the null hypothesis of equality between the mean. It is worth pointing out that just 10 subjects had RQV ≤ 100.
b
c a
The histograms of the velocity parameters in both directions and in the (x,y) plane were obtained with bin widths of 1.25 cm/s for VmEO and VmEC, and 25 for RQV data. All histograms depict asymmetric unimodal shapes (Figure 2), which were adequately itted to lognormal distributions (Kolmogorov-Smirnov test, α = 0.05, Table 1).
Hence, for each parameter distribution, the irst (M) and second (S) lognormal moments were estimated and the best-itted function adjusted using:
( )
1 (ln )2 (2 2)2
− −
= π
vel M S
P vel e
S vel (4)
where P(vel) is the estimated probability density function (PDF) of the VmEO, VmEC or RQV parameters. The mean, the standard deviation and the skewness values of the PDF for the lognormal distribution were obtained by, respectively:
( )
( 2/ 2)ˆ +
µ = M S
vel e (5)
Figure 2. The histograms and the lognormal curves itted to the experimental data. The values detached indicate the threshold scores for
the 0.025 to 0.975 conidence levels.
Table 1. The mean velocity data sample and the lognormal distribution central moments for the M/L and A/P directions and for the x-y plane in the EO and EC trial conditions. Numbers in bold refer to p ≥ 0.8 for the Kolmogorov-Smirnov (KS) test.
Mean velocity
Data
KS test (α = 0.05)
Lognormal PDF
ˆ
µ σˆ µˆ σˆ γˆ1
M/L EO 4.07• 1.49 0.76 4.06 1.57 1.95
EC 5.75• 3.09 0.92 5.72 3.26 2.40
A/P EO 5.15⊕ 1.42 0.74 5.15 1.40 1.24
EC 8.32⊕ 3.88 0.92 8.29 4.43 2.75
(x-y) Plane
EO 7.29‡ 2.08 0.79 7.32 2.15 1.09
EC 11.22‡ 5.19 0.92 11.28 5.86 2.14
RQV
M/L 139.17* 45.80 0.81 140.02 43.34 1.83
A/P 159.94*+ 53.36 0.94 159.79 50.07 1.69
x-y
Plane 151.35
+ 45.50 0.91 151.24 39.44 1.78
( )
2 2 2ˆ +
(
1)
σ = S M× S −
vel e e (6)
and
2 2
ˆ (1 )
(
2)
1γ = + S × S −
vel e e (7)
The cumulative density function (CDF) was then estimated as follows:
2
0
1 2
( ) 1
2
−
= × + π∫u u
CDF vel e du (8)
where u=[ln(vel)−M] /S 2 . Using the CDFs, the threshold scores classiication of the mean velocity parameters was determined for a conidence level of 0.025 and 0.975.
Finally, the scatter diagrams between VmEO
(or VmEC), in both direction and plane, and its RQV
were plotted. The Spear correlation (ρˆ, α = 0.05), the
respective determination (R2) and variation coeficients (CV= σ µˆ/ˆ) ware calculated to determine which mean velocity parameter characterize the variability of the
RQV scores.
Results
The VmEC data sample presented mean values greater than those obtained for the VmEO in both directions and also in the plane (Table 1). In the EC condition, 79,16% of the subjects presented mean velocity values in the A/P direction greater than those observed in the M/L, thus indicating a relationship between the absence of the visual information and the increased A/P oscillations. Moreover, the RQV scores in both A/P
and M/L directions were considered different (Student t-test, α = 0.05 and p << 0.001). Even though the mean
values in the x,y planewere greater than those in the A/P direction (Table 1), no statistical difference (p = 0.44) was found between RQV scores. In all cases, lognormal distributions were assumed (Kolmogorov-Smirnov test, α = 0.05), with higher p-values (p > 0.80) for
the VmEC and RQV parameters (Table 1).
Furthermore, the lognormal PDF mean values are close (error lower than 0.6%) to those estimated with the data sample. The VmEC lognormal distributions have skewness greater than the respective ones estimated for the VmEO, and hence, are more asymmetric (Table 1; Figure 2). On the other hand, similar skewness was observed among the RQV distributions. Taking
the conidence interval from 0.025 to 0.975 and considering the A/P direction (Figure 2), 134 subjects (93.1%) have their data located within these limits (RQV: µˆ = 167.14 and σˆ = 32.06) and just four
subjects (2.7%) appeared below the lower limit (RQV < 85.24), since other six subjects (4.2%) were
considered outliers (RQV > 267.44).
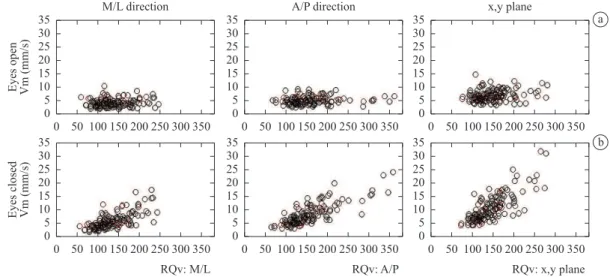
The scatter diagrams of the COP velocity parameters (Figure 3) show that VmEC are positively correlated with RQV. In EO condition, although the correlation is statistically signiicant (p < 0.05), the
Spear correlation coeficients ρˆ are very low, ranging
from 0.16 to 0.23 (Table 2). On the other hand, in the EC condition, this coeficient varies from 0.86 to 0.91 (p << 0.001, Table 2). Hence, based on the
coeficient of determination (R2) for A/P direction (Table 2), 75.7% of the variability of the RQV can be explained by the variability of the VmEC. Moreover, the coeficient of variation (CV) indicates that VmEC
has higher variability than VmEO, particularly in the A/P direction (Table 2).
Figure 3. Scattering diagrams of the COP velocity parameters ×RQV in the both direction and plane: a) Eyes open and b) Eyes closed condition. a
Discussion
As well known, the sensory feedbacks in the postural control system provide complementary and partially redundant information for body sway stabilization. The experimental protocol adopted in this study in which the subject is maintained in orthostatic position without any stimulus, is expected to cause small postural changes as a result of effective visual and proprioceptive feedbacks, as pointed out by Jeka et al. (2004, 2008). Besides, in such kind of experiment, the EO condition improves the balance control (Ray etal., 2008; Sozzi etal., 2011), reducing the mean velocity (Vm) of the sway (Cornilleau-Pérès etal., 2005).
In the present study, changes in the visual condition affected more the COP mean velocity in the A/P direction than in the M/L, which is in accordance with Berencsi etal. (2005), Jeka etal. (2008), Ray etal. (2008) and Sozzi etal. (2011). Moreover, the Romberg Quotient of Vm (RQV) in the A/P direction does not statistically (p = 0.44) differ from that in the (x,y) plane (t-student, α = 0.05) and hence they provide similar information, as reported by Cornilleau-Pérès etal. (2005). Thus, changes in the M/L direction appear as not constraining the results in the plane, suggesting the use of the COP velocity in A/P direction for investigating the mechanism of postural control by vision.
The RQV unimodal distribution indicates the existence of just one group in terms of visual strategy. Using similar setup, Cornilleau-Pérès etal. (2005)
and Elliot etal. (1998) also reported only one visual
category group when investigating the COP velocity of a healthy population. The positive skewness observed in all Vm and RQV distributions reveals that these parameters are not normally distributed. By assuming a lognormal distribution for the 144 RQV and taking
the inferior conidence limit (85.24), only four subjects (2.7%) are outside of it, which is in accordance with the signiicance level (α = 0.05, two tailed). This result agrees with Elliott etal. (1998), who also
observed an asymmetric distribution in Vm, reporting no case of impaired body sway control in a sample of 30 subjects. Additionally, the study reported by Cornilleau-Pérès etal. (2005) deserves consideration.
Using only 21 subjects with RQV > 100 and assuming
this parameter as Gaussian distributed, these authors pointed out that 99.8 is the lower threshold for which the postural sway control by vision could be considered abnormal. Applying the Cornilleau-Pérès procedure to the 132 subjects with RQV > 100, it was obtained
a lower limit of 98.72, resulting that eight of the 10 healthy subjects with RQV < 100 could present
an inadequate visual feedback to postural control. However, this inding differs from that obtained using a lognormal distribution.
The low variability of the COP mean velocity parameters during eyes open and the positive correlation with their respective RQV scores indicated that the effect of using the visual information to improve postural control is similar between all subjects. According to Levi and Klein (2003) and to Maeda etal. (1998),
during visual feedback impairment, the sway in EO condition is higher for the lower RQ values, implying in a negative correlation (not observed in this work). Additionally, Ray etal. (2008) reported that subjects with visual impairments present an inadequate postural control, increasing the sway when compared with a healthy population. Therefore, not all subjects with
RQV≤ 100 can be considered as presenting impaired visual control (or postural blind) and, unlike pointed out by Gagey and Weber (2005), the RQV can not be used alone as a normalcy index for the diagnosis of visual impairment sway control.
The removal of visual inputs increased the COP velocity in 93.1% of subjects, indicating that during eyes closed the COP sway increased, when compared to eyes open, which is in accordance with Sozzi etal. (2011). This inding suggests that the absence of visual feedback is not fully compensated by the other sensory inputs, increasing the variability of the COP displacement. Furthermore, the highest Spear correlation observed only during eyes closed condition (ρˆ ≥ 0.86, R2 ≥ 74.0%) demonstrated that the
V
RQ increased mainly because the VmEC have increased. Therefore, these results suggest the sensory integration as vision-dominant in the postural control, as pointed out by Cornilleau-Pérès etal. (2005) and Rougier
(2003). Moreover, even for the four subjects outside the lower conidence limits, this is no evidence of impaired postural control system. Hence, this study support the hypothesis of the sensory integration control proposed by Jeka etal. (2008), in which the postural control adaptively use available sensory inputs for compensating a removed feedback, for stabilizing the Table 2. The Spear correlation (ρˆ) and respective R2 and CV
coeficients between RQV and mean velocity for EO and EC data, for both M/L and A/P directions and the plane.
Mean velocity
parameters ρˆ R
2 (%) CV
M/L EO 0.16
‡ 2.6 0.37
EC 0.86* 74.0 0.54
A/P EO 0.17
‡ 2.9 0.28
EC 0.87* 75.7 0.47
(x, y) Plane EO 0.23
‡ 5.3 0.29
EC 0.91* 82.8 0.46
body. According to Maurer etal. (2006) and McGuire
and Sabes (2009), the presence of multiple inputs allows optimizing the use of the available sensory information under static environmental condition. It also can explain why eventually some healthy subjects (without visual deicit) reduce the sway during eyes closed condition.
Conclusion
The unimodal distribution observed in all Vm and RQV
histograms suggests that the subjects can be considered as coming from a single group in terms of visual strategy. The orthostatic stability during eyes open condition seems to be similar between the subjects, independently of their RQV values. Hence, the RQv
inter-individual variability may be mainly related to the spread in mean velocity during eyes closed condition. Therefore, the use of sole Romberg Quotient of the COP mean velocity in a single stabilometric trial with just one-minute total duration could be not enough for the diagnosis of body sway control impairment by vision. Nevertheless, the RQV could be useful to reveal the subjects having this index below the threshold, who are then indicated to carry out additional tests, and hence, to investigate a possible deicit in the integration of the visual information in the postural control system.
Acknowledgements
This work received inancial support from the Brazilian Research Council (CNPq), the Brazilian Foundation of the Ministry of Education (CAPES) and from the Rio de Janeiro State Foundation (FAPERJ).
References
Bear MF, Connors BW, Paradiso MA. Neuroscience: Exploring the brain. 3rd ed. Baltimore: Lippincott Williams & Wilkins; 2007.
Berencsi A, Ishihara M, Imanaka K. The functional role of central and peripheral vision in the control of posture. Human Movement Science. 2005; 24(5-6):689-709. http:// dx.doi.org/10.1016/j.humov.2005.10.014
Bizzo G, Guillet N, Patat A, Gagey P. Speciications for building a vertical force platform designed for clinical stabilometry. Medical & Biological Engineering & Computing. 1985; 23(5):474-6. http://dx.doi.org/10.1007/ BF02448937
Carver S, Kiemel T, Kooij H, Jeka JJ. Comparing internal models of the dynamics of the visual environment. Biological Cybernetics. 2005; 92(3):147-63. http://dx.doi.org/10.1007/ s00422-004-0535-x
Chiari L, Bertani A, Capello A. Classiication of visual strategies in human postural control by stochastic parameters. Human Movement Science. 2000; 19(6):817-42. http:// dx.doi.org/10.1016/S0167-9457(01)00024-0
Cornilleau-Pérès V, Shabana N, Droulez J, Goh JCH, Lee GSM, Chew PTK. Measurement of the visual contribution to postural steadiness from the COP movement: methodology and reliability. Gait & Posture. 2005; 22(2):96-106. http:// dx.doi.org/10.1016/j.gaitpost.2004.07.009
Da Silva PJG, Infantosi AFC, Nadal J. The role of vision in the body sway control: the elliptical sway area and the Romberg’s quotient of the stabilometric signal. Brazilian Journal of Biomedical Engineering. 2006; 22(1):13-22. Elliott C, Fitzgerald JE, Murray A. Postural stability of normal subjects measured by sway magnetometry: pathlength and area for the age range 15 to 64 years. Physiological Measurements. 1998; 19:103-9. http://dx.doi. org/10.1088/0967-3334/19/1/009
Gagey PM, Weber B. Posturologie: Régulation et dérèglements de la station debout. 3rd ed. Paris: Masson; 2005. Horak FB, MacPherson JM. Postural orientation and equilibrium. In: Rowell LB, Shepard JT, editors. Handbook of physiology. New York: Oxford University Press; 1996. p. 255-92.
Jeka J, Kiemel T, Creath R, Horak FB, Peterka R. Controlling human upright posture: velocity information is more accurate than position or acceleration. Journal of Neurophysiology. 2004; 92(4):2368-79. http://dx.doi. org/10.1152/jn.00983.2003
Jeka J, Oie KS, Kiemel T. Asymmetric adaptation with functional advantage in human sensorimotor control. Experimental Brain Research. 2008; 191(4):453-63. http:// dx.doi.org/10.1007/s00221-008-1539-x
Jones GM. Postrure. In: Kandal ER, Schwartz JH, Jessel TM, editors. Principles of neurological science. 4th ed. New York: McGraw-Hill; 2000. p. 816-31.
Kelly JP. The sense of balance. In: Kandal ER, Schwartz JH, Jessel TM, editors. Principles of neurological science. 3rd ed. New York: Elsevier; 1991. p. 500-11.
Kelly JW, Loomis JM, Beall AC. The importance of perceived relative motion in the control of posture. Experimental Brain Research. 2005; 161(3):285-92. http://dx.doi.org/10.1007/ s00221-004-2069-9
Lacour M, Barthelemy J, Borel L, Magnan J, Xerr C, Chays A, Ouaknne M. Sensory strategies in human postural control before and after unilateral vestibular neurotomy. Experimental Brain Research. 1997; 115(2):300-10. http:// dx.doi.org/10.1007/PL00005698
Levi DM, Klein SA. Noise provides some new signals about the special vision of amblyopes. The Journal of Neuroscience. 2003; 23(7):2522-6.
Authors
Paulo José Guimarães da Silva, Jurandir Nadal, Antonio Fernando Catelli Infantosi*
Biomedical Engineering Program, Alberto Luiz Coimbra Institute Graduate School and Research in Enginerring – COPPE, Federal University of Rio de Janeiro – UFRJ, CP 68510, CEP 21941-972, Rio de Janeiro, RJ, Brazil.
Masani K, Popovic MR, Nakazawa K, Kousaki M, Nozaki D. Importance of body sway velocity information in controlling ankle extensor actives during quiet stance. Journal of Neurophysiology. 2003; 90(6):3774-82. http:// dx.doi.org/10.1152/jn.00730.2002
Maurer C, Mergner T, Peterka RJ. Multisensory control of human upright stance. Experimental Brain Research. 2006; 171(2):231-50. http://dx.doi.org/10.1007/ s00221-005-0256-y
McGuire LM, Sabes PN. Sensory transformations and the use of multiple reference frames for reach planning. Nature Neuroscience. 2009; 12(8):1056-61. http://dx.doi. org/10.1038/nn.2357
Percio CD, Brancucci A, Bergami F, Marzano N, Fiore A, Ciolo ED, Aschieri P, Lino A, Vecchio F, Iacoboni M, Gallamini M, Babiloni C, Eusebi F. Cortical alpha rhythms are correlated with body sway during quiet open-eyes standing in athletes: A high-resolution EEG study. NeuroImage. 2007; 36:822-9.
Percio CD, Babiloni C, Marzano N, Iacoboni M, Infarinato F, Vecchio F, Lizio R, Aschieri P, Fiore A, Toràni G, Gallamini M, Baratto M, Eusebi F. Neural eficiency of athletes’ brain for upright standing: A high-resolution EEG study. Brain Research Bulletin. 2009; 79:193-200.
Peterka RJ. Sensorimotor integration in human postural control. Journal of Neurophysiology. 2002; 88(3):1097-18. Ray CT, Horvat M, Croce R, Mason RC, Wolf SL. The impact of vision loss on postural stability and balance strategies in individuals with profound vision loss. Gait & Posture. 2008; 28(1):58-61. http://dx.doi.org/10.1016/j. gaitpost.2007.09.010
Raymakers JA, Samson MM, Verhaar HJJ. The assessment of body sway and the choice of the stability parameter(s). Gait & Posture. 2005; 21(1):48-58. http://dx.doi.org/10.1016/j. gaitpost.2003.11.006
Rougier P. The inluence of having the eyelids open or closed on undisturbed postural control. Neuroscience Research. 2003; 47:73-83. http://dx.doi.org/10.1016/ S0168-0102(03)00187-1
Sozzi S, Monti A, De Nunzio AM, Do M, Schieppati M. Sensori-motor integration during stance: Time adaptation of control mechanisms on adding or removing vision. Human Movement Science. 2011; 30(2):172-89. http:// dx.doi.org/10.1016/j.humov.2010.06.002