*e-mail: [email protected]
Pulsed dc Discharge in the Presence of Active Screen for Nitriding of High Carbon Steel
Adnan Saeeda,b*, Abdul Waheed Khana,b, Faiq Janc, Muhammad Waqard, Muhammad Abrarb,e,
Zaka-Ul-Islam Mujahidf, Ali Hussnaing, Muhammad Zakaullahd
aDepartment of Physics, Gomal University, 29050, D.I.Khan, Pakistan
bNational Centre for Physics, Quaid-i-Azam University Campus Islamabad, 45320, Islamabad, Pakistan cInstitute of Physics and Electronics University of Peshawar 25120, Peshawar, Pakistan
dDepartment of Physics, Quaid-i-Azam University, 45320, Islamabad, Pakistan eDepartment of Physics, Hazara University Mansehra, Mansehra, Pakistan
fDepartment of Physics, Faculty of science, Jazan University,
45142, CP 114, Jazan, kingdom of Saudi Arabia
gDepartment of Physics, Government College University, 54000, Lahore, Pakistan
Received: September 22, 2013; Revised: June 10, 2014
A discharge of nitrogen-hydrogen mixture by 50 Hz pulsed dc in the presence of active screen cage is investigated by optical emission spectroscopy (OES). The aim is to identify the parameters (mixture ratio, filling pressure and current density) that may lead to high concentration of active species (N2, N2+ and N). The maximum concentration in this experiment is found with 40% H
2-60% N2, at
filling pressure of 3 mbar with current density of 5 mAcm–2. High carbon steel samples are nitrided
for 1-4 hours at 500°C and the treated samples are characterized by X-ray diffraction (XRD), Raman spectroscopy and Vicker’s micro-hardness testing. The XRD spectra show different phases of nitrides (Fe2-3N, FeN, CrN) along with iron oxides. The Raman spectra confirm the formation of α-β (C3N4). The surface hardness is found to increase up to six times for 2 hour treatment.
Keywords: Cathodic cage, plasma nitriding, edge effect
1. Introduction
The dc plasma nitriding (DCPN) is a well-accepted industrial process for the improvement of surface properties such as hardness, wear and corrosion resistance, thus increasing the useful life of the treated piece1-4. It has several
advantages over other nitriding techniques such as gas and salt bath nitriding. These advantages include economical process and shorter processing time because the nitrogen diffusion speed is greater in DCPN. However there are many inherent limitations of DCPN such as: parts to be treated must be fully electrical conductive, the surface damage caused by sputtering and arcing, non-uniform nitriding due to edge effect, non-uniform nitriding due to variation in temperature, hollow cathode effect and difficulties in batch treatment of large amount of small components5.
In order to overcome these undesirable effects, various alternatives to the nitriding process have been developed6,7.
In the last few years a new technique, called active screen plasma nitriding (ASPN) is developed, in which the entire workload is surrounded by a metal screen or cage, on which, a high cathodic potential is applied (so that the term active screen is used). The worktable and the parts to be treated are placed in a floating potential or subjected to a relative lower bias voltage. Therefore, it is on the active screen, rather than on the component surface, that the plasma is formed. The plasma heats up the active screen, and radiation from
the screen heats the components. The plasma formed on the screen also contains a mixture of ions, electrons and other active species, which are then encouraged to flow through the screen and reside over the workload2,8. ASPN
technique indeed possesses great potential to fully realize the environmental friendly plasma technology in the thermo chemical surface engineering industry9.
Numbers of experiment have been reported on the effect of screen cage nitriding of various metals and alloys. Yazdani et al.8 found that by applying ASPN for less than
10 hours causes the formation of nano sized particulate titanium nitride layer on H11 tool steel surface. They concluded that N2/H2 is crucial for deposition chemistry using ASPN. For low nitriding periods a gas mixture of 50% N2-50% H2 gives best results. For longer periods H2 rich gas mixture is desirable. Asadi et al.10 studied the
effect of component’s geometry on the plasma nitriding behavior of AISI 4340 steel using conventional nitriding plasma (CNP) and active screen plasma nitriding (ASPN). They concluded that the surfaces of the active screen plasma nitrided specimens are covered by the hexagonal particles with uniform distribution whereas the surfaces of the CPN treated samples are composed of cauliflower shape nitrides. Nishimoto et al.11 studied the effect of distance
25% N2+75% H2. They observed that polygonal particles with a normal distribution were found at the entire of the sample surfaces and concluded that the thickness of the surface-hardened layer is increased as the distance between the screen and the sample is decreased. Chiu et al.12 studied
the microstructure and properties of active screen plasma nitrided UNS S31803 duplex stainless steel (DSS) at different temperatures ranging from 400°C to 450°C. It was concluded that specimen nitrided at 420°C for 10 h formed a precipitation-free nitrided layer on the surface, which significantly increased the surface hardness with the least wear mass loss, and was much more corrosion resistant. Corujeira Gallo et al.13 studied the mechanism of active
screen plasma nitriding. They reported that the material transferred from the cage on to the treated specimen plays a significant role in hardening. Sharma et al.14 investigated
the optical emission spectroscopy in pulsed dc plasma of N2, N2-H2 and N2-Ar. They observed that negative glow of nitrogen plasma shrinks in the presence of hydrogen. They found that N2+ emission intensity varies linearly
with pressure at low hydrogen addition. Kumar et al.15
studied the effect of hydrogen on the growth of nitrided layer in rf plasma. On the basis of their spectroscopic observations they concluded that the addition of hydrogen does not increase the concentration of nitriding active species. Priest et al.16 studied the effect of hydrogen in low
pressure rf plasma nitriding. They found an increase in the secondary ionization coefficient after exposure to hydrogen plasma pre-treatment because of the removal of oxides form the cathode surface. Sharma et al.17 have investigated
nitriding of austenitic stainless steel in N2 and N2-H2 pulsed dc plasma. Form their spectroscopic observation
they concluded that the emission intensities of N2 and N2+
increases up to 20% H2 in the mixture.
However, there are no systematic studies under taken to optimize the active screen cage (ASC) pulsed dc plasma in terms of pressure, current density and hydrogen concentration using optical emission spectroscopy.
In this study, samples of high carbon steel are nitrided in the presence of active screen cage to investigate the effect of treatment time on nitrided layer, after optimizing the ASPN reactor in terms of filling pressure, current density and hydrogen concentration using optical emission spectroscopy (OES).
2. Experimental Procedure
2.1.
Experimental apparatus
The nitriding experiment is carried out in a stainless steel chamber having 62 cm height and same diameter. Two electrodes in parallel plate configuration are housed inside the chamber. A 50 Hz pulsed DC power supply (locally manufactured) is connected to the top electrode through inductive load. A heater along with a thermocouple is used to heat the substrate and to monitor the temperature during the nitriding process. Details of the experimental setup can be found else-where18. A screen cage made of 0.5 mm thick
316 stainless steel sheet, 160 mm in diameter and 74 mm height with ~ 0.15 mm diameter holes uniformly spread all over surface. The distance between two consecutive holes center is approximately 5 mm. The distance between the screen cage and the anode is adjusted to 6 cm19. The samples
are placed on alumina disc as shown in Figure 1. The distance between the top surface of screen cage and samples
is 7 cm. The plasma is now forming on the cage, which is at cathodic potential, and not directly on the samples. Plasma induced optical emission spectroscopy is carried out using a computer controlled system comprising of ocean spectrometer (HR4000 CG-UV-NIR USB 2000) with grating 300 lines/mm and resolution of 0.5 nm (FWHM)
[20]. The spectrum is recorded in the wavelength range of
200-1100 nm. The spectra of nitrogen plasma showed that the second positive system of N2 and first negative system of N2+ considerably dominate the spectrum in the range
330-430 nm. Therefore spectrum in the range 330-430 nm is recorded again using simultaneously the ocean spectrometer and a McPherson–2061 monochromator having grating with 1200 grooves/mm and spectral resolution of 0.01 nm (while spectra are recorded at 0.1 nm resolution) coupled with a side window photo-multiplier tube (PMTR928) and auto ranging Pico-ammeter (Keithley-485) The width of the entrance slit, focal length (f) and aperture of the monochromator are 5 µm, 1 m and f/7, respectively21.
2.2.
Material
The samples used in this study are high carbon steel with chemical composition given in Table 1. The samples are squares of area 11 mm × 11 mm and thickness 2.5 mm. Samples are mechanically polished using different grit size silicon carbide papers (180,240,400 and 600, 1800). Samples were then mirror polished with Micro cloth with one micron Alumina powder using METKON GRIPO 2V polishing machine. The samples were then cleaned with methanol in ultra-sonic bath for 15 minutes, each time before placing them into the plasma chamber.
2.3.
Processing
All the samples are treated under treatment conditions given in Table 2. After the samples are placed in to the nitriding chamber the chamber is evacuated down to 10–2
mbar pressure. Nitrogen and Hydrogen are then introduced into the chamber and pulsed DC power supply is turned on. The nitriding times starts once the processing temperature is achieved. After the experiment the samples are cooled down to room temperature under vacuum inside the nitriding chamber.
2.4.
Characterization
The surface morphology of untreated and plasma nitrided samples is studied by obtaining micrographs at a magnification of ×5000 using a JEOL JSM-5910 scanning electron microscope (SEM). The phase structure is analysed by X-ray diffractrometer (Philips X’ Pert PRO MRD) with
CuKα (λ =1.54 A°) radiation operated at voltage of 40 kV and current of 40 mA. The XRD peaks are identified by reference to JCPDS powder diffraction files. The surface hardness is measured by Wilson Wolpert 401 MVA Vickers micro-hardness tester equipped with a 136° diamond indenter.
3. Results and Discussion
3.1.
Spectroscopic observations
Characteristic emission spectra are recorded by McPherson–2061 spectrometer in the wavelength range between 330-430 nm. The spectra of nitrogen plasma show that the second positive system of N2 and first negative system of N2+ considerably dominates the spectrum in
this range. In Figure 2 the vibrational emission spectra of nitrogen-hydrogen (60% N2-40% H2) plasma at 3 mbar (5 mAcm–2current density) for two different wavelength
scanning ranges are shown. Different identified species are listed in Table 3. In the 330-372 nm range, only emission of nitrogen molecular bands is observed. In the 372-430 nm range, bands of nitrogen molecular ion along with the few atomic lines of nitrogen (N-I) are detected. N2 (0,0), N2 (1,2), N2 (0,1), N2 (2,4), N2 (1,3), N2 (0,2), N2+ (0,0), N2+
(1,2), N2+ (0,1) intensities are the prominent bands in the
330-430 nm range of the emission spectrum22. Intensity
of nitrogen atomic line (at 425.01 nm) appears weak as compared to the rest of the intensities. Figure 3a shows that the emission intensities of different detected species increases with increasing current density at constant filling pressure. It can be explained as follow: higher current density increases the quantity of charge carriers in the system, mainly electrons, thus increasing the probability of inelastic collisions with the gas molecules and their emission intensity. Figure 3b depicts the dependence of emission intensity with filling pressure. At constant current density the increase in the emission intensity of N2 (0, 1) is according to expectation. While the intensity of N2+ (0, 0) and (0, 1)
and the N-I lines first increase with increasing pressure and then saturates. The energy of the electrons mainly depends on the applied potential and on the gas pressure (mean free path between collisions with the gas molecules). At higher pressures, the probability of inelastic collisions is higher, and this increases the emission intensity. This trend continues up to a limit related to the excitation/ionization energy threshold. When the pressure is increased further, the collisions become so frequent that the energy gained by the electrons in their mean free path is not enough for ionization or excitation events, thus reducing the probability
Table 2. Process parameters of active screen plasma nitriding.
Current Density N2:H2 Temperature Pressure Time
5 mAcm-2 60:40 500 °C 3 mbar 1-4 hours
Table 1. Chemical compositions (wt. %) of high carbon steel.
Ni Cr Mo C Si Mn P S Ni Fe
of inelastic collisions. In Figure 3c the addition of small quantities of hydrogen (less than 40%) leads to a significant intensity increase. As the nitrogen concentration decreases to less than 60%, relative emission intensity decreases with a nitrogen decrease. The increase in the emission intensity of nitrogen active species with the addition of hydrogen can be explained due to increase in the secondary electron emission coefficient. With the increase of the secondary electron emission coefficient, nitrogen ions and neutral intensities are increased at less than 40% hydrogen because the collision probability increases in the plasma22,23. On the
other hand, the decrease in intensity above 40% H2 may be attributed to the decrease in N2 density24.
3.2.
XRD observations
For measuring the phases in the solid materials and powders a versatile and non-destructive analytical XRD technique is used. The irradiated samples are scanned in the range from 20°to 80° as shown in Figure 4. The most intense peak in the untreated sample appears at 2θ values of 44° corresponding to (101) plane of Fe along with a small peak at 2θ value of 64° corresponding to (200) plane of iron. In addition to iron peaks some small peaks of carbon also appear at 2θ values of 32°,39° and 72° corresponding to (020), (021) and (023) planes of carbon. The plasma treated samples showed a large amount of nitrides with iron, carbon and chromium. The only difference in the XRD pattern of the
Table 3. List of wavelengths and transitions of N2, N2+ and N-I species identified during the OES.
Species Wavelength (nm) Transition System
N2
337.1 (ʋ/ = 0,ʋ// = 0)
3 3
C Π → ΠB Second Positive System 344.6 (ʋ/ = 4,ʋ// = 5)
353.67 (ʋ/ = 1,ʋ// = 2) 357.69 (ʋ/ = 0,ʋ// = 1) 371.05 (ʋ/ = 2,ʋ// = 4)
2 N+
375.54 (ʋ/ = 1,ʋ// = 3)
2 2
u g
B Σ → Σ+ X + First Negative System 380.49 (ʋ/ = 0,ʋ// = 2)
394.30 (ʋ/ = 2,ʋ// = 5) 399.84 (ʋ/ = 1,ʋ// = 4) 405.94 (ʋ/ = 0,ʋ// = 3) 391.44 (ʋ/ = 0,ʋ// = 0) 388.43 (ʋ/ = 1,ʋ// = 1) 419.91 (ʋ/ = 2,ʋ// = 3) 423.65 (ʋ/ = 1,ʋ// = 2) 427.81 (ʋ/ = 0,ʋ// = 1)
N-I 401.113 2s
22p2(3P)3s – 2s22p2(3P)5p
425.01 2s22p2(3P)3p – 2s22p2(1D)3d
Figure 2. Emission spectra of N2/H2 plasma at filling pressure of 3 mbar and 5 mAcm
plasma irradiated samples for different processing duration is the disappearance of peaks at 2θ values of 35°and 39° corresponding to (–1 2 3) and (1 10 –1) planes of C3N4. The reason behind this fact is that the C3N4 form in the samples due to nitrogen incorporation into the steel matrix does
not sustain the treatment temperature for larger processing times. The Raman results (discussed below) also support this statement. Since C3N4 are supposed to be super hard materials having hardness comparable with that of diamond. High hardness achieved for the samples treated for 2 hours is mainly because of high nitrogen content in the form of iron nitrides, carbon nitrides and chromium nitrides.
3.3.
Raman observations
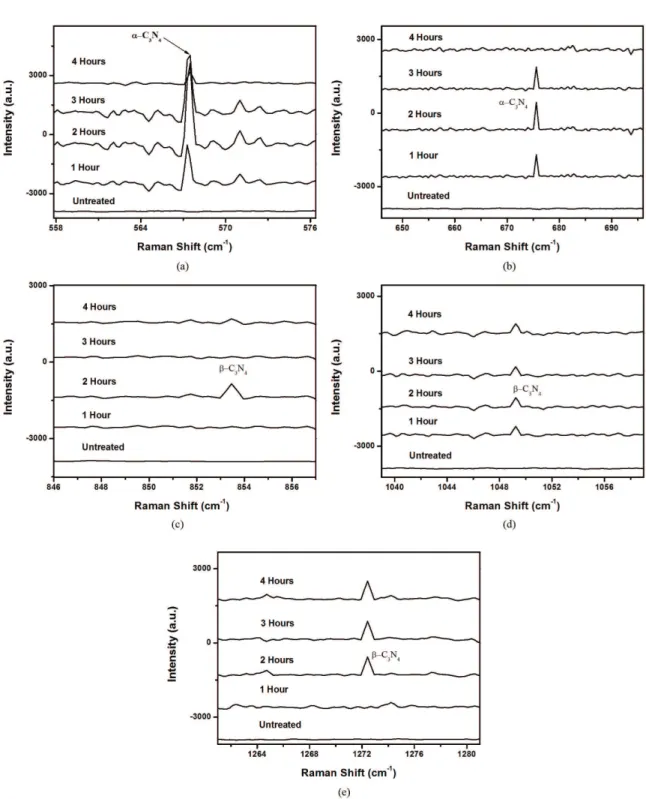
Raman spectroscopic measurements are performed with an Avantes Ava-Raman microprobe equipped with diode laser of 785 nm line at a power level of 100 mW. Figures 5a-e depicts the Raman spectra of samples for different scanning ranges treated at different treatment times.
Different observed and reported Raman shifts frequencies due to Raman scattering from α and β phases of C3N4 are shown in Table 4. The peak at 567 cm–1 shown in Figure 5a
confirms the formation of α-C3N4 which is quite close to the reported value of 559 cm–1[25]. Similarly the observed peak at
675 cm–1shown in Figure 5b is close to the reported peak at
672 cm–1[25] again associated with the α-C
3N4. The decrease
in the peaks amplitude is observed after 2 hours of treatment. It can be presumed that α-C3N4 phase formed after nitriding
Figure3. Variation of emission intensities as a function of (a) current density at 3 mbar pressure (b) fill pressure at 5 mAcm–2 current density (c) hydrogen concentration at 3 mbar pressure and 5 mAcm–2 current density.
Figure 5. Raman spectra of high carbon steel samples nitrided for different treatment times (1-4 hours) (a) 558-576 cm–1 (b) 646-696 cm–1 (c) 846-857 cm–1 (d) 1039-1059 cm–1 (e) 1261-1281 cm–1.
does not sustain the temperature for longer treatment time. The Raman peak at 853 cm–1shown in Figure 5c is observed
only for the sample treated for 2 hours which is associated with β-C3N4. The observed peak is close to the reported peak at 885 cm–1. The observed peak at 1049 cm–1 shown
in Figure 5d is very close to the reported peak at 1047 cm–1
again associated with the β-C3N4[25]. Figure 5e shows another
Raman peak at 1272 cm–1, which is close to the reported
peak at 1237 cm–1 associated with the β-C
3N4. From the
3.4.
SEM observations
A clear difference of surface can be seen upon inspection of untreated and treated samples. The surface of untreated samples is a light grey, shiny and bright whereas the surface of treated samples is grey with a dull appearance. The surface morphology of untreated and plasma nitrided samples is studied by obtaining micrographs at a magnification of ×5000 using a JEOL JSM-5910 scanning electron microscope (SEM).
Careful examinations of the micrographs shown in Figure 6 reveal the extent of modification as a function of treatment time. A relatively smoother surface morphology is apparent at a sample nitrided for 2 hours. The surface smoothness appears to be deteriorating with increasing treatment time. The surface of the nitrided samples treated for time higher than 2 hours shows a porous surface profile. This can be attributed to the fact that the C-N bonds formed on the surface do not sustain the temperature for longer treatment time.
3.5.
Hardness observations
The surface hardness of different samples is measured as a function of applied loads using a Wilson Instrument 401 MVA Vickers micro hardness tester equipped with a 136°diamond indenter. Figure 7 shows the hardness profile of plasma nitrided high carbon steel samples at a current density of 5 mAcm−2. Different loads (10-300 g)
are applied to obtain a micro-hardness profile. Each point on the graph shown in the figure is representing the average of five hardness values measured at random for each load. Approximately 8% variations in hardness values are observed for smaller loads and the variations approach to better than 6% for higher loads. For higher applied load more than 200 g, a constant micro hardness value of approximately 1.8 GPa, representing the bulk hardness value is found.
Table 4. Observed and calculated Raman frequencies in α and
β- C3N4.
Reported Raman spectrum (cm–1)* Observed peaks (cm–1) α and
β-C3N4 α- C3N4 β-C3N4
206 219
266 289
300 327 330
369 403 426 438 459 482 509 516
548
559 567
645 658
672 675
735
885 853
955
1047 1049
1237 1272
1327 1343 1497
Figure 7 shows a significant improved micro hardness in the near surface region of all the nitrided samples. The surface hardness increases continuously for smaller treatment times and up to a maximum of 10.45 GPa, which is nearly a 6 times increase as compared to the high carbon steel bulk value. After 2 hours of treatment, the surface hardness decreases showing that he C-N bonds formed on the surface cannot sustain the temperature for longer time. Raman peaks shown in Figures 5a-b also support this statement. The enhanced surface hardness can be attributed to the nitrogen diffusion into the high carbon matrix by nitrogen incorporation. The high nitrogen content at the surface would provide a high nitrogen potential for diffusion. However, the low nitriding temperature used in this study (500 °C) could justify a slow diffusion and a steep nitrogen gradient. Also the superficial hard nitrided layer containing nitrogen phase acts as a diffusion barrier for further deeper nitrogen penetration. Saturation in surface hardness, within the statistical error, is observed when the samples are treated for longer treatment times (>4 hours). This may be due to a dynamic equilibrium in the crystalline phase formation and the damage of preformed nitride phase, observed in XRD. The macroscopic expansion of the grain boundaries and the high internal stress increases the material hardness.
4. Conclusions
The present study on the processing conditions of high carbon steel in an active screen cage plasma nitriding chamber yielded the following conclusions:
• OES analysis is a useful technique to identify the
window of treatment conditions and to reduce the number of trails.
• TheXRDresultconirmstheformationofnitrides
with iron, carbon and chromium. The increase in the surface hardness is attributed to these nitrides.
• ThedecreaseintheintensityofC-NRamanpeaks
indicates that the bonds formed on the surface of the samples does not sustain the temperature for longer treatment times.
• SEManalysisalsoconirmsthatthesmoothnessofthe
nitrided surface decreases after 2 hours of treatment. The surface becomes porous after 2 hours of treatment The window of treatment conditions identified by optical emission spectroscopy (OES) for the system used in the present study are 3 mbar pressure, 5 mAcm–2 current
density and gas composition of 60%N2- 40%H2 to produce a 6 time harder surface.
Acknowledgement
The work is partially supported by QAU URF, Pakistan Science Foundation (PSF) Project No. PSF/RES/Phys (152), HEC project 20-2002 (R&D) and HEC project for Gomal University Plasma Physics Laboratory. Authors A. Saeed, A. W. Khan, M. Abrar and F. Jan acknowledge the financial support of HEC for their doctoral studies under the indigenous fellowship scheme.
References
1. Sousa RRM, Araújo FO, Ribeiro KJB, Mendes MWD, Costa JAP and Alves Jr C. Cathodic cage nitriding of samples with different dimensions. Mater Sci Eng A. 2007; 465(1-2):223-227. http://dx.doi.org/10.1016/j.msea.2007.03.007
2. Li CX, Bell T and Dong H. A study of active screen plasma nitriding. Surf Eng. 2002; 18(3):174-181. http://dx.doi. org/10.1179/026708401225005250
3. Li CX and Bell T. Corrosion properties of active screen plasma nitrided 316 austenitic stainless steel. Corros Sci. 2004; 46(6):1527-1547. http://dx.doi.org/10.1016/j. corsci.2003.09.015
4. Li CX. Active screen plasma nitriding: an overview.
S u r f E n g. 2 0 1 0 ; 2 6 ( 1 - 2 ) : 1 3 5 - 1 4 1 . h t t p : / / d x . d o i . org/10.1179/174329409X439032
5. Li CX and T Bell. Sliding wear properties of active screen plasma nitrided 316 austenitic stainless steel. Wear. 2004; 256(11-12):1144-1152. http://dx.doi.org/10.1016/j. wear.2003.07.006
6. Oliveira F, Hernández L, Berrı́os JA, Villalobos C, Pertuz A and Puchi Cabrera ES. Corrosion-fatigue properties of a 4340 steel coated with Colmonoy 88 alloy, applied by HVOF thermal spray. Surf Coat Technol. 2001; 140(2):128-135. http://dx.doi. org/10.1016/S0257-8972(01)01015-5
7. Alves Jr C, Rodrigues JA and Martinelli AE. The effect of pulse width on the microstructure of d.c.-plasma-nitrided layers.
Surf Coat Technol. 1999; 122(2-3):112-117. http://dx.doi. org/10.1016/S0257-8972(99)00326-6
8. Yazdani A, Soltanieh M, Aghajani H and Rastegari S. A new method for deposition of nano sized titanium nitride on steels.
Vacuum. 2011; 86(2):131-139. http://dx.doi.org/10.1016/j. vacuum.2011.04.020
9. Bell T and Li CX. Active screen plasma nitriding of materials.
International Heat Treatment & Surface Engineering. 2007; 1(1):34-38. http://dx.doi.org/10.1179/174951407X169231
10. Asadi ZS and Mahboubi F. Effect of component’s geometry on the plasma nitriding behavior of AISI 4340 steel.
Mater Des. 2012; 34:516-521. http://dx.doi.org/10.1016/j. matdes.2011.04.066
11. Nishimoto A, Nagatsuka K, Narita R, Nii H and Akamatsu K. Effect of the distance between screen and sample on active screen plasma nitriding properties. Surf Coat Tech. 2010; 205(Suppl 1):S365-S368. http://dx.doi.org/10.1016/j. surfcoat.2010.08.034
12. Chiu LH, Su YY, Chen FS and Chang H. Microstructure and properties of active screen plasma nitrided duplex stainless steel. Mater Manuf Process. 2010; 25(5):316-323. http://dx.doi. org/10.1080/10426911003748020
13. Corujeira Gallo S and Dong H. On the fundamental mechanisms of active screen plasma nitriding. Vacuum. 2009; 84(2):321-325. http://dx.doi.org/10.1016/j.vacuum.2009.07.002
14. Sharma MK, Saikia BK and Bujarbarua S. Optical emission spectroscopy of DC pulsed plasmas used for steel nitriding.
Surf Coat Tech. 2008; 203(3-4):229-233. http://dx.doi. org/10.1016/j.surfcoat.2008.08.036
15. Kumar S, Baldwin MJ, Fewell MP, Haydon SC, Short KT, Collins GA et al. The effect of hydrogen on the growth of the nitrided layer in r.f.-plasma-nitrided austenitic stainless steel AISI 316. Surf Coat Tech. 2000; 123(1):29-35. http://dx.doi. org/10.1016/S0257-8972(99)00393-X
16. Priest JM, Baldwin MJ and Fewell MP. The action of hydrogen in low-pressure r.f.-plasma nitriding. Surf Coat Tech. 2001; 145(1-3):152-163. http://dx.doi.org/10.1016/ S0257-8972(01)01311-1
17. Sharma MK, Saikia BK, Phukan A and Ganguli B. Plasma nitriding of austenitic stainless steel in N2 and N2–H2 dc pulsed discharge. Surf Coat Tech. 2006; 201(6):2407-2413. http://dx.doi.org/10.1016/j.surfcoat.2006.04.006
18. Naseer S, Khan FU, Rehman NU, Qayyum A, Rahman F and Zakaullah M. Plasma nitriding of aluminium in a pulsed dc
glow discharge of nitrogen. Eur Phys J Appl Phys. 2010; 49(2). http://dx.doi.org/10.1051/epjap/2009203
19. Saeed A, Khan AW, Jan F, Khalid M and Zakaullah M. Validity of “sputtering and re-condensation” model in active screen cage plasma nitriding process. Appl Surf Sci. 2013; 273:173-178. http://dx.doi.org/10.1016/j.apsusc.2013.02.008
20. Jan F, Khan AW, Saeed A and Zakaullah M. Mode transition in magnetic pole enhanced inductively coupled argon plasmas.
Eur. Phys. J. D. 2012; 66:103:1-7.
21. Khan F, Rehman N, Naseer S, Naveed M, Qayyum A, Khattak N et al. Diagnostic of 13.56 MHz RF sustained Ar–N2 plasma by optical emission spectroscopy. Eur Phys J Appl Phys. 2009; 45(1). http://dx.doi.org/10.1051/epjap:2008198
22. Pearse RWB and Gaydon AG. The identification of molecular spectra. London: Chapman & Hall; 1964. PMCid:PMC1552182
23. Kim YM, Kim JU and Han JG. Investigation on the pulsed DC plasma nitriding with optical emission spectroscopy. Surf Coat Technol. 2002; 151-152:227-232. http://dx.doi.org/10.1016/ S0257-8972(01)01601-2
24. Bougdira J, Henrion G and Fabry M. Effects of hydrogen on iron nitriding in a pulsed plasma. J. Phys. D Appl. Phys. 1991; 24(7):1076. http://dx.doi.org/10.1088/0022-3727/24/7/007