http://www.biotaneotropica.org.br/v13n3/en/abstract?article+bn01913032013 http://www.biotaneotropica.org.br Biota Neotrop., vol. 13, no. 3
Variation in the diet of the lizard Tropidurus torquatus along its coastal range in Brazil
Carla Costa Siqueira1,4, Mara Cíntia Kiefer1,2, Monique Van Sluys1,3 & Carlos Frederico Duarte Rocha1
1Departamento de Ecologia, Universidade do Estado do Rio de Janeiro – UERJ, CEP 20550-011,
Rua São Francisco Xavier 524, Rio de Janeiro, RJ, Brazil
2Departamento de Biologia Geral, Instituto de Biologia, Universidade Federal Fluminense – UFF,
CP 100436, Centro, CEP 24020-971, Niterói, RJ, Brazil
3Taronga Conservation Society Australia, Bradleys Head Road, 2088, Mosman, NSW, Australia 4Corresponding author: Carla Costa Siqueira, e-mail: [email protected]
SIQUEIRA, C.C., KIEFER, M.C., VAN SLUYS, M. & ROCHA, C.F.D. Variation in the diet of the lizard Tropidurus torquatus along its coastal range in Brazil. Biota Neotrop.13(3): http://www.biotaneotropica.org. br/v13n3/en/abstract?article+bn01913032013
Abstract: The diet composition of lizards of a given species may vary among different populations. The feeding ecology of the tropidurid lizard Tropidurus torquatus was studied in 10 coastal areas in Brazil in order to detect to what extent the diet varies along its geographic range. A non-metric multidimensional scaling technique revealed three groups of localities according to the diet composition: one characterized by a relatively high consumption of Isoptera, one characterized by a relatively high proportion of plant matter, and one in which there was a great importance of Formicidae. We found a weak pattern of latitudinal differences in restingas regarding the general consumption of items by T. torquatus, probably because this is a generalist and opportunistic lizard, which consumes most of the available types of potential food items in the habitat. However, lizards from northern populations consumed a larger quantity of smaller items (e.g., Isoptera) than those from southern populations. In the southern populations, on the other hand, larger items such as Coleoptera, Lepidoptera larvae and fruits were more frequently consumed. It is likely that the observed interpopulational variation in some aspects of the feeding ecology of coastal T. torquatus is mainly given by food availability.
Keywords: geographic variation, feeding ecology, restinga habitat, tropical lizard, Tropiduridae.
SIQUEIRA, C.C., KIEFER, M.C., VAN SLUYS, M. & ROCHA, C.F.D. Variação na dieta do lagarto Tropidurus torquatus ao longo de sua distribuição costeira no Brasil. Biota Neotrop. 13(3): http://www.biotaneotropica. org.br/v13n3/pt/abstract?article+bn01913032013
Resumo: A composição da dieta de lagartos de uma determinada espécie pode variar entre diferentes populações. A ecologia alimentar do lagarto tropidurídeo Tropidurus torquatus foi estudada em 10 áreas da costa do Brasil a fim de detectar em que extensão a dieta varia ao longo de sua distribuição geográfica. Uma técnica de escalonamento multidimensional não-métrico revelou três grupos de localidades de acordo com a composição da dieta: um caracterizado por um relativamente alto consumo de Isoptera, um caracterizado pela relativamente alta proporção de material vegetal, e um em que houve uma grande importância de Formicidae. Nós encontramos um fraco padrão de diferença latitudinal nas restingas em relação ao consumo geral de itens por T. torquatus, provavelmente porque este é um lagarto generalista e oportunista, que consome a maioria dos tipos disponíveis de potenciais itens alimentares no habitat. No entanto, os lagartos das populações mais ao norte consumiram uma maior quantidade de menores itens (e.g., Isoptera) do que aqueles das populações mais ao sul. Nas populações mais ao sul, por outro lado, items maiores como Coleoptera, Lepdoptera, larvas e frutos foram mais frequentemente consumidos. É provável que a variação interpopulacional observada em alguns aspectos da ecologia alimentar de T. torquatus costeiros seja ocasionada principalmente pela disponibilidade de alimento.
94
Siqueira, C.C. et al.
http://www.biotaneotropica.org.br http://www.biotaneotropica.org.br/v13n3/en/abstract?article+bn01913032013 Biota Neotrop., vol. 13, no. 3
Brazil to northern Argentina (Frost et al. 2001). Along the eastern Brazilian coast these lizards occur in sandy coastal habitats from the south of Bahia state to Rio de Janeiro state, along approximately 1500 km. For this lizard species there is evidence of interpopulation differences, apparently related to differences in the local environment, in some ecological aspects such as mean activity body temperatures (Kiefer et al. 2005), thermoregulatory behavior (Kiefer et al. 2007), mean clutch and egg size (Kiefer et al. 2008), mean diversity of gut nematodes (Kiefer 2003), and proportion of plant material consumed (Siqueira et al. 2011).
Restinga habitats tend to differ across areas as a result of the historical and ecological processes that originated them (Suguio & Tessler 1984). Because of this, we expected that food resources may also change among restinga habitats and the prey consumed by T. torquatus (a generalist, opportunistic forager; Fialho et al. 2000) would change accordingly. If such changes in diet occur we could assume that local availability of prey is the most important determinant of the species diet. If not, historical factors (genetic) could better explain the food items consumed by the lizards. Therefore, we compared the diet of T. torquatus from 10 populations along its distribution in Brazilian coastal areas to investigate the extent to which diet composition differs among populations.
Material and Methods
1. Study areas
The study was carried out in 10 areas of ‘restinga’ habitat of the Brazilian eastern coast (Figure 1). Two localities were in Bahia state: Trancoso (16° 39’ S and 39° 05’ W) and Prado (17° 18’ S and 39° 13’ W), three in Espírito Santo state: Guriri (18° 41’ S and 39° 45’ W), Setiba (20° 35’ S and 40° 27’ W) and Praia das Neves (21°
Introduction
Different populations of a given species can exhibit similar morphological and/or ecological characteristics independently of the variation in the environmental parameters of the localities where they occur (e.g. Niewiarowski 1994, Mesquita & Colli 2003a, b). On the other hand, some lizard species have interpopulational variation in some life history characteristics that can be attributed to genetic differentiation or to local environmental variation along their geographic distribution (e.g. Ballinger 1983, Niewiarowski 1994). Environmental characteristics (e.g. habitat availability for shelter, thermoregulation and reproduction) and local climatic conditions can influence ecological parameters of lizard populations, resulting in differences among populations of a given species (e.g. Pianka 1970, Vitt & Colli 1994, Kiefer et al. 2005, 2007). For example, the diet of a lizard can vary among different populations in relation to prey type, number and size (e.g. Parker & Pianka 1975, Vitt & Colli 1994, Vitt et al. 1998). In Brazil, the teiid Ameiva ameiva eats the same general types of prey, and geographic or temporal differences in its diet results from variation in the availability of those general prey categories (Vitt & Colli 1994). In the teiid Aspidoscelis tigris (= Cnemidophorus tigris; Pianka 1970) and the phrynosomatid Uta stansburiana (Parker & Pianka 1975), a latitudinal gradient in diet was reported, with populations at the southern limits of their distribution usually consuming more Isoptera.
Studies of intraspecific geographical variation have played an important role in identifying the potential ecological sources of variation, and in providing hypotheses concerning the evolution of life histories (Niewiarowski 1994). Thus, to understand how ecological or evolutionary (genetic) factors may affect life history traits in lizards large data sets are needed. The tropidurid lizard Tropidurus torquatus is widely distributed in South America, from central
95
Variation in the diet of the lizard Tropidurus torquatus
http://www.biotaneotropica.org.br/v13n3/en/abstract?article+bn01913032013 http://www.biotaneotropica.org.br Biota Neotrop., vol. 13, no. 3
15’ S and 40° 58’ W), and the remaining five areas were located in Rio de Janeiro state: Grussaí (21° 44’ S and 41° 02’ W), Jurubatiba (22° 17’ S and 41° 41’ W), Massambaba (22° 56’ S and 42° 12’ W), Barra de Maricá (22° 57’ S and 42° 50’ W) and Grumari (23° 05’ S and 43° 30’ W). These localities comprise a representative sample of the distribution of T. torquatus in coastal areas.
Restingas are Quaternary habitats characterized by sandy soils with high salt concentration and a predominance of herbaceous and shrubby vegetation (Suguio & Tessler1984). They occur along most of the Brazilian coast and are part of the Atlantic Forest Biome (Suguio & Tessler 1984). In general, restingas have a rainy season from December to March and a dry season from May to September (Nimer 1979). Mean annual temperatures average 23ºC and mean annual rainfall ranges from 1000 to 1350 mm (Nimer 1979).
2. Methodology and analyzes
Lizards were collected during the same wet season (spring-summer), from November 1999 to March 2000, to factor out possible effects due to seasonality. Each restinga was sampled once, during 3-4 days and lizards were captured with pellet rifles, rubber bands or nooses; the specimens that were caught alive were killed with ether. The snout-vent length (SVL) and the jaw width (JW) of lizards were measured with a digital caliper (General®, USA, New York; precision of 0.1 mm). After all measurements were taken, lizards were fixed in 10% formalin in the field, and later preserved in 70% alcohol. Lizards were dissected and their gonads were examined for sex identification.
Diet composition was analyzed in terms of number, volume (mm3) and frequency of occurrence (proportion of stomachs containing a given food category) of items found in the stomachs. Invertebrate preys were identified to Order (except for ants, identified to family) and vertebrates were identified to species. Insects also were categorized as larvae/adult. Plant material found was classified as flowers, fruits, seeds or leaves. Unidentified arthropod remains (URA) were considered only for volumetric analysis. We measured length and width of each prey item with a digital caliper (precision of 0.1 mm) and estimated the volume (in mm3) using the formula for an ellipsoid (Dunham 1983). We measured leaf volume by multiplying their three dimensions (length, width and depth) (Schoener 1967). An Index of Relative Importance (Ix, presented in %) of each prey type in the diet of each population was estimated by the sum of the percentages of number (%N), volume (%V) and frequency of occurrence (%F) divided by three (Howard et al. 1999).
At each restinga, potential T. torquatus prey was sampled to evaluate the relationship between prey consumption by lizards and prey availability in the environment. At each locality we put 30 plastic vials (300 ml) containing water and liquid soap, buried on the ground along a 150 m transect. We set two traps in 15 points distant 10 m from each other, one trap at each side of the transect. The traps remained open for eight hours per day, for one or two days in each area, depending on the climatic conditions (when it rained, the traps were removed). All invertebrates sampled were fixed in 70% alcohol, identified and counted.
For statistical analysis, volume values were transformed in log. To compare the diet composition between sexes, we correlated the diet of males and females in terms of numeric proportion of items consumed by each sex using Spearman Rank Correlation (Zar 1999). To test if there were local differences between sexes in number and in volume of largest food items per stomach, we performed an Analysis of Variance (ANOVA) (Zar 1999). To summarize the differences in the diet among populations, food items consumed by T. torquatus in each restinga were examined using non-metric multidimensional scaling (NMDS) technique, based on a Bray-Curtis similarity matrix (McCune & Grace 2002). The index of similarity was calculated
based on the Ix value because, as it combines %N, %V and %F for each food item, it provides more complete information about the diet of the lizards. For this analysis, we only considered those food items with Ix > 5% of the diet in at least one population. This ordination technique compares mean rank of dissimilarities of samples within and among groups and does not make the assumption that data are normally distributed or that variances or covariances are equal (McCune & Grace 2002). The final stress coefficient provides a measure of goodness-of-fit of the regression; stress values larger than 0.20 cannot be interpreted reliably.
For each population we calculated the numeric proportions of each prey category for pooled stomachs and for individual lizards. From these proportions, we calculated niche breadths (B = 1/Σ pi2) for pooled stomachs and for each individual, using the inverse of Simpson’s diversity index (Simpson 1949). Because not all food categories were represented in each population studied, we adjusted niche breadths by dividing each value (B) by its corresponding number of food categories. We compared the niche breadths among populations through Analyses of Variance (ANOVA) followed by Scheffé post-hoc test (Zar 1999). We also calculated the niche overlap in diet composition using the equation Φj = Σn=1PijPik / √Σ
n i=1 Pij2 P
ik
2 (Pianka 1973), where P represents the proportion of the food
category, and j and k represent the pair of populations compared. We related the niche overlap values (arcsine transformed) between pairs of populations and the distance (in km) between the respective localities using Regression Analysis (Zar 1999).
The number and the volume of the largest item consumed by lizards were compared among all T. torquatus populations through ANOVA, and a Scheffé post-hoc test (Zar 1999). To evaluate whether lizard body size and jaw width influence the number and volume of largest food items ingested, we performed Simple Regression Analysis between the number of food items per stomach and the snout-vent length (SVL) of lizards and between the volume of the largest item per stomach and lizard jaw width (JW) for each population (Zar 1999). The same analysis was done to evaluate in which extent the variation in the mean number of food item and in the mean volume of largest food item is explained by the mean body size and mean lizard jaw width, respectively, along the coastal T. torquatus populations (Zar 1999). Spearman Rank Correlation was used to test the relationship among the numeric proportion of food items (excluding plant material) consumed by T. torquatus and the numeric proportion of available prey in the habitat (Zar 1999). We used significance level of 0.05. All statistical analyses were performed in SYSTAT 11 software. Descriptive statistics are represented in the text as mean ± 1 SD.
Results
We analyzed 601 individuals of Tropidurus torquatus, varying from 23 in Grumari to 105 in Prado (Tables 1, 2). Almost all lizards had some food in their stomachs, except for eight (1.3% of the total sample): one from Prado (0.9% of the population sample), four from Setiba (4%), one from Massambaba (1.7%), one from Maricá (2.7%) and one from Grumari (4.2%).
96
Siqueira, C.C. et al.
http://www
.biotaneotropica.or
g.br http://www
.biotaneotropica.or
g.br/v13n3/en/abstract?article+bn01913032013
Biota Neotr
op.,
vol. 13, no. 3
Table 1. Percentages of the number (%N), volume (%V), frequency of occurrence (%F) and Importance Index (Ix) of each food item in the diet of the lizard Tropidurus torquatus in Brazilian coastal populations:
Trancoso (N = 89), Prado (N = 105), Guriri (N = 26), Setiba (N = 97) and Praia das Neves (N = 74). URA means unidentified arthropod remains. In the first column, L. and A. mean, respectively, larvae and
adults.*Tropidurus torquatus.
Item/Areas Trancoso Prado Guriri Setiba Praia das Neves
%N %V %F Ix %N %V %F Ix %N %V %F Ix %N %V %F Ix %N %V %F Ix
GASTROPODA 0.2 0.7 9.0 3.3 0.1 0.1 6.7 2.3 0.1 0.1 3.1 1.1 0.1 0.02 2.7 1.0
ARACHNIDA
Araneae 1.0 1.8 29.2 10.7 0.3 0.6 18.1 6.3 0.4 0.5 11.5 4.1 1.5 2.4 41.2 15.0 1.6 1.6 27.0 10.1
Acari 0.1 0.002 2.2 0.8 0.2 0.02 4.8 1.7 0.1 0.001 3.8 1.3 0.1 0.002 2.1 0.7
Pseudoscorpiones 0.1 0.01 2.7 1.0
MALACOSTRACA
Isopoda 0.03 0.01 1.1 0.4 0.4 0.4 6.8 2.5
DIPLOPODA 0.1 0.3 3.4 1.3 0.01 0.01 1.0 0.3 0.1 0.3 3.8 1.4 0.03 0.1 1.0 0.4 0.2 0.1 4.1 1.5
CHILOPODA 0.1 1.8 4.5 2.1 0.3 0.4 11.5 4.1 0.1 0.05 4.1 1.4
HEXAPODA
Odonata L. 0.01 0.1 1.0 0.3
Odonata A. 0.03 0.2 1.1 0.5 0.1 5.5 4.1 3.2
Orthoptera 0.1 3.0 3.4 2.2 0.1 2.7 5.7 2.8 0.1 0.6 7.7 2.8 0.2 5.6 6.2 4.0 0.3 5.4 5.4 3.7
Embiidina 0.03 0.002 1.1 0.4
Isoptera 36.0 36.8 59.6 44.1 73.5 40.4 73.3 62.4 0.4 7.5 42.3 30.1 65.3 30.6 55.7 50.5 34.8 6.8 39.2 26.9
Blattodea 0.3 2.5 11.2 4.7 0.1 1.4 5.7 2.4
Hemiptera 0.3 0.3 9.0 3.2 0.1 0.7 9.5 3.4 0.5 1.7 19.2 7.2 0.2 0.6 9.3 3.4 0.6 2.7 10.8 4.7
Homoptera 2.5 1.2 16.9 6.9 0.1 0.2 3.8 1.4 0.3 8.8 15.4 8.1 0.7 2.1 24.7 9.2 0.7 0.7 8.1 3.2
Coleoptera L. 6.1 2.6 9.0 5.9 0.1 0.2 4.8 1.7 0.1 0.8 3.1 1.3 0.9 0.5 6.8 2.7
Coleoptera A. 2.2 4.8 41.6 16.2 0.4 1.0 18.1 6.5 3.3 22.8 73.1 33.0 1.7 5.6 42.3 16.5 4.5 22.9 48.6 25.4
Neuroptera L. 0.1 0.1 1.1 0.4 0.03 0.4 1.0 0.5
Neuroptera A. 0.03 0.01 1.1 0.4
Hymenoptera
Formicidae 46.7 9.7 97.8 51.4 23.0 33.8 97.1 51.3 47.1 11.9 100 53.0 25.6 19.8 94.8 46.8 53.2 52.3 95.9 67.3
Others 1.3 8.5 30.3 13.4 0.6 4.7 20.0 8.4 2.6 7.5 42.3 17.5 1.1 5.3 30.9 12.5 0.9 3.0 13.5 5.8
Lepidoptera L. 1.9 14.5 40.4 19.0 0.6 2.6 27.6 10.3 1.0 4.9 30.8 12.2 1.2 15.1 36.1 17.5 0.7 0.4 10.8 4.0
Lepidoptera A. 0.1 0.1 3.4 1.2 0.1 0.1 3.8 1.3 0.1 0.04 3.8 1.3 0.2 0.9 8.2 3.1 0.1 0.1 2.7 1.0
Diptera L. 0.1 0.3 1.0 0.4 0.1 0.02 3.8 1.3
Diptera A. 0.4 0.03 9.0 3.1 0.2 2.7 13.3 5.4 0.2 3.6 7.7 3.9 0.8 1.2 9.3 3.8 0.3 0.1 5.4 1.9
Pupae 0.4 0.5 4.1 1.6
URA 1.0 0.5 3.8 0.5 0.2
VERTEBRATES
T. torquatus* 0.1 6.0 3.8 3.3
Plant material
Flowers 0.1 0.8 2.2 1.0 0.1 1.4 4.8 2.1 0.7 1.6 30.8 11.8 0.2 2.4 5.2 2.6 0.1 1.2 2.7 1.4
Fruits 0.3 7.2 9.0 5.5 0.2 6.4 7.6 4.7 0.4 15.4 23.1 8.4 0.1 0.5 4.1 1.6
Seeds 1.6 0.3 3.8 6.9 0.6 0.1 3.1 1.3
Leaves 0.1 0.02 4.8 1.6 0.7 0.04 11.5 4.2 0.1 0.003 1.0 0.4
Remains 2.1 9.0 0.3 3.8 2.3 26.9 0.3 6.2 0.9 1.4
97
V
ariation in the diet of the lizard
T
ropidurus tor
quatus
http://www
.biotaneotropica.or
g.br/v13n3/en/abstract?article+bn01913032013
http://www
.biotaneotropica.or
g.br
Biota Neotr
op.,
vol. 13, no. 3
Table 2. Percentages of the number (%N), volume (%V), frequency of occurrence (%F) and Importance Index (Ix) of each food item in the diet of the lizard Tropidurus torquatus in Brazilian coastal populations: Grussaí
(N = 30), Jurubatiba (N = 55), Massambaba (N = 58), Barra de Maricá (N = 36) and Grumari (N = 23). URA means unidentified arthropod remains. In the first column, L. and A. mean, respectively, larvae and adults.
Item/Areas Grussaí Jurubatiba Massambaba Maricá Grumari
%N %V %F Ix %N %V %F Ix %N %V %F Ix %N %V %F Ix %N %V %F Ix
GASTROPODA 0.2 0.03 6.7 2.3
ARACHNIDA
Araneae 0.4 0.2 10.0 3.5 3.0 4.2 45.5 17.6 2.5 2.7 31.0 12.1 2.5 1.9 33.3 12.6 1.9 0.5 21.7 8.0
Acari 0.1 0.001 1.8 0.6 0.3 0.01 2.8 1.0 0.3 0.1 4.3 1.6
Pseudoscorpiones 0.2 0.02 1.8 0.7 0.1 0.004 1.7 0.6
MALACOSTRACA
DIPLOPODA 0.1 0.01 1.8 0.6 0.1 0.01 1.7 0.6 0.1 0.1 2.8 1.0
CHILOPODA 0.4 0.1 10.0 3.5 0.2 0.4 3.4 1.3 0.6 5.1 11.1 5.6 0.8 0.9 8.7 3.5
HEXAPODA
Odonata A. 0.6 6.2 16.4 7.8 0.3 0.9 5.6 2.2
Orthoptera 0.7 1.5 16.7 6.3 0.4 3.2 9.1 4.2 0.3 1.6 5.2 2.4 0.4 3.0 8.3 3.9 1.6 10.8 26.1 12.8
Embiidina 0.1 0.02 1.8 0.6
Isoptera 12.3 2.6 33.3 16.1 37.5 4.0 16.4 19.3 13.8 1.7 27.6 14.4 18.7 1.0 19.4 13.1 19.2 0.6 26.1 15.3
Mantodea 0.2 0.6 5.5 2.1 0.5 2.9 4.3 2.6
Blattodea 1.1 2.4 7.3 3.6 0.6 6.6 6.9 4.7 0.3 0.3 5.6 2.0 0.3 0.8 4.3 1.8
Hemiptera 0.6 1.0 16.7 6.1 1.2 1.4 9.1 3.9 0.7 1.1 12.1 4.6 0.4 3.8 8.3 4.2 0.8 1.6 8.7 3.7
Homoptera 1.6 3.6 30.9 12.0 1.3 5.2 20.7 9.1 1.0 2.1 19.4 7.5 0.8 0.1 13.0 4.6
Coleoptera L. 0.1 0.02 3.3 1.2 0.1 0.1 1.8 0.6 1.4 0.2 8.6 3.4 0.1 0.05 2.8 1.0 0.8 0.6 13.0 4.8
Coleoptera A. 2.8 9.2 53.3 21.8 4.8 5.8 56.4 22.3 3.7 18.1 34.5 18.8 2.0 1.3 30.6 11.3 6.1 14.2 65.2 28.5
Neuroptera L. 1.9 6.9 17.4 8.7
Hymenoptera
Formicidae 80.0 76.3 96.7 84.3 32.9 7.5 89.1 43.2 63.6 12.6 96.6 57.6 53.1 10.4 88.9 50.8 52.8 18.1 100.0 57.0
Others 0.1 0.01 3.3 1.2 1.9 6.9 27.3 12.0 2.3 4.7 32.8 13.2 3.3 2.2 33.3 13.0 2.9 10.5 34.8 16.1
Lepidoptera L. 0.7 0.6 13.3 4.9 5.5 12.9 52.7 23.7 2.5 2.5 29.3 11.4 1.3 1.4 19.4 7.4 4.3 16.5 43.5 21.4
Lepidoptera A. 0.2 0.001 6.7 2.3 0.4 0.6 9.1 3.4 0.4 0.8 6.9 2.7 0.1 0.2 2.8 1.0 0.3 0.8 4.3 1.8
Diptera L. 0.1 0.05 2.8 1.0 1.1 0.02 4.3 1.8
Diptera A. 0.1 0.001 3.3 1.2 0.5 0.02 10.9 3.8 0.4 0.1 8.6 3.0 1.0 0.6 19.4 7.0 3.2 9.4 13.0 8.5
Pupae 0.2 0.2 3.6 1.3 0.6 0.4 1.7 0.9
URA 0.3 0.6 3.4 1.6 1.8
VERTEBRATES
Cnemidophorus litoralis 0.1 1.1 2.8 1.3
Mabuya macrorhyncha (tail) 0.1 3.1 3.6 2.3
Scinax cuspidatus 0.1 4.9 2.8 2.6
Plant material
Flowers 1.0 6.7 20.0 7.1 3.8 16.8 43.6 21.4 1.1 6.1 17.2 8.2 0.9 0.5 13.9 5.1 0.3 1.8 4.3 2.1
Fruits 0.2 0.9 6.7 2.4 2.6 16.5 23.6 14.2 3.2 22.9 34.5 20.2 12.5 56.7 63.9 44.3 0.3 0.9 4.3 1.8
Seeds 0.1 0.2 3.3 3.4 0.9 3.2 9.1 4.4 1.2 5.5 8.6 5.1 0.4 0.9 8.3 3.2
Leaves 0.4 0.1 5.5 2.0
Remains 0.2 10.0 0.1 10.9 3.4 10.3 0.1 4.3
98
Siqueira, C.C. et al.
http://www.biotaneotropica.org.br http://www.biotaneotropica.org.br/v13n3/en/abstract?article+bn01913032013 Biota Neotrop., vol. 13, no. 3
most frequent item in the diet of overall populations and the main prey (Ix) in the diet of most populations (Tables 1, 2). In three restinga areas, adult males T. torquatus consumed vertebrates (juvenile lizards of three species and an adult female treefrog) (Tables 1, 2). Because we found a significant association between males and females in diet composition (except for Grussaí, P > 0.05), and we found a lack of differences in mean volume (except for Guriri, P < 0.05) and mean number of food items, we analyzed both sexes pooled.
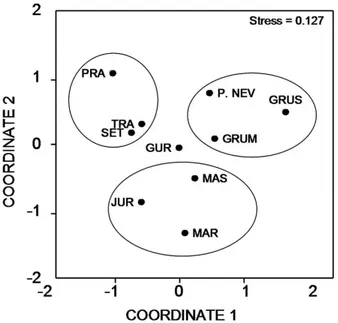
The NMDS revealed a particular pattern in the diet in relation to the Index of Importance (Ix) among populations of T. torquatus (Figure 2) and yielded a stress coefficient of 0.127, indicating that the ordination plot could be reliably interpreted. Restingas of Trancoso, Prado and Setiba clustered in one simple group. Populations of Jurubatiba, Massambaba and Maricá formed another group while Praia das Neves, Grussaí and Grumari also tended to cluster together (Figure 2).
We found the highest value of niche breadth for pooled stomachs in Guriri (Table 3). We found a significant difference (F9,572 = 7.115; P < 0.001) in the niche breadth of the individuals among populations of T. torquatus (Table 3), but differences were detected among the
population of Trancoso and Jurubatiba and Massambaba, among Grumari and Trancoso, Prado and Setiba, and between Prado and Massambaba (P < 0.05). We did not find a significant relationship in niche overlap values between pairs of populations (Table 4) and distance between the respective localities (R2 = 0.03; F
1,43 = 1.34; P = 0.25).
The mean number of items per stomach varied significantly (F9,580 = 14.20; P < 0.01) among populations (Table 5). The differences occurred mainly between Praia das Neves and those populations to the north, and between Prado and some southern populations (Table 6). Mean volume of the largest items per stomach consumed by T. torquatus also varied significantly (F9,577 = 7.55; P < 0.01) among populations (Table 5). The differences occurred between Jurubatiba and northern populations (Table 6). In general, lizards from the northern populations (states of Bahia and Espírito Santo) consumed more items than those from the southern ones (state of Rio de Janeiro). In contrast, the mean volume of the consumed food items was generally smaller in the northern populations when compared to those of the south (Table 5).
The mean number of items per stomach was not significantly related to lizard SVL in most populations (P > 0.05), except Praia das Neves (R2 = 0.08; F
1,69 = 6.40; P < 0.05) and Massambaba (R 2 = 0.08;
F1,51 = 4.68; P < 0.05). Mean volume of the largest item per stomach consumed by lizards was significantly related to lizard JW in all populations (Regression Analysis, P < 0.01). The mean number of food items and the mean volume of the largest items per stomach were not significantly related, respectively, to mean SVL (R2 = 0.03; F1,8 = 0.26; P = 0.63) and mean JW (R2 = 0.33; F
1,8 = 3.95; P = 0.08; Figure 3) of the lizards.
Figure 2. Non-metric multidimensional scaling (NMDS) ordination of the diet of the lizard Tropidurus torquatus based on Bray-Curtis similarity matrix constructed on the Index of Importance (Ix) of diet. Points in the graph correspond to the 10 studied areas in Brazil: Trancoso, Prado, Guriri, Setiba, Praia das Neves, Grussaí, Jurubatiba, Massambaba, Maricá and Grumari.
Table 3. Standard numeric niche breadths (B) for pooled stomachs and mean niche breadth ± standard deviation for individual stomachs of the lizard
Tropidurus torquatus in 10 Brazilian coastal populations.
Area B
(pooled stomachs)
B
(individual stomachs)
Trancoso 0.12 0.08 ± 0.04
Prado 0.08 0.08 ± 0.04
Setiba 0.09 0.09 ± 0.04
Guriri 0.22 0.09 ± 0.04
P. Neves 0.14 0.10 ± 0.04
Grussaí 0.10 0.10 ± 0.04
Jurubatiba 0.15 0.11 ± 0.05
Massambaba 0.12 0.11 ± 0.05
Maricá 0.14 0.11 ± 0.05
Grumari 0.15 0.13 ± 0.07
Table 4. Niche overlap values between pairs of populations of the lizard Tropidurus torquatus in 10 Brazilian coastal populations.
Areas Trancoso Prado Guriri Setiba P. Neves Grussaí Jurubatiba Massambaba Maricá Grumari
Trancoso 0.81 0.99 0.85 0.99 0.87 0.97 0.90 0.92 0.94
Prado 0.85 0.997 0.77 0.44 0.90 0.49 0.58 0.60
Guriri 0.88 0.99 0.85 0.98 0.88 0.91 0.93
Setiba 0.81 0.50 0.93 0.55 0.64 0.66
P. Neves 0.90 0.95 0.93 0.95 0.97
Grussaí 0.76 0.99 0.96 0.97
Jurubatiba 0.80 0.86 0.87
Massambaba 0.98 0.98
Maricá 0.97
99
Variation in the diet of the lizard Tropidurus torquatus
http://www.biotaneotropica.org.br/v13n3/en/abstract?article+bn01913032013 http://www.biotaneotropica.org.br Biota Neotrop., vol. 13, no. 3
There was no significant relationship between diet composition of T. torquatus and food availability in the habitat, except for Maricá population (rs = 0.63; N = 21; P < 0.01).
Discussion
Diet composition of Tropidurus torquatus of the coastal populations studied was, in general, composed mainly by arthropods, but included high counts of plant material (see Siqueira et al. 2011). This result is similar to those reported for other T. torquatus populations (e.g. Alvarez et al. 1985, Fialho et al. 2000, Rocha et al. 2002, Dutra et al. 2011) and also for various congeneric species (e.g. Vitt 1991, Colli et al. 1992, Van Sluys 1993, Mesquita et al. 2006, Rocha & Siqueira 2008). We recorded a differential consumption of plant material (mainly fruits and flowers) by the lizards in three localities (Maricá, Massambaba and Jurubatiba). Fialho et al. (2000) also found a great volume of fruits in the diet of T. torquatus in Maricá, consumed mainly by adult lizards. In this study, however, we cannot attribute the differences in plant consumption among populations to the presence of juvenile lizards in the samples. Smaller volumes of plant material consumed by lizards were recorded in Praia das Neves and Setiba, for which samples had 10% and 18% of juveniles, respectively; whereas lizards from Maricá and Massambaba consumed the highest volumes of plant material and had similar or higher proportions of juveniles in the samples (20 and 44%, respectively).
The NMDS tended to form three groups of localities. In Trancoso, Prado and Setiba, lizards consumed a relatively higher amount of Isoptera that probably contributed to their clustering in the analysis.
Another group, formed by populations of Jurubatiba, Massambaba and Maricá, was characterized by a relatively high proportion of plant matter in the diet compared to the other populations. We can attribute the clustering of the third group (formed by Praia das Neves, Grussaí and Grumari) to the great importance of Formicidae in the diet of these populations.
We did not find a clear pattern of latitudinal difference in restingas regarding the general consumption of items by T. torquatus, probably because this is a generalist and opportunistic lizard, that consumes most of the available types of prey items in the habitat (Fialho et al. 2000). However, lizards consumed Isoptera in large proportions (> 30% in volume) in three areas (Trancoso, Setiba and Prado) located to the central-northern portion of the species’ range along the coast. Isoptera has already been found in relatively high frequencies in previous studies about feeding habits of T. torquatus (e.g. Fialho et al. 2000) and constitute a food item with a great relative amount of water, which can contribute to the water balance of these lizards (Nagy et al. 1984). Although there was an apparent tendency of larger consumption of Isoptera by individuals from northern populations, the reasons for this are still unclear and deserve further investigation. Possibly, colonies of Isoptera are more abundant in the northern restingas than in the southern ones. Variation among populations in the consumption of Isoptera has also been recorded for
Table 5. Mean ± standard deviation of the number (N) and largest volume per stomach (V, in mm3), and amplitude (in parenthesis) of food item ingested by
the lizard Tropidurus torquatus in 10 Brazilian coastal populations.
Areas N V (mm3)
Trancoso 40.8 ± 35.2 (2-190) 78.8 ± 125.4 (0.3-805.4) Prado 63.7 ± 63.4 (3-258) 97.8 ± 133.2 (0.9-815.2) Guriri 52.5 ± 67.0 (8-347) 244.3 ± 280.7 (0.8-886.2) Setiba 41.5 ± 51.6 (2-284) 125.5 ± 358.4 (1.0-3248.4) Praia das Neves 17.5 ± 22.4 (1-155) 102.4 ± 201.5 (0.5-1191.4) Grussaí 28.6 ± 20.5 (2-76) 109.7 ± 113.4 (11.9-457.4) Jurubatiba 25.7 ± 46.3 (4-337) 246.7 ± 303.5 (4.8-1833.9) Massambaba 19.3 ± 16.1 (1-83) 130.4 ± 146.6 (3.1-697.1) Maricá 19.2 ± 18.5 (1-77) 202.9 ± 219.5 (1.0-1089.3) Grumari 16.3 ± 11.4 (3-56) 218.7 ± 233.7 (1.3-870.9)
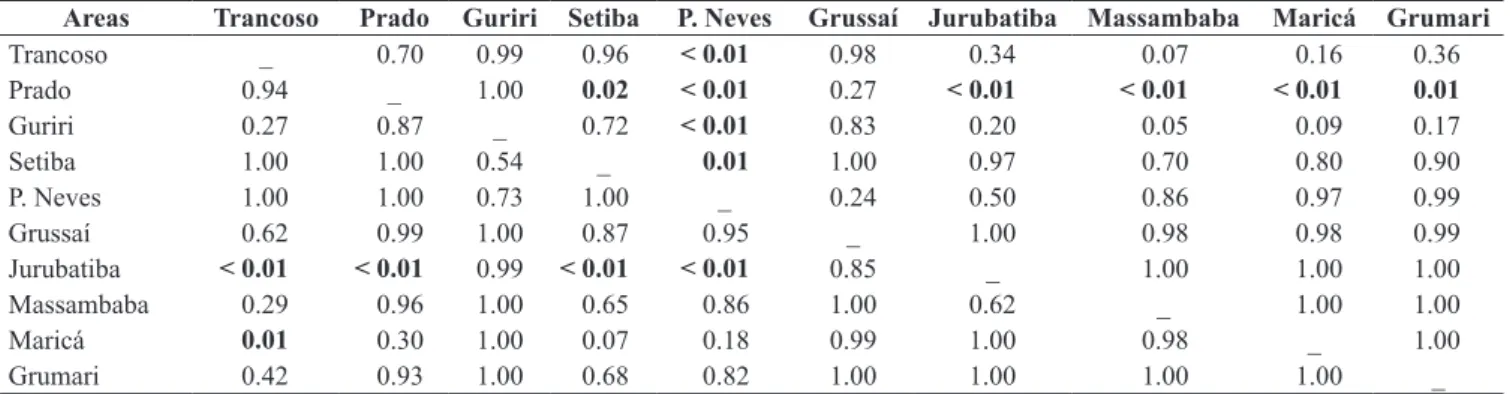
Table 6. Results of Scheffé Post-hoc test (probability values, p) for statistical analyzes of differences in number (above diagonal) and largest volume (V, in mm3) (below diagonal) of food item consumed by the lizard Tropidurus torquatus in 10 Brazilian populations.
Areas Trancoso Prado Guriri Setiba P. Neves Grussaí Jurubatiba Massambaba Maricá Grumari
Trancoso _ 0.70 0.99 0.96 < 0.01 0.98 0.34 0.07 0.16 0.36
Prado 0.94 _ 1.00 0.02 < 0.01 0.27 < 0.01 < 0.01 < 0.01 0.01
Guriri 0.27 0.87 _ 0.72 < 0.01 0.83 0.20 0.05 0.09 0.17
Setiba 1.00 1.00 0.54 _ 0.01 1.00 0.97 0.70 0.80 0.90
P. Neves 1.00 1.00 0.73 1.00 _ 0.24 0.50 0.86 0.97 0.99
Grussaí 0.62 0.99 1.00 0.87 0.95 _ 1.00 0.98 0.98 0.99
Jurubatiba < 0.01 < 0.01 0.99 < 0.01 < 0.01 0.85 _ 1.00 1.00 1.00
Massambaba 0.29 0.96 1.00 0.65 0.86 1.00 0.62 _ 1.00 1.00
Maricá 0.01 0.30 1.00 0.07 0.18 0.99 1.00 0.98 _ 1.00
Grumari 0.42 0.93 1.00 0.68 0.82 1.00 1.00 1.00 1.00 _
Figure 3. Relationship between mean volume (in mm3) of largest food item
100
Siqueira, C.C. et al.
http://www.biotaneotropica.org.br http://www.biotaneotropica.org.br/v13n3/en/abstract?article+bn01913032013 Biota Neotrop., vol. 13, no. 3
the teiid lizard Cnemidophorus ocellifer (an active forager that feeds on clumped prey) and was attributed to geographical distribution in the availability of this item in the Central Brazilian Cerrado (Mesquita & Colli 2003b). In the teiid Aspidoscelis tigris (Pianka 1970) and the phrynosomatid Uta stansburiana (Parker & Pianka 1975) a latitudinal variation was observed in diet composition along their range, with individuals from the southernmost populations ingesting Isoptera in higher numbers than the northernmost ones, probably as result of the differences in food availability among localities.
The number and the mean volume of food items in the stomachs of T. torquatus varied considerably among the coastal populations. In general, lizards from northern populations consumed more and smaller items than those from southern populations, probably as a number/volume trade off that leads to an evenly energetically balanced diet. These geographic differences probably result from the greater ingestion of small items, such as Isoptera, by individuals of the northern populations. In the southern populations, on the other hand, larger items such as Coleoptera, Lepidoptera larvae and fruits were more frequently consumed. Due to the relatively larger size of these items, it is expected that they will be consumed. However, if large food items are energetically advantageous, the abundant, small and spatially clumped ones, such as Formicidae and Isoptera, also favor a positive energy balance due to the low energy costs associated to their location, capture and ingestion (Schoener 1971). We recorded that lizards from southern populations had broader niches than those from northern populations indicating that they are consuming a wider variety of food types.
In each population studied, lizard mouth size influenced the largest volume of items consumed, indicating that adult T. torquatus consumed larger prey than did juveniles. In order to be advantageous for a lizard, a prey must contain more energy than is spent with its capture and ingestion (Schoener 1971). Thus, the consumption of large prey by adult lizards is not only feasible but also advantageous in terms of energy gain, although some large lizards may also consume small, abundant available preys in the habitat due to the low energy costs associated to their capture and ingestion (e.g. De Marco et al. 1985, Van Sluys 1993). Despite the lack of a significant result between mean volume of the largest food item and the mean lizard jaw width along the coastal populations, there was a tendency of populations with a small mean jaw width to have preys with lower mean volumes when compared to populations with lizards with wider jaws (see Figure 3).
We did not find a significant relationship between prey consumption by lizards and the availability of arthropods. This can be partially explained by two reasons. First, small arthropods such as Collembola and Acari were numerous in the samplings, but little consumed by lizards. Second, some sedentary prey may not be properly sampled in the traps used, either due to their restricted displacement abilities (larvae) or their behavior of aggregation in colonies (Isoptera), whereas the lizards may consume them in relatively large proportions. For example, coleopteran larvae are dug out by lizards, but they will barely be captured by traps.
Changes in environment temperatures influence the occurrence of geographical variation among populations of Tropidurus torquatus both in body temperature (Kiefer et al. 2005) and in their thermoregulatory behavior (Kiefer et al. 2007). At lower taxonomic level (e.g. species), adaptations to local environmental factors can play a major role in determining life-history traits of neotropical lizards (Colli 1991). Tropidurids from neotropical savannas were more affected by ecological factors than other lineages (Mesquita et al. 2007), at least on diet composition, thus stressing the importance of local conditions in determining dietary patterns. We believe that the observed interpopulational variation in some aspects of the feeding
ecology of coastal T. torquatus (including plant consumption; Siqueira et al. 2011) results from local environmental factors, mainly the availability of food items.
Acknowledgements
This study is part of the “Programa de Ecologia, Conservação e Manejo de Ecossistemas do Sudeste Brasileiro”, of the research project “Ecologia geográfica das espécies de Tropidurus (Squamata: Tropiduridae) do grupo torquatus do leste e centro-oeste do Brasil”, and of the “Southeastern Brazilian Vertebrate Ecology” Project (Laboratory of Vertebrate Ecology), Departamento de Ecologia, Instituto de Biologia, Universidade do Estado do Rio de Janeiro. We thank Davor Vrcibradic, Mônica Cunha-Barros, Conrado A. B. Galdino, Vanderlaine A. Menezes, Angélica F. Fontes, and Fabio H. Hatano for field assistance, Mauricio Almeida-Gomes for help with the map and Míriam Pinto for help with statistical analysis. D. Vrcibradic kindly revised a first draft of the manuscript and offered helpful suggestions. This study was supported by research grants from the Conselho Nacional de Desenvolvimento Científico e Tecnológico (CNPq) to M.C. Kiefer (processes 146442/1999-7 and 150353/2003-0), C.F.D. Rocha (processes 304791/2010-5 and 470265/2010-8), and M. Van Sluys (process 307773/2008-6), and from Fundação de Amparo à Pesquisa do Estado do Rio de Janeiro (FAPERJ) to M.C. Kiefer (process E-26/171.168/2006) and to C.F.D. Rocha through “Cientistas do Nosso Estado” Program (process E-26/102.765/2012). This study was supported partially from the Programa de Pesquisas Ecológicas de Longa Duração (PELD / CNPq - Site 5 Restinga de Jurubatiba) and from the Programa de Pós-Graduação em Ecologia, Instituto de Biologia, Universidade Estadual de Campinas (Unicamp). During this study C.C. Siqueira received a graduate fellowship from FAPERJ. Currently, CCS receives post doctoral (150151/2012-8) grants from CNPq. The permit for collecting the lizards was given by IBAMA (process 2001.03486/99.85).
References
ALVAREZ, B.B., TORALES, G. & TEDESCO, M.E. 1985. Comportamiento alimentario de uma poblacion de Tropidurus torquatus (Iguanidae) del Departamento Capital, Província de Corrientes, Argentina. Hist. Nat. 5:281-288.
BALLINGER, R.E. 1983. Life-history variations. In Lizard Ecology, Studies of a Model Organism (R.B. Huey, E.R. Pianka& T.W. Schoener, eds.). Harvard University Press, Cambridge, p.241-260.
COLLI, G.R. 1991. Reproductive ecology of Ameiva ameiva (Sauria, Teiidae) in the Cerrado of Central Brazil. Copeia 1991(4):1002-1012. http://dx.doi. org/10.2307/1446095
COLLI, G.R., ARAÚJO, A.F.B., SILVEIRA, R. & ROMA, F. 1992. Niche partitioning and morphology of two syntopic Tropidurus (Sauria: Tropiduridae) in Mato Grosso, Brazil. J. Herpetol. 26(1):66-69. http:// dx.doi.org/10.2307/1565023
DE MARCO, V.G., DRENNER, R.W. & FERGUSSON, G.W. 1985. Maximum prey size of an insectivorous lizard, Sceloporus undulatus. Copeia1985(4):1077-1080. http://dx.doi.org/10.2307/1445269
DUNHAM, A.E. 1983. Realized niche overlap, resource abundance, and
intensity of interspecific competition. In Lizard Ecology, Studies of
a Model Organism (R.B. Huey, E.R. Pianka & T.W. Schoener, eds.). Harvard University Press, Cambridge, p.261-280.
DUTRA, G.F., SIQUEIRA, C.C., VRCIBRADIC, D., KIEFER, M.C. & ROCHA, C.F.D. 2011. Plant consumption of insular and mainland populations of a tropical lizard. Herpetologica 67(1):32-45. http://dx.doi. org/10.1655/HERPETOLOGICA-D-09-00009.1
101
Variation in the diet of the lizard Tropidurus torquatus
http://www.biotaneotropica.org.br/v13n3/en/abstract?article+bn01913032013 http://www.biotaneotropica.org.br Biota Neotrop., vol. 13, no. 3
FROST, D.R., RODRIGUES, M.T., GRANT, T. & TITUS, T.A. 2001. Phylogenetics of the lizard genus Tropidurus (Squamata: Tropidurinae), direct optimization, and sensitivity analisis of congruente between molecular data and morphology. Mol. Phyl. Evol. 21(3):352-371. PMid:11741379. http://dx.doi.org/10.1006/mpev.2001.1015
HOWARD, A.K., FORESTER, J.D., RUDER, J.M., PARMERLEE, J.S. & POWELL, R. 1999. Natural history of a terrestrial Hispaniolan anole, Anolis barbouri. J. Herpetol. 33(4):702-706. http://dx.doi. org/10.2307/1565590
KIEFER, M.C. 2003. Ecologia geográfica de Tropidurus torquatus (Squamata:
Tropiduridae) em áreas de restinga da costa sudeste e sul-nordeste do Brasil: aspectos reprodutivos, ecologia térmica e comunidade de nematódeos associados. Tese de doutorado, Universidade Estadual de Campinas, Campinas, 200p.
KIEFER, M.C., VAN SLUYS, M. & ROCHA, C.F.D. 2005. Body temperatures of Tropidurus torquatus (Squamata, Tropiduridae) from coastal populations: Do body temperatures vary along their geographic range? J. Thermal. Biol. 30:449-456. http://dx.doi.org/10.1016/j. jtherbio.2005.05.004
KIEFER, M.C., VAN SLUYS, M. & ROCHA, C.F.D. 2007. Thermoregulatory behaviour in Tropidurus torquatus (Squamata, Tropiduridae) from Brazilian coastal populations: an estimate of passive and active thermo regulation in lizards. Acta Zool. 88:81-87. http://dx.doi.org/10.1111/ j.1463-6395.2007.00254.x
KIEFER, M.C., VAN SLUYS, M. & ROCHA, C.F.D. 2008. Clutch and egg size of the tropical lizard Tropidurus torquatus (Tropiduridae) along its geographic range in coastal eastern Brazil. Can. J. Zool. 86:1376-1388. http://dx.doi.org/10.1139/Z08-106
McCUNE, B. & GRACE, J.B. 2002. Analysis of Ecological Communities. MjM Software Design, Gleneden Beach, 300p.
MESQUITA, D.O. & COLLI, G.R. 2003a.Geographical variation in the ecology of populations of some Brazilian species of Cnemidophorus (Squamata, Teiidae). Copeia 2003(2):285-298. http://dx.doi.org/10.1643/0045-8511(2003)003[0285:GVITEO]2.0.CO;2
MESQUITA, D.O. & COLLI, G.R. 2003b. The ecology of Cnemidophorus ocellifer (Squamata, Teiidae) in a Neotropical savanna. J. Herpetol. 37(3):498-509. http://dx.doi.org/10.1670/179-02A
MESQUITA, D.O., COSTA, G.C. & COLLI, G.R. 2006. Ecology of an Amazonian savanna lizard assemblage in Monte Alegre, Pará State, Brazil. S. Am. J. Herpetol. 1(1):61-71. http://dx.doi.org/10.2994/1808-9798(2006)1[61:EOAASL]2.0.CO;2
MESQUITA, D.O., COLLI, G.R. & VITT, L.J. 2007. Ecological release in lizard assemblages of neotropical savannas. Oecologia 153:185-195. PMid:17437128. http://dx.doi.org/10.1007/s00442-007-0725-z NAGY, K.A., HUEY, R.B. & BENNETT, A.F. 1984. Field energetics and
foraging modes of Kalahari lacertid lizards. Ecology 65(2):588-596. http://dx.doi.org/10.2307/1941421
NIEWIAROWSKI, P.H. 1994. Understanding geographic life-history variation in lizards. In Lizard Ecology, Historical and Experimental Perspectives (L.J. Vitt & E.R. Pianka, eds.). Princeton University Press, Princeton, p.31-49.
NIMER, E. 1979. Climatologia do Brasil. IBGE, Rio de Janeiro, 422 p.
PARKER, W.S. & PIANKA, E.R. 1975. Comparative ecology of populations of the lizard Uta stansburiana. Copeia 1975:615-632. http://dx.doi. org/10.2307/1443314
PIANKA, E.R. 1970. Comparative autecology of the lizard Cnemidophorus tigris in different parts of its geographical range. Ecology 51(4):703-720. http://dx.doi.org/10.2307/1934053
PIANKA, E.R. 1973. The structure of lizard communities. Ann. Rev. Ecol. Syst. 4:53-74. http://dx.doi.org/10.1146/annurev.es.04.110173.000413
ROCHA, C.F.D., DUTRA, G.F., VRCIBRADIC, D.& MENEZES, V.A. 2002. The terrestrial reptile fauna of the Abrolhos Archipelago: species list and ecological aspects. Braz. J. Biol. 62(2):285-291.PMid:12489402. http:// dx.doi.org/10.1590/S1519-69842002000200013
ROCHA, C.F.D. & SIQUEIRA, C.C. 2008. Feeding ecology of the lizard
Tropidurus oreadicus (Tropiduridae) at Serra dos Carajás, Pará state, north Brazil. Braz. J. Biol. 68(1):631-637. http://dx.doi.org/10.1590/ S1519-69842008000100015
SCHOENER, T.W. 1967. The ecological significance of sexual dimorphism
in size in the lizard Anolis conspersus. Science 155:474-477.
PMid:17737565. http://dx.doi.org/10.1126/science.155.3761.474
SCHOENER, T.W. 1971. Theory of feeding strategies. Ann. Rev. Ecol. Syst. 2:369-404. http://dx.doi.org/10.1146/annurev.es.02.110171.002101
SIMPSON, E.H. 1949. Measurement of diversity. Nature 163:688-688. http:// dx.doi.org/10.1038/163688a0
SIQUEIRA, C.C., KIEFER, M.C., VAN SLUYS, M. & ROCHA, C.F.D. 2011. Plant consumption in coastal populations of the lizard Tropidurus torquatus (Reptilia: Squamata: Tropiduridae): how do herbivory rates vary along their geographic range? J. Nat. Hist. 45(3-4):171-182. http:// dx.doi.org/10.1080/00222933.2010.520826
SUGUIO, K. & TESSLER, M.G. 1984. Planícies de cordões litorâneos quaternários do Brasil: origem e nomenclatura. In Restingas, Origem, Estrutura e Processos (L.D. Lacerda, D.S.D. Araújo, R. Cerqueira & B. Turcq, eds.). Centro Editorial da Universidade Federal Fluminense, Niterói, p.15-25.
VAN SLUYS, M. 1993. Food habits of the lizard Tropidurus itambere
(Tropiduridae) in southeastern Brazil. J. Herpetol. 27(3):347-351. http:// dx.doi.org/10.2307/1565162
VITT, L.J. 1991. An introduction to the ecology of Cerrado lizards. J. Herpetol. 25(1):79-90. http://dx.doi.org/10.2307/1564798
VITT, L.J. & COLLI, G.R. 1994. Geographical ecology of a Neotropical lizard: Ameiva ameiva (Teiidae) in Brazil. Can. J. Zool. 72:1986-2008. http://dx.doi.org/10.1139/z94-271
VITT, L.J., ZANI, P.A., AVILA-PIRES, T.C.S. & ESPÓSITO, M.C. 1998.
Geographical ecology of the gymnophthalmid lizard Neusticurus
ecpleopus in the Amazon rain forest. Can. J. Zool. 76:1671-1680.
ZAR, J.H. 1999. Biostatistical Analysis. Prentice-Hall, Upper Saddle River, 622p.