(Cuvier, 1816) in floodplain lakes:
model selection and multimodel inference
Costa, LRF.
a*, Barthem, RB.
a, Albernaz, AL.
b, Bittencourt, MM.
cand Villacorta-Corrêa, MA.
daCoordenação de Zoologia, Museu Paraense Emílio Goeldi – MPEG, CP 399, Terra-Firme, CEP 66077-830, Belém, PA, Brazil
bCoordenação de Ciências da Terra e Ecologia – CCTE, Museu Paraense Emílio Goeldi – MPEG, Terra-Firme, CP 399, CEP 66077-830, Belém, PA, Brazil
cCoordenação de Pesquisas em Biologia Aquática – CPBA, Instituto Nacional de Pesquisas da Amazônia – INPA, CP 478, CEP 69011-970, Manaus, AM, Brazil
dDepartamento de Ciências Pesqueiras, Universidade Federal da Amazônia – UFAM, Av. General Rodrigo Otávio Jordão Ramos, 3000, CEP 69077-000, Manaus, AM, Brazil
*e-mail: [email protected]
Received March 26, 2012 – Accepted July 23, 2012 – Distributed May 31, 2013
(With 2 figures)
Abstract
The tambaqui, Colossoma macropomum, is one of the most commercially valuable Amazonian fish species, and in
the floodplains of the region, they are caught in both rivers and lakes. Most growth studies on this species to date have adjusted only one growth model, the von Bertalanffy, without considering its possible uncertainties. In this study, four different models (von Bertalanffy, Logistic, Gompertz and the general model of Schnüte-Richards) were adjusted to a data set of fish caught within lakes from the middle Solimões River. These models were adjusted by non-linear equations, using the sample size of each age class as its weight. The adjustment evaluation of each model was based
on the Akaike Information Criterion (AIC), the variation of AIC between the models (∆i) and the evidence weights
(wi). Both the Logistic (∆i = 0.0) and Gompertz (∆i = 1.12) models were supported by the data, but neither of them
was clearly superior (wi, respectively 52.44 and 29.95%). Thus, we propose the use of an averaged-model to estimate
the asymptotic length (L∞). The averaged-model, based on Logistic and Gompertz models, resulted in an estimate of
L∞=90.36, indicating that the tambaqui would take approximately 25 years to reach average size.
Keywords: Amazon, Colossoma macropomum, fish growth, model selection, multimodel inference.
Modelagem do crescimento do tambaqui (
Colossoma macropomum
Cuvier, 1816):
seleção de modelos e inferência multimodelos
Resumo
O tambaqui, Colossoma macropomum, é uma das espécies de peixes amazônicos de maior valor comercial, sendo capturado em rios e lagos da planície alagável da região. Até o presente, a maioria dos estudos sobre essa espécie tem ajustado um único modelo de crescimento, o de von Bertalanffy, sem considerer as possíveis incertezas associadas ao uso do modelo. Neste estudo, quatro modelos diferentes (von Bertalanffy, Logístico, Gompertz e o modelo geral
de Schnüte-Richards) foram ajustados a um conjunto de dados de peixes capturados no interior de lagos situados no médio Solimões. Esses modelos foram ajustados por equações não lineares e o número de tambaquis em cada classe de
tamanho foi usado como peso no ajuste. A avaliação do ajuste de cada modelo foi baseada no Critério de Informação
de Akaike (AIC), na diferença do AIC entre os modelos (∆i) e nos pesos de evidência (wi). Tanto o modelo Logístico
(∆i = 0,0) como o de Gompertz (∆i = 1,12) foram suportados pelos dados, mas nenhum deles foi claramente superior
(wi, respectivamente, de 52,44 e 29,95%). Assim, é proposto o uso de um modelo médio para estimar o comprimento
assintótico (L∞). O modelo médio, baseado nos modelos Logístico e de Gompertz, resultou em uma estimativa de
L∞ = 90,36 e indicou que o tambaqui levaria aproximadamente 25 anos para atingir esse tamanho.
1. Introduction
The tambaqui, Colossoma macropomun (Cuvier 1816,
Characidae), is the largest characin of the Neotropical region. It migrates hundreds of kilometers in the rivers along the lowland Amazon basin. Juveniles feed on zooplankton in the floodplain lakes, and adults feed on fruits and seeds in the flooded forests (Araújo-Lima and Goulding, 1997; Costa et al., 1999; Goulding and Carvalho, 1982). There
is one panmictic population in this region (Santos et al.,
2007), with an estimated potential yield of 15,000 tons (Barthem and Goulding, 2007). Tambaquis respond strongly to fluctuations in water level, and the tambaqui fishery is influenced by these fluctuations. In the central Amazon, the tambaqui fishery exploits stocks of adult tambaquis when in dispersion or reproductive movements, and juvenile tambaquis are mostly captured in floodplain lakes during the dry season (Araújo-Lima and Goulding, 1997; Costa et al., 2001; Goulding and Carvalho, 1982). A decline in large adult tambaqui catch in the last few years has forced the commercial fleet, responsible for supplying Amazon markets, to exploit the floodplain lakes more
intensively. This has resulted in an increase in juvenile and young adult catch and consequently in a diminution in the mean size of landed tambaquis (Araújo-Lima and
Goulding, 1997; Costa et al., 2001; Isaac and Ruffino, 1996). Excessive tambaqui fishing has transformed this resource from underexploited in the 1970s (Petrere, 1983) to a “growth-overfishing” condition in the 1990s (Costa et al., 1999; Isaac and Ruffino, 1996).
One of the main sources of variation in stock biomass is the growth of individuals that are already in the population. Thus, studies on the growth of species of commercial
value, such as Colossoma macropomum, are very important
to fishery management strategies. To date, published studies on tambaqui growth have been conducted based
on the arbitrary choice of a single model (usually the von
Bertalanffy equation), and the parameter estimation and inference of growth are based on this unique model adjusted to the data set (Isaac and Ruffino, 1996; Penna et al., 2005; Petrere, 1983). This procedure does not account for the likely uncertainty related to the structure of the model and implicitly assumes the existence of one “true” model. This assumption is unrealistic and is not justified by philosophy or mathematics (Buckland et al., 1997; Burnham and Anderson, 2002; Chatfield, 1995).
Computer-intensive methods allow a large number of models to be considered, and data-dependent specification
searches have become common procedure in biology
(Manly, 2007; Roff, 2006). Akaike´s information criterion (AIC) for model selection is relatively recent and uses a Kullback-Leibler inform (or K-L distance) as a fundamental,
conceptual measure of the relative distance of a given
model from full reality (Burnham and Anderson, 2002). Although the use of AIC for model selection would be a better approach than arbitrarily picking a model, data
often supports more than one model, reinforcing that uncertainty in model selection cannot be ignored (Burnham
and Anderson, 2002; Katsanevakis, 2006). In practice, if
model selection uncertainty is ignored, precision is often overestimated, and predictions are less accurate than
expected (Burnham and Anderson, 2002). Thus, rather than making inferences from a unique model estimated
to be best from a set of models, robust inferences can be made from several models or on the entire model set via
model averaging (Burnham and Anderson, 2002). The tambaqui is one of the key species among Amazonian fish of commercial value. However, some aspects of the biology of growth of wild animals in its natural environment
are not fully understood. In this study, statistics of model selection and multimodel inference (MMI), based on information theory approach, are applied for length-age data, aiming to obtain a more robust estimation of the parameters
of growth of juveniles and young adults in tambaqui stocks living in floodplain lakes. Growth parameters and inferences will help to better understand the effect of the fishery fleet, acting specifically on floodplain lakes, and the
present diminution of the mean size of landed tambaquis.
2. Material and Methods
Fish were sampled from floodplain lakes at the Reserva de Desenvolvimento Sustentável Mamirauá (RDSM), located in the confluence of the Solimões and Japurá Rivers in Amazonas state, Brazil (see Figure 1), during low water seasons from 1993 to 1995. Fish are confined to lakes during the dry season and are thus isolated from the main river channel and other surrounding water bodies. Each lake was sampled once a year with an encircling gillnet that was 120 m long, 9 m high and 0.14 m between opposite knots.
Length was measured as snout to the extremity of the mesial ray of the caudal fin (fork length) and a sample of scales was taken from the region below the pectoral fin from each fish caught, before its liberation in the original lake. Age was determined by ring counting, as described in Costa et al. (1999). From the total sample of captured fish, a stratified subsample of five tambaquis for each 2-cm length class was taken for the readings of growth rings. The age validation method employed was based on a mark-recapture experiment of wild fish. Scales were removed at the time of tagging and release of wild fish. The removed scale was used to estimate the age at tagging,
and the time at liberty added to estimate the absolute age
of the recaptured fishes (unpublished data). The data of mean length estimated for each age class were used to
model the growth of C. macropomum. This approach was
used in all previous studies on the growth of this species (Petrere, 1983; Isaac and Ruffino, 1986; Penna et al., 2005) and was adopted here to ensure comparability of results.
2.1. Set of candidate models
Four models commonly used for estimating parameters
of fish growth were evaluated (Equations 1-4):
Logistic (Ricker, 1975):
(
( 0))
1 k t t t
Gompertz (1825):
(
k t t( 0))
t
l =L exp∞ −e− − (2);
Von Bertalanffy (1938):
(
k t t( 0))
t
l =L∞ 1 e− − − (3);
Schnute-Richards (1990):
(
kt1)
1bt
l =L∞ 1+ αe− (4).
These four candidate models, respectively gI: g1-g4, were adjusted to the length-age data obtained via scale readings
of tambaquis captured in the floodplain lakes. Equation 4
is a special case of the general Schnute-Richards model of
fish growth, and it is equivalent to the generalised Schnute growth model with four parameters (Haddon, 2001; Quinn II and Deriso, 1999; Schnute and Richards, 1990). This
last parameterisation corresponds to the logistic, von
Bertalanffy, and Gompertz models when the parameter
b is respectively: –1, 1 and ≈ 0.01. Equation 4 was used
as a substitute of the original model of Schnute (1981)
because it gives a direct estimation of asymptotic length and because the data set does not support the adjustment of a more parameterised equation.
2.2. Modelling the growth of tambaqui
All the models gI(i = 1,..., R) were adjusted to the data
by non-linear weighted regressions using the sample size of each length class as weight. This strategy makes an efficient use of small data sets and yields better estimates
of parameters and respective confidence intervals. Iterations
were conducted using the algorithm Levenberg-Marquardt,
available in the SPSS software, v.15.0 (SPSS 2006),
assuming an additive error structure. The best model
among the candidate models was selected using Akaike´s
Information Criterion adjusted for small sample sizes or
AICc (Burnham and Anderson, 2002; Hurvich and Tsai,
1989; Shono, 2000). The AICc is based on information
theory and has been computed from least squares regression
statistic as (Burnham and Anderson, 2002) (Equation 5):
( )
2(
)
c
2k k 1
ˆ
AIC n log 2k
n k 1
+
= σ + +
− − (5)
where σ =ˆ2
RSS/ n, RSS is the residual sum of squares for
a particular candidate model, n is the sample size and k is the total number of estimated regression parameters including
σ2 (number of parameters in the model equation plus one).
Normally distributed deviations with constant variance were assumed. The models were ranked and compared using
∆AICc and Akaikeweights (Burnham and Anderson, 2002).
The∆AICc for each model i was calculated as (Equation 6):
i i min
c c c
AIC AIC AIC
∆ = − (6)
The values of ∆AICc help to compare the relative distance
between the most parsimonious model, which represents the
best compromise between accuracy and precision (AICcmin),
and each other candidate model (AICci). The fit of candidate
models is considered essentially equivalent when ∆AIC
is smaller than two (Burnham and Anderson, 2002). The
Akaike weight (wI) is used to quantify the plausibility of
each model i, given the set of a priori candidate models and the data. The most plausible candidate model has the greatest wI. The wIderived from the differences between
AICc values was computed as (Burnham and Anderson,
2002) (Equation 7):
i i R r r 1 1 exp 2 w 1 exp 2 = − ∆ = − ∆
∑
(7)where ∆I is the ∆AICc, and R is the number of candidate
models used in the analysis. The Akaike weights given for
each model are interpreted as a measure of evidence of the
‘‘best’’ one within the set of candidate models (Akaike, 1983; Buckland et al., 1997; Burnham and Anderson 2002). However, if no single model is clearly superior (wI < 0.9) to the others in the set, then model-averaged parameter
estimates using Akaike weights is recommended (Burnham and Anderson, 2002). The model-average was computed
by averaging the predicted response variable L(t) across models, using the corresponding wI´s as weights (Burnham
and Anderson, 2002; Katsanevakis, 2006). The model-averaged asymptotic length was calculated as (Burnham and Anderson, 2002; Katsanevakis, 2006; Katsanevakis and Maravelias, 2008) (Equation 8):
R
i i i 1
ˆ
L∞ w L ,∞
=
=
∑
(8)where Lˆ∞i denotes estimated asymptotic length for each
model gI , i = 1,.., R, and asymptotic 95% CI estimated as
( )
∞i± d.f .,0,975 ∞iˆ ˆ
L t S.E L . The unconditional standard error of
∞
L was estimated as following (Burnham and Anderson,
2002) (Equation 9):
R
2
i i i i
i 1
ˆ ˆ
S.E. (L )∞ w var(L∞ | g ) (L∞ L )∞
=
=
∑
+ − (9)where var(Lˆ∞i| g )i is the variance of the estimated asymptotic
length, conditional on the model gI (Buckland et al., 1997;
Burnham and Anderson, 2002). The asymptotic L∞ was the
only parameter chosen to represent the averaged-model in this study, because the other parameters, k e to, do not have
the same meaning across models evaluated (Katsanevakis, 2006; Quinn II and Deriso, 1999; Ricker 1975; Schnute and Richards, 1990).
3. Results
3.1. Key mean length-age
A total of 3,524 tambaquis were caught within the ten lakes of the RDSM. All fish had a fork length smaller than 63 cm, and only 3% or captured fish had length equal or larger than the minimum size allowed by Brazilian legislation
(55 cm). The subsample taken to scale readings included
526 individuals, and data analyses indicated that tambaquis
in the study region stay confined within floodplain lakes for approximately 5-6 years (as shown in Table 1).
3.2. Comparing growth models
Based on values for ∆I it is possible to conclude that both the logistic (∆I = 0.00) and Gompertz (∆I = 1.12)
models are equally well supported by the dataset available
for C. macropomum (as shown in Table 2). However,
according to Akaike weights, the Logistic model is 1.80
times better supported than the Gompertz model. The von
Bertalanffy model was also supported by the data, with a weight of evidence of 17.60%. However, the estimation of
the asymptotic length L∞and the corresponding asymptotic
95% confidence interval are evidence that the von Bertalanffy
model underestimates the precision for the available dataset. The Schnute-Richards model had essentially no support
in the data, and overestimated precision (see Table 2). The logistic model was not a “clear winner” (wI< 90%).
Thus, it is too risky to make inferences based uniquely on this model. However, estimating the average model using
the set of candidate models could lead to an underestimation of the precision of model-averaged asymptotic length (see
Table 2). The most robust estimate of L∞was obtained
by excluding the von Bertalanffy and Schnute-Richards models, which had little or no support from the data from the final average estimate (as shown in Table 3).
The projection of the growth curve of Colossoma
macropomum, according to the average model prediction,
suggests that this species in nature would take approximately
25 years to reach a mean L∞of approximately 90 cm of
fork length (see Figure 2).
4. Discussion
The use of the Akaike Information Criterion (AIC) for selection of the best fit model revealed a high degree of
uncertainty that cannot be ignored. This uncertainty could have serious implications for parameter estimation and comparison of parameters among different populations and
consequently for delineation of specific management strategies (Katsanevakis, 2006; Katsanevakis and Maravelias, 2008).
Table 1. Mean length by age for tambaquis caught within floodplain lakes at the MSDR, between 1993 and 1995 (n = 526).
Relative age (year) Mean length (cm) Number of individuals
0 26.75 2
1 32.42 40
2 39.47 157
3 46.59 152
4 54.16 115
5 60.15 58
For the present data set, the information theory method
reinforced the importance of multimodel inference, which allowed estimating a growth parameter by model-averaging, yet the dataset has supported more than one model between
the applied candidate models. In this situation, using only
one model in the set could result in estimating growth parameters with low precision or accuracy.
The a priori use of the von Bertalanffy equation has
been questioned by many authors (Knight, 1968; Roff,1980; Schnute, 1981). (Katsanevakis and Maravelias, 2008) applied
the AIC to select from four different models adjusted to
133 length-age datasets for 82 fish species and concluded that the von Bertalanffy equation was not the best model
for 65.4% of them. The von Bertalanffy equation tends to
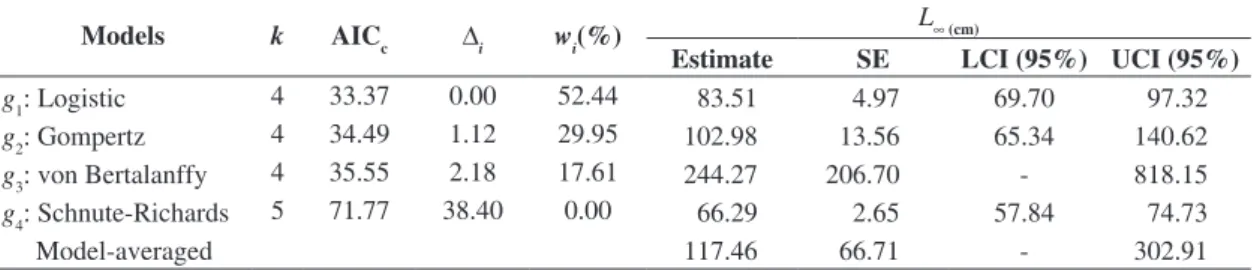
Table 2. Summary of the modelling of tambaqui (Colossoma macropomum) growth by using data of length-age obtained by reading growth rings in scales of fish captured within floodplain lakes.
Models k AICc ∆i wi(%) L∞ (cm)
Estimate SE LCI (95%) UCI (95%)
g1: Logistic 4 33.37 0.00 52.44 83.51 4.97 69.70 97.32
g2: Gompertz 4 34.49 1.12 29.95 102.98 13.56 65.34 140.62 g3: von Bertalanffy 4 35.55 2.18 17.61 244.27 206.70 - 818.15 g4: Schnute-Richards 5 71.77 38.40 0.00 66.29 2.65 57.84 74.73
Model-averaged 117.46 66.71 - 302.91
where k is the number of estimated parameters in the model; AICc , is the second order Akaike information criterion; ∆i, is
the difference between the AICc of each model and the model with the lowest AICc value; wi, is the Akaike weigth for the model; L∞, is the asymptotic length; SE, estimated standard error; - negative value; LCI, lower confidence interval; UCI, upper confidence interval.
Table 3. Result of modelling growth for tambaqui (Colossoma macropomum) after excluding the Von Bertalanffy and Schnute-Richard models
Models k AICc ∆i wi(%) L∞ (cm)
Estimate S.E LCI (95%) UCI (95%)
g1: Logistic 4 33.37 0.00 63.64 83.51 4.97 69.70 97.32
g2: Gompertz 4 34.49 1.12 36.36 102.98 13.56 65.34 140.62
Model-averaged 90.36 11.87 57.36 123.36
where k is the number of estimated parameters in the model; AICc , is the second order Akaike information criterion; ∆i, is
the difference between the AICc of each model and the model with the lowest AICc value; wi, is the Akaike weigth for the
model; L∞, is the asymptotic length; SE, estimated standard error; - negative value; LCI, lower confidence interval; UCI, upper confidence interval.
be better suited to describe the growth of a species when
adjusted to a dataset composed by many older animals,
which exhibit a maximum asymptotic length (Haddon, 2001; Roff, 1980). For tambaquis proceeding from the Solimões-Amazonas rivers and its tributaries, the von
Bertalanffy adjustment to age-length of adult individuals
(length > 55 cm) has revealed an asymptotic pattern of growth (Petrere, 1983).
It is important to emphasize that the aim of information theory is not to simply model the data, but to recover the
information contained (Buckland et al., 1997; Burnham and Anderson, 2002). In this sense, model selection is not only dependent on the pattern of growth of each
species, but also on the quality and characteristics of the dataset and the quantity of information that it contains
(Katsanevakis, 2006; Katsanevakis and Maravelias, 2008). Therefore, if a species presents an asymptotic growth but adult individuals are absent from the dataset, the von Bertalanffy model would not be well supported
because the von Bertalanffy equation has the assumption
of asymptotic growth. This can partially explain the poor
performance of the von Bertalanffy model in this study,
where the dataset was composed primarily by young
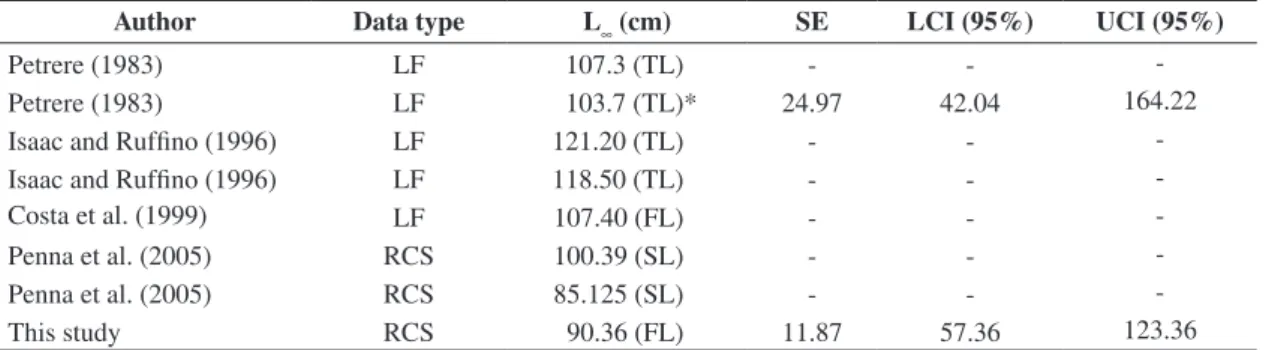
tambaquis and presented a reduced number of adults. This characteristic forced the von Bertalanffy model to obtain the L∞ parameterthrough extrapolation, and the result was considered largely overestimated (L∞≈ 244 cm) because is above all estimates of this parameter obtained in the literature and considered biologically plausible for this
species (see Table 4).
However, the poor fit of the von Bertalanffy model to this species is not merely related to the profile of the present dataset. Even the dataset used by Petrere (1983), which was predominantly composed of adults, presented a low performance when the von Bertalanffy model was
adjusted. Petrere (1983) presented a plausible L∞because
this author did not estimate this parameter by modelling,
but has fixed it as 107.3 cm, based on the largest tambaqui
found in nature. As his data matrices are available (Tables III
e IV in Petrere, 1983), it was possible to use that dataset
to adjust the von Bertalanffy model and to estimate the
L∞parameter and its respective confidence interval (as
shown in Table 4). The results have shown high uncertainty
associated to the von Bertalanffy model adjusted to that dataset: the 95% CI for L∞obtained was wider than that obtained by the averaged-model estimated in this study.
All data analyses have the objective of making inferences
that can be appropriately applied to the population (Anderson,
2007; Burnham and Anderson, 2002). The upper limit
obtained by the Schnute-Richards model for the L∞was
74.73 cm, which clearly does not reflect what is found in
nature. Despite their absence from our dataset, tambaquis
with lengths equal or larger than 80 cm are still commonly caught outside várzea lakes (Costa et al., 1999). Therefore, when data adjustment is maximised in the general
Schnute-Richards model, it is detrimental to the generalisation of parameter estimation. In this case, the AICc reflected the
“penalty” applied to the Schnute-Richards model for being a more parameterised model, which was not supported by
the present dataset.
For the middle Solimões River population of tambaquis, the averaged-model calculated by a weighted mean of the
predicted response variable L(t) using the Logistic and Gompertz models resulted in a plausible estimate of the L∞
parameter. In the model selection context, when none of the
models is clearly superior, the use of the averaged model is
the best strategy (Buckland et al., 1997). Quantification of
the uncertainty associated with L∞, obtained by calculating
the confidence intervals around the estimated parameter has revealed that there are no significant differences
between the prediction of L∞obtained in this study by
model-averaging and the predictions for this parameter found in the literature, yet all previous estimates for L∞are
within the 95% confidence interval (as shown in Table 4).
In this study, the use of the AICc reinforcedthe importance of considering the uncertainty in model selection for the
estimation of growth parameters for freshwater Amazonian fish. Moreover, more robust parameter estimation can be obtained when the model-averaging procedure is based on models with strong data support.
Management of tambaqui fisheries in the Central Amazon is a challenge because of heterogeneity in exploitation, with commercial and subsistence fishermen using multi gear equipment and fishing along the large extension of
Table 4. L∞ estimates for Colossoma macropomum by using different data sets.
Author Data type L∞ (cm) SE LCI (95%) UCI (95%)
Petrere (1983) LF 107.3 (TL) - -
-Petrere (1983) LF 103.7 (TL)* 24.97 42.04 164.22
Isaac and Ruffino (1996) LF 121.20 (TL) - -
-Isaac and Ruffino (1996) LF 118.50 (TL) - -
-Costa et al. (1999) LF 107.40 (FL) - -
-Penna et al. (2005) RCS 100.39 (SL) - -
-Penna et al. (2005) RCS 85.125 (SL) - -
-This study RCS 90.36 (FL) 11.87 57.36 123.36
the main rivers and lakes. Profound knowledge of the life cycle of the exploited species is required for management
of such resources. This study reinforces the importance of
restricting the fisheries within floodplain lakes as the stock
in these environments is mostly composed of juvenile and young adult individuals.
Acknowledgements – We thank the MAMIRAUÁ Project, ODA, WWF, WCS, CNPq, INPA, and MPEG for financial and logistical support. LRF Costa acknowledges the GEOMA Project (Biodiversity component) and CNPq for the grant received (Processo no. 372134/2010-6). The authors acknowledges fieldwork help and friendship from Sigueru Esashica and would like to dedicate this paper to his memory. We also thank an anonymous referee for insightful comments
on the earlier version of the manuscript.
References
AKAIKE, H., 1983. Information measures and model selection.
International Statistical Institute, vol. 44, p. 277-291.
ANDERSON, DR., 2007. Model based inference in the life sciences - a primer on evidence. New York: Springer. 184 p.
ARAÚJO-LIMA, CARM. and GOULDING, M., 1997. So Fruitful a Fish - Ecology, Conservation, and Aquaculture of the Amazon’s Tambaqui. New York: Columbia University Press. 191 p. BARTHEM, RB. and GOULDING, M., 2007. An unexpected ecosystem: the Amazon revealed by the fisheries. Lima: Grafica Biblos, 2007. 241 p.
BUCKLAND, ST., BURNHAM, KP. and AUGUSTIN, NH., 1997.
Model selection: an integral part of inference. Biometrics, vol. 53, p. 603-618. http://dx.doi.org/10.2307/2533961
BURNHAM, KP. and ANDERSON, DR., 2002. Model selection and multimodel inference: a practical information-theoretic
approach. New York: Springer. 488 p.
CHATFIELD, C., 1995. Model uncertainty, data mining and
statistical inference. Journal of the Royal Statistical Society, vol. 158, no. 3, p. 419-466. http://dx.doi.org/10.2307/2983440 COSTA, LRF., BARTHEM, RB. and BITTENCOURT, MM., 2001.
A Pesca do tambaqui, Colossoma macropomum, com enfoque
na área do médio Solimões, Amazonas, Brasil. Acta Amazônica, vol. 31, no. 3, p. 449-467.
COSTA, LRF., BARTHEM, RB. and VILLACORTA-CORREA,
MA., 1999. Manejo da pesca do tambaqui nos lagos de várzea da
Estação Ecológica Mamirauá. In QUEIROZ, HL. and CRAMPTON, WGR. (Eds.). Estratégias para manejo de recursos pesqueiros em Mamirauá. Brasília: MCT/CNPq/SCM. p. 142-158.
GOULDING, M. and CARVALHO, ML., 1982. Life history
and management of the tambaqui (Colossoma macropomum,
Characidae): an important amazonian food fish. Revista Brasileira de Zoologia, vol. 1, no. 2, p. 107-133.
HADDON, M., 2001. Modelling and quantitative methods in fisheries. Boca Raton: Chapman & Hall/CRC. 406 p.
HURVICH, CM. and TSAI, CL., 1989. Regression and time series
model selection in small samples. Biometrika, vol. 76, p. 297-307.
http://dx.doi.org/10.1093/biomet/76.2.297
ISAAC, VJ. and RUFFINO, ML., 1996. Population dynamics of
tambaqui, Colossoma macropomum Cuvier, in the lower Amazon,
Brazil. Fisheries Management and Ecology, vol. 3, p. 315-333.
http://dx.doi.org/10.1046/j.1365-2400.1996.d01-154.x KATSANEVAKIS, S., 2006. Modelling fish growth: model
selection, multi-model inference and model selection uncertainty. Fisheries Research, vol. 81, p. 229-235. http://dx.doi.org/10.1016/j.
fishres.2006.07.002
KATSANEVAKIS, S. and MARAVELIAS, CD., 2008. Modelling
fish growth: multi-model inference as a better alternative to a
priori using von Bertalanffy equation. Fish and Fisheries, vol. 9, p. 1-10. http://dx.doi.org/10.1111/j.1467-2979.2008.00279.x KNIGHT, W., 1968. Asymptotic growth: an example of nonsense
disguised as mathematics. Journal of Fisheries Research Board of Canada, vol. 25, p. 1303-1307. http://dx.doi.org/10.1139/f68-114
MANLY, BFJ., 2007. Randomization, Bootstrap and Monte Carlo Methods in Biology. Boca Raton: Chapman & Hall/ CRC, 2007. 455 p.
PENNA, MAH., VILLACORTA-CORRÊA, MA., WALTER, T. and PETRERE-JUNIOR, M., 2005. Growth of the tambaqui Colossoma macropomum (Cuvier) (Characiformes: Characidae): which is the Best model? Brazilian Journal of Biology, vol. 65, no. 1, p. 129-139. PMid:16025912. http://dx.doi.org/10.1590/ S1519-69842005000100017
PETRERE, MJ., 1983. Yield per recruit of the tambaqui,
Colossoma macropomum Cuvier, in the Amazonas State, Brazil. Journal of Fish Biology, vol. 22, p. 133-144. http://dx.doi. org/10.1111/j.1095-8649.1983.tb04733.x
QUINN II, TJ. and DERISO, RB., 1999. Quantitative Fish Dynamics. edited by WM. GETZ. New York: Oxford University
Press. 542 p.
RICKER, WE., 1975. Computation and Interpretation of Biological Statistics of Fish Populations. Bulletin Fisheries Research Board of Canada, vol. 191, p. 1-382.
ROFF, DA., 1980. A motion to retire the von Bertalanffy function. Canadian Journal of Fisheries and Aquatic Sciences, vol. 37, p. 127-129. http://dx.doi.org/10.1139/f80-016
-, 2006. Introduction to Computer-Intensive Methods of Data Analysis in Biology. New York: Cambridge University Press. 368 p.
SANTOS, MCF., RUFFINO, ML. and FARIAS, IP. 2007. High levels of genetic variability and panmixia of the tambaqui Colossoma macropomum (Cuvier, 1816) in the main channel of the Amazon
River. Journal of Fish Biology, vol. 71, Supplement A, p. 33-44.
SCHNUTE, J., 1981. A versatile growth model with statistically
stable parameters. Canadian Journal of Fisheries and Aquatic Sciences, vol. 38, p. 1128-1140. http://dx.doi.org/10.1139/f81-153
SCHNUTE, JT. and RICHARDS, LJ., 1990. A unified approach to the analysis of fish growth, maturity, and survivorship data.
Canadian Journal of Fisheries and Aquatic Sciences, vol. 47, p. 24-40. http://dx.doi.org/10.1139/f90-003
SHONO, H., 2000. Efficiency of the finite correction of Akaike’s
information criteria. Fisheries Science, vol. 66, p. 608-610. http://
dx.doi.org/10.1046/j.1444-2906.2000.00095.x