Behavioral changes induced by cocaine
in mice are modified by a hyperlipidic
diet or recombinant leptin
Departamento de Farmacologia, Fundação Faculdade Federal de Ciências Médicas de Porto Alegre, Porto Alegre, RS, Brasil
E. Erhardt, L.C.E. Zibetti, J.M. Godinho, B. Bacchieri and H.M.T. Barros
Abstract
The objective of the present study was to determine if the acute behavioral effects of cocaine acutely administered intraperitoneally (ip) at doses of 5, 10 and 20 mg/kg on white male CF1 mice, 90 days of age, would be influenced by leptin acutely administered ip (at doses of 5, 10 and 20 µg/kg) or by endogenous leptin production enhanced by a high-fat diet. The acute behavioral effects of cocaine were evaluated in open-field, elevated plus-maze and forced swimming tests. Results were compared between a group of 80 mice consuming a balanced diet and a high-fat diet, and a group of 80 mice fed a commercially available rodent chow formula (Ralston Purina) but receiving recombinant leptin (rLeptin) or saline ip. Both the high-fat-fed and rLeptin-treated mice showed decreased locomotion in the open-field test, spent more time in the open arms of the elevated plus-maze and showed less immobility time in the forced swimming test (F(1,68) = 7.834, P = 0.007). There was an interaction between diets and cocaine/saline treatments in locomotion (F(3,34) = 3.751, P = 0.020) and exploration (F(3,34) = 3.581, P = 0.024). These results suggest that anxiolytic effects and increased general activity were induced by leptin in cocaine-treated mice and that low leptin levels are associated with behavioral depression. Chronic changes in diet composition producing high leptin levels or rLeptin treatment may result in an altered response to cocaine in ethologic tests that measure degrees of anxiety and depression, which could be attributed to an antagonistic effect of leptin.
Correspondence E. Erhardt
Departamento de Farmacologia Fundação Faculdade Federal de Ciências Médicas de Porto Alegre Av. Neuza G. Brizola, 495, Apto. 301 90460-230 Porto Alegre, RS Brasil
E-mail: [email protected]
Research supported by FFFCMPA and Medley Laboratories.
Received May 18, 2005 Accepted August 21, 2006
Key words
•Mice •Cocaine •Leptin
•Hyperlipidic diet •Interaction
Introduction
It is currently recognized that appetite expression, body adiposity control, begin-ning of puberty, behavioral and affective changes, among other functions, are chemi-cally coded in the hypothalamus. The de-rangement of neurochemical signaling in the
hypothalamus by environmental, genetic and hormonal factors may produce hyperphagia, anorexia and anomalies of sexual develop-ment and gonadal function (1).
mainly by adipose tissue. It plays an impor-tant role in the control of food ingestion, in the reproductive system and in several steps involved in metabolism, such as insulin se-cretion, lipolysis and glucose transport. How-ever, one of its most important physiological roles is to signal the nutritional status during periods of food deprivation (4-9).
Leptin levels vary widely among indi-viduals with similar body compositions and in depressed and anorectic patients, suggest-ing that factors other than body adiposity modulate leptin secretion (10). In fact, the fat content of a meal and habitual dietary fat content, but not carbohydrate or protein in-take, are important factors that can modify leptin secretion (11-13).
It has been observed that body mass in-dex (BMI, the quotient of weight (kg) di-vided by the square of the height (m2)) can
be correlated with serum leptin levels lin-early in both men and women (10). Leptin
levels in men with a BMI >30 kg/m2 were
170% higher than in men with a BMI <27
kg/m2 (13). This relation was not seen in
depressed patients, suggesting a disturbed regulation of leptin secretion in mood disor-ders (10). In fact, these patients present more intense leptin secretion during the night when compared to normal subjects, despite a re-ported weight loss by the majority of pa-tients (10). A sexual dimorphism was seen between depressed and normal patients, with higher leptin levels in females (10).
There are other factors that suggest a role of leptin in mood disorders. Leptin stimu-lates the sympathetic nervous system whereas both galanin and neuropeptide Y (NPY) re-duce sympathetic tone (14). NPY has anxio-lytic activity, and leptin, which antagonizes the action of NPY, may have anxiogenic effects(15). In addition, leptin administra-tion inhibits diencephalic nitric oxide syn-thase, thus increasing serotonin metabolism in mice (16). Since serotonin has a role in depressive diseases, it is possible that leptin may play a role in mood regulation (13,17).
However, an interesting study by Suoma-lainen and Mannisto (18) showed no anxio-lytic/anxiogenic or depressive-like effects
resulting from acute ip administration of
leptin to mice. Interestingly, a recent study by Asakawa and colleagues (19) showed that in ob/ob mice repeated injections of leptin ameliorated anxiety levels in the el-evated plus-maze test, suggesting an impor-tant relationship between obesity syndrome, leptin and behavior.
The elevated consumption of foods rich in calories such as high-fat food, associated with low physical activity, have led to an increase in obesity in the developing world, particularly among children and adolescents (20,21). In Brazil, about 20% of Brazilian teenagers are obese (22). In addition, co-caine addiction represents another impor-tant problem in modern society and the con-sumption of this drug has been increasing among teenagers (23). It has been exten-sively reported that cocaine alters the reward system, thus impairing the effects of natural rewards, such as eating, drinking, sex, and social interactions (24). On this basis, it is important to determine a possible interac-tion between high-fat foods as enhancers of leptin production and behavioral changes induced by cocaine. Thus, the objective of the present study was to determine whether the acute behavioral effects of cocaine are influenced by exogenous treatment with leptin or by enhanced endogenous produc-tion of leptin through a high-fat diet.
Material and Methods
Animals
19:00 pm), with free access to water and food. Maintenance and experimental proce-dures were submitted to and approved by the Animal Experimentation Committee of FFFCMPA, Faculty of Medicine and were in agreement with the guidelines of the So-ciety of Neuroscience and of the Brazilian College for Animal Experimentation.
Experiment 1: high-fat diet
Animals were randomly divided into two groups of 40 animals each. One group was fed a balanced diet (20% of total kcal as lactalbumin, 30% of total kcal as purified soy oil and 50% of total kcal as corn starch) and the other a high-fat diet (20% of total kcal as lactalbumin, 30% of total kcal as corn starch and 50% of total kcal as purified soy oil) for 48 consecutive days. During this period, the animals were weighed three times a week. The high-fat diet and the balanced diet (Table 1) were prepared according to the standards of the Association of Official Analytical Chemists (diet macronutrients were weighed and mixed homogeneously, with enough distilled water added to form a soft dough that could be spread on trays, cut into squares (2 x 2 cm) and dried under constant ventilation at 22ºC for 12 h). The diet squares were then covered and stored separately according to their composition in a refrigerator (4ºC) in hermetically sealed plastic boxes containing a silica gel pack to reduce humidity and thus to avoid fungus proliferation, for use within 7 days.
According to the method reported by Lin et al. (25), mice were tested at the age of 3 weeks, a phase when the animals had an increase in leptin production, but still re-tained central leptin sensitivity.
In each subgroup (N = 10), the animals
were injected ip with saline or cocaine in
saline (5, 10, and 20 mg/kg). Cocaine hydro-chloride (Merck & Co., Darmstadt, Ger-many) and saline solutions were prepared in deionized water immediately before use and
administered acutely at a fixed dose of 1 mL/ 100 g animal weight. Drugs were adminis-tered 60 min before the open-field test, 30 min before the plus-maze test, and 24, 5, and 1 h before the forced swim test.
Behavioral tests were applied once a day starting on the 46th day of the special diet, in the following order: open-field, elevated plus-maze and forced swimming test. The cages were carried to test rooms, illuminated with a red fluorescent light on the ceiling, and each test was recorded on a video recording system for further analysis.
Experiment 2: recombinant leptin treatment
Mice were divided into 4 groups of 20 animals, respectively receiving saline (con-trols), 5 mg/kg cocaine, 10 mg/kg cocaine, and 20 mg/kg cocaine. Each one of the 4 groups was subdivided into 4 subgroups of 5 mice each that received saline solution (con-trols), 5 µg/kg body weight human recombi-nant leptin (rLeptin), 10 µg/kg body weight human rLeptin, and 20 µg/kg body weight human rLeptin, respectively. Drugs were administered according to the same sched-ule as in Experiment 1. After an adaptation time of 1 week in our laboratory, mice were submitted to the behavioral tests in the same daily sequence as described in Experiment 1, i.e., open-field, elevated plus-maze and forced swimming tests.
Leptin doses were chosen on the basis of the data of Ahren et al. (26).
Table 1. Composition of the balanced and high-fat diets in macronutrients offered to the animals (diet contained minerals and vitamins).
Diet components Balanced diet High-fat diet
Proteins 24.11 g/100 g diet 27.72 g/100 g diet
20% calories 20% calories
Lipids 15.96 g/100 g diet 30.75 g/100 g diet
30% calories 50% calories
Carbohydrates 59.93 g/100 g diet 41.53 g/100 g diet
to keep their heads out of water.
Statistical analysis
Two-way ANOVA was used to analyze all the behavioral parameters of each experi-ment. When significant differences were found, subgroup analysis was performed with the Student-Newman-Keuls test using the statistical package Sigma Stat for Windows, version 2.0 (Jandell Scientific Corporation, San Rafael, CA, USA). The level of signifi-cance was set at P < 0.05.
Results
No difference in body weight gain was observed between mice that received a bal-anced diet and mice that received a high-fat diet. The initial mean (± SD) weight of mice entering the balanced diet group was 37.9 ± 25.2 g, and the initial mean weight of mice assigned to the high-fat diet was 37.3 ± 3.3 g; after 46 days of diet their weights were 43.7 ± 4.9 g (an increase of 15.3% over their initial weight) and 44.8 ± 4.2 g (an increase of 20.10% over their initial weight), respectively.
Open-field test
In Experiment 1 there was interaction between diets and cocaine/saline treatments
regarding locomotion (F(3,34) = 3.751, P =
0.020)and exploration (F(3,34) = 3.581, P =
0.024).High-fat-fed mice were less
suscep-tible to the stimulant effects of cocaine when compared to mice that received a balanced diet. The latter presented an increase in loco-motion and exploration when compared to the former. In Experiment 2 there was no interaction between leptin and cocaine. Ad-ministration of leptin did not alter the loco-motor stimulant effects of cocaine. Cocaine (F(3,64) = 12.321, P ≤ 0.001)influenced
groom-ing in the second experiment (Table 2). Regarding grooming behavior, in Ex-periment 1, the group of mice that received a Behavioral procedures
All tests were performed in a quiet and dark room lighted by a red ceiling fluores-cent lamp and behaviors were recorded on a video recording system for later analysis.
Open-field test
The animal is placed inside a lighted arena from which it cannot escape, and pat-terns of ambulation and behaviors such as rearing, grooming, and defecation are ob-served for brief periods of time. The open-field used was a circular arena 90 cm in diameter, with a center circle (40 cm in diameter) with 45-cm high acrylic walls cov-ered with white paper. The mouse was placed in the center of the arena and allowed to explore for 5 min (27).
Elevated plus-maze
The elevated plus-maze consisted of a black acrylic cross of two closed arms (30 x 5 x 15 cm) and two open arms (30 x 5 cm) raised 50 cm above the floor. For each test, the mouse was placed in the center of the cross facing an open arm and was allowed to explore the maze for 5 min. In this test, anxiolytic compounds selectively increase the percent time spent and/or entries into the open arms and, in contrast, anxiogenic com-pounds selectively decrease the percent time spent and/or entries into the open arms (28).
Forced swim test
high-fat diet showed lower intensity com-pared to the group of mice maintained on a balanced diet (Table 2). However, in
Experi-ment 2, administration of leptin did not change the increase in grooming that fol-lowed cocaine administration (Table 3).
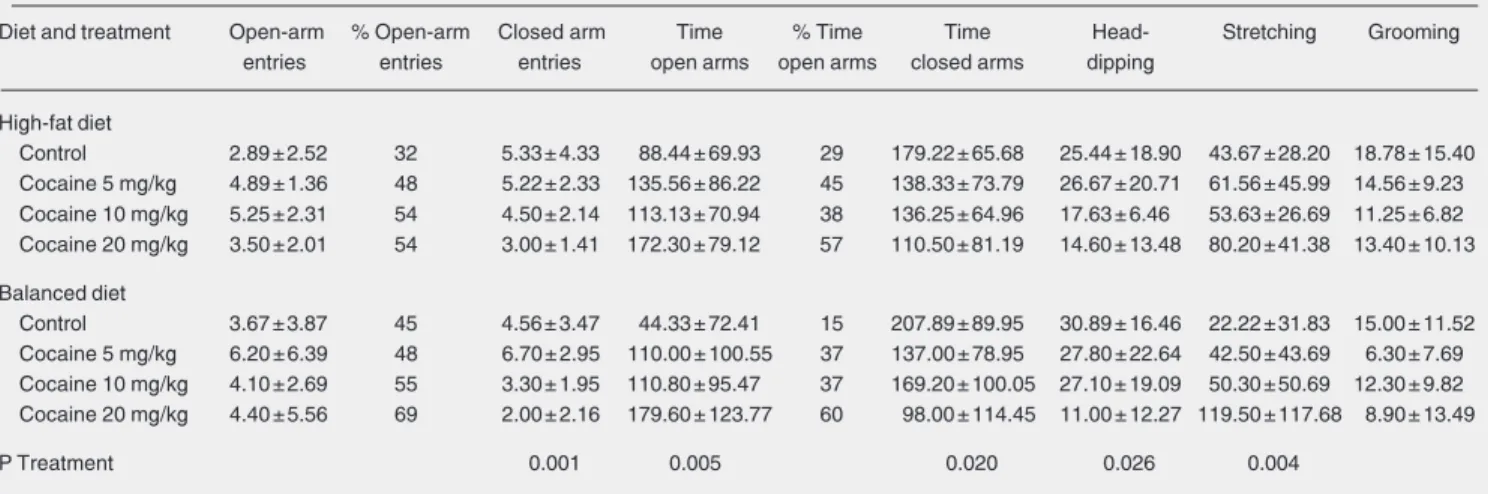
In-Table 2. Ethologic evaluation of anxiety signs in mice fed a balanced or high-fat diet and exposed to cocaine. Open-field test (experiment 1).
Diet and treatment Peripheral movements Central movements Rearing Grooming Locomotion Exploration
High-fat diet
Control 171.80 ± 45.76 28.40 ± 28.95 24.40 ± 17.97 11.40 ± 3.78 198.20 ± 74.03 222.60 ± 87.50 Cocaine 5 mg/kg 213.40 ± 59.97 52.00 ± 13.44 21.00 ± 14.68 5.20 ± 5.80 265.40 ± 58.23 286.40 ± 59.47 Cocaine 10 mg/kg 193.75 ± 97.36 38.50 ± 11.03 23.50 ± 18.12 6.25 ± 4.65 219.25 ± 83.79 242.75 ± 93.21 Cocaine 20 mg/kg 290.33 ± 91.36 65.67 ± 27.62 30.33 ± 9.29 11.17 ± 4.54 365.33 ± 105.77 395.67 ± 108.36
Balanced diet
Control 176.40 ± 56.07 44.80 ± 15.09 33.00 ± 9.57 14.80 ± 9.23 221.20 ± 42.13 254.20 ± 38.35 Cocaine 5 mg/kg 251.67 ± 78.57 47.00 ± 25.89 28.33 ± 16.66 9.50 ± 5.28 300.83 ± 94.68 329.17 ± 104.95 Cocaine 10 mg/kg 336.80 ± 104.07 53.60 ± 18.90 23.80 ± 15.09 17.80 ± 19.25 404.40 ± 96.76 428.20 ± 97.34 Cocaine 20 mg/kg 226.17 ± 113.36 35.83 ± 22.45 21.50 ± 9.99 10.83 ± 6.27 239.50 ± 141.03 261.00 ± 138.21
P Interaction 0.020 0.024
Data are reported as frequency (means ± SD). All behavior parameters of each experiment were analyzed with two-way ANOVA. Subgroup analysis was performed with the Student-Newman-Keuls test.
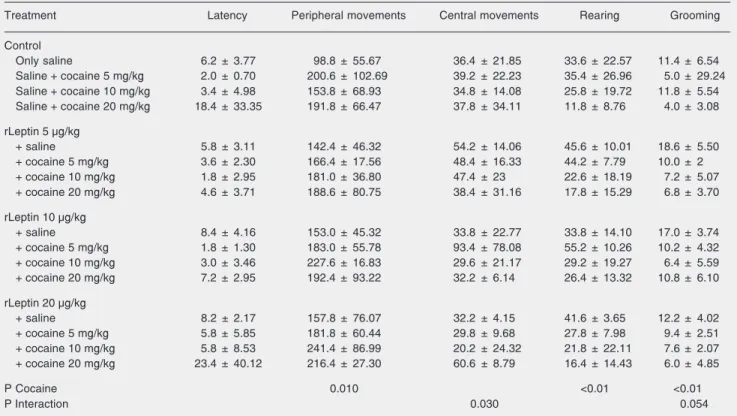
Table 3. Ethologic evaluation of anxiety signs in mice exposed to different cocaine and recombinant leptin (rLeptin) doses. Open-field test. (experiment 2).
Treatment Latency Peripheral movements Central movements Rearing Grooming
Control
Only saline 6.2 ± 3.77 98.8 ± 55.67 36.4 ± 21.85 33.6 ± 22.57 11.4 ± 6.54
Saline + cocaine 5 mg/kg 2.0 ± 0.70 200.6 ± 102.69 39.2 ± 22.23 35.4 ± 26.96 5.0 ± 29.24 Saline + cocaine 10 mg/kg 3.4 ± 4.98 153.8 ± 68.93 34.8 ± 14.08 25.8 ± 19.72 11.8 ± 5.54 Saline + cocaine 20 mg/kg 18.4 ± 33.35 191.8 ± 66.47 37.8 ± 34.11 11.8 ± 8.76 4.0 ± 3.08
rLeptin 5 µg/kg
+ saline 5.8 ± 3.11 142.4 ± 46.32 54.2 ± 14.06 45.6 ± 10.01 18.6 ± 5.50
+ cocaine 5 mg/kg 3.6 ± 2.30 166.4 ± 17.56 48.4 ± 16.33 44.2 ± 7.79 10.0 ± 2
+ cocaine 10 mg/kg 1.8 ± 2.95 181.0 ± 36.80 47.4 ± 23 22.6 ± 18.19 7.2 ± 5.07
+ cocaine 20 mg/kg 4.6 ± 3.71 188.6 ± 80.75 38.4 ± 31.16 17.8 ± 15.29 6.8 ± 3.70
rLeptin 10 µg/kg
+ saline 8.4 ± 4.16 153.0 ± 45.32 33.8 ± 22.77 33.8 ± 14.10 17.0 ± 3.74
+ cocaine 5 mg/kg 1.8 ± 1.30 183.0 ± 55.78 93.4 ± 78.08 55.2 ± 10.26 10.2 ± 4.32
+ cocaine 10 mg/kg 3.0 ± 3.46 227.6 ± 16.83 29.6 ± 21.17 29.2 ± 19.27 6.4 ± 5.59
+ cocaine 20 mg/kg 7.2 ± 2.95 192.4 ± 93.22 32.2 ± 6.14 26.4 ± 13.32 10.8 ± 6.10
rLeptin 20 µg/kg
+ saline 8.2 ± 2.17 157.8 ± 76.07 32.2 ± 4.15 41.6 ± 3.65 12.2 ± 4.02
+ cocaine 5 mg/kg 5.8 ± 5.85 181.8 ± 60.44 29.8 ± 9.68 27.8 ± 7.98 9.4 ± 2.51
+ cocaine 10 mg/kg 5.8 ± 8.53 241.4 ± 86.99 20.2 ± 24.32 21.8 ± 22.11 7.6 ± 2.07
+ cocaine 20 mg/kg 23.4 ± 40.12 216.4 ± 27.30 60.6 ± 8.79 16.4 ± 14.43 6.0 ± 4.85
P Cocaine 0.010 <0.01 <0.01
P Interaction 0.030 0.054
terestingly, mice treated with 10 µg/kg rLeptin and 5 mg/kg cocaine showed much higher locomotion activity in the center of the open-field, as shown in Table 3, indicat-ing that this specific dose combination of the hormone and cocaine might have an anxio-lytic effect (F(9,64) = 2,249, P = 0.030).
Plus-maze test
In the experiment with the plus-maze test, cocaine induced a statistically signifi-cant decrease in total number of closed arm visits (F(3,67) = 5.760, P = 0.001) and total
time spent in closed arms (F(3,67) = 3.500, P =
0.020)and also increased total time spent in the open arms (F(3,67) = 4.757, P = 0.005)as
seen in Table 2.
An interaction between cocaine and leptin treatments was observed (F(9,64) = 2.129, P =
0.040) as shown in Table 4. Cocaine also
interfered withtotal time spent in the closed arms (F(3,63) = 4.925, P = 0.004) and total time
spent in the open arms (F(3,63) = 5.190, P =
0.003) in Experiment 2. In Experiment 2, cocaine induced the same overall effects, also decreasing total number of closed arm visits (F(3,63) = 3.487, P = 0.021). The percent time
spent in the open arms increased with the
increase in leptin dose (Table 5), and percent entries into the open arms reached peak values at 20 µg/kg rLeptin with cocaine.
Interaction between cocaine and the hor-monal condition was observed for some be-haviors. High-fat-fed mice showed higher stretching frequencies, except for 20 mg/kg cocaine, while in Experiment 2, mice receiv-ing 20 µg/kg leptin showed increasreceiv-ing stretch-ing frequencies as cocaine doses increased to 20 mg/kg.
Forced swimming test
In Experiment 1, the group of animals that received a high-fat diet spent less time in immobility (F(1,68) = 7.834, P = 0.007; Table 6)
and more time swimming (F(1,68) = 6.524, P =
0.013; Table 6), and also presented an incre-ment in the frequency of swimming (F(1, 68) =
6.870, P = 0.011; Table 6) when compared to the group of animals maintained on a balanced diet. In Experiment 2, mice receiving 20 mg/ kg cocaine spent less time in immobility and more time in climbing as leptin doses in-creased (Table 7). Mice that received a high-fat diet showed higher swimming frequencies (F(1,68) = 6.870, P = 0.011) than mice fed a
balanced diet (Table 6). In the second
experi-Table 4. Evaluation of the anxiolytic effects of a balanced or high-fat diet in mice exposed to cocaine. Plus-maze test (experiment 1).
Diet and treatment Open-arm % Open-arm Closed arm Time % Time Time Head- Stretching Grooming entries entries entries open arms open arms closed arms dipping
High-fat diet
Control 2.89 ± 2.52 32 5.33 ± 4.33 88.44 ± 69.93 29 179.22 ± 65.68 25.44 ± 18.90 43.67 ± 28.20 18.78 ± 15.40 Cocaine 5 mg/kg 4.89 ± 1.36 48 5.22 ± 2.33 135.56 ± 86.22 45 138.33 ± 73.79 26.67 ± 20.71 61.56 ± 45.99 14.56 ± 9.23 Cocaine 10 mg/kg 5.25 ± 2.31 54 4.50 ± 2.14 113.13 ± 70.94 38 136.25 ± 64.96 17.63 ± 6.46 53.63 ± 26.69 11.25 ± 6.82 Cocaine 20 mg/kg 3.50 ± 2.01 54 3.00 ± 1.41 172.30 ± 79.12 57 110.50 ± 81.19 14.60 ± 13.48 80.20 ± 41.38 13.40 ± 10.13
Balanced diet
Control 3.67 ± 3.87 45 4.56 ± 3.47 44.33 ± 72.41 15 207.89 ± 89.95 30.89 ± 16.46 22.22 ± 31.83 15.00 ± 11.52 Cocaine 5 mg/kg 6.20 ± 6.39 48 6.70 ± 2.95 110.00 ± 100.55 37 137.00 ± 78.95 27.80 ± 22.64 42.50 ± 43.69 6.30 ± 7.69 Cocaine 10 mg/kg 4.10 ± 2.69 55 3.30 ± 1.95 110.80 ± 95.47 37 169.20 ± 100.05 27.10 ± 19.09 50.30 ± 50.69 12.30 ± 9.82 Cocaine 20 mg/kg 4.40 ± 5.56 69 2.00 ± 2.16 179.60 ± 123.77 60 98.00 ± 114.45 11.00 ± 12.27 119.50 ± 117.68 8.90 ± 13.49
P Treatment 0.001 0.005 0.020 0.026 0.004
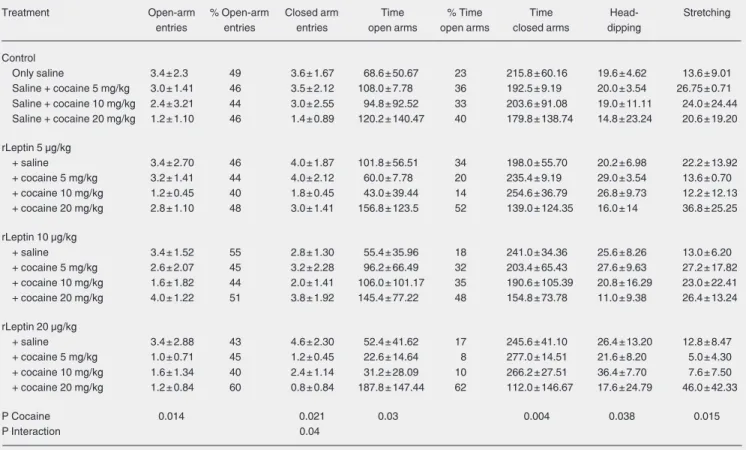
Table 5. Evaluation of the anxiolytic effects of different recombinant leptin (rLeptin) doses in mice exposed to cocaine. Plus-maze test (experiment 2).
Treatment Open-arm % Open-arm Closed arm Time % Time Time Head- Stretching
entries entries entries open arms open arms closed arms dipping
Control
Only saline 3.4 ± 2.3 49 3.6 ± 1.67 68.6 ± 50.67 23 215.8 ± 60.16 19.6 ± 4.62 13.6 ± 9.01
Saline + cocaine 5 mg/kg 3.0 ± 1.41 46 3.5 ± 2.12 108.0 ± 7.78 36 192.5 ± 9.19 20.0 ± 3.54 26.75 ± 0.71 Saline + cocaine 10 mg/kg 2.4 ± 3.21 44 3.0 ± 2.55 94.8 ± 92.52 33 203.6 ± 91.08 19.0 ± 11.11 24.0 ± 24.44 Saline + cocaine 20 mg/kg 1.2 ± 1.10 46 1.4 ± 0.89 120.2 ± 140.47 40 179.8 ± 138.74 14.8 ± 23.24 20.6 ± 19.20
rLeptin 5 µg/kg
+ saline 3.4 ± 2.70 46 4.0 ± 1.87 101.8 ± 56.51 34 198.0 ± 55.70 20.2 ± 6.98 22.2 ± 13.92
+ cocaine 5 mg/kg 3.2 ± 1.41 44 4.0 ± 2.12 60.0 ± 7.78 20 235.4 ± 9.19 29.0 ± 3.54 13.6 ± 0.70 + cocaine 10 mg/kg 1.2 ± 0.45 40 1.8 ± 0.45 43.0 ± 39.44 14 254.6 ± 36.79 26.8 ± 9.73 12.2 ± 12.13 + cocaine 20 mg/kg 2.8 ± 1.10 48 3.0 ± 1.41 156.8 ± 123.5 52 139.0 ± 124.35 16.0 ± 14 36.8 ± 25.25
rLeptin 10 µg/kg
+ saline 3.4 ± 1.52 55 2.8 ± 1.30 55.4 ± 35.96 18 241.0 ± 34.36 25.6 ± 8.26 13.0 ± 6.20
+ cocaine 5 mg/kg 2.6 ± 2.07 45 3.2 ± 2.28 96.2 ± 66.49 32 203.4 ± 65.43 27.6 ± 9.63 27.2 ± 17.82 + cocaine 10 mg/kg 1.6 ± 1.82 44 2.0 ± 1.41 106.0 ± 101.17 35 190.6 ± 105.39 20.8 ± 16.29 23.0 ± 22.41 + cocaine 20 mg/kg 4.0 ± 1.22 51 3.8 ± 1.92 145.4 ± 77.22 48 154.8 ± 73.78 11.0 ± 9.38 26.4 ± 13.24
rLeptin 20 µg/kg
+ saline 3.4 ± 2.88 43 4.6 ± 2.30 52.4 ± 41.62 17 245.6 ± 41.10 26.4 ± 13.20 12.8 ± 8.47
+ cocaine 5 mg/kg 1.0 ± 0.71 45 1.2 ± 0.45 22.6 ± 14.64 8 277.0 ± 14.51 21.6 ± 8.20 5.0 ± 4.30 + cocaine 10 mg/kg 1.6 ± 1.34 40 2.4 ± 1.14 31.2 ± 28.09 10 266.2 ± 27.51 36.4 ± 7.70 7.6 ± 7.50 + cocaine 20 mg/kg 1.2 ± 0.84 60 0.8 ± 0.84 187.8 ± 147.44 62 112.0 ± 146.67 17.6 ± 24.79 46.0 ± 42.33
P Cocaine 0.014 0.021 0.03 0.004 0.038 0.015
P Interaction 0.04
Data are reported as frequency, percent or time in seconds (means ± SD). All behavior parameters of each experiment were analyzed with two-way ANOVA. Subgroup analysis was performed with the Student-Newman-Keuls test.
Table 6. Behavioral evaluation of the antidepressant activities of a balanced or high-fat diet in mice exposed to cocaine. Forced swimming test (experiment 1).
Diet and treatment Climbing Swimming Immobilization Time Time Time Latency
climbing swimming immobilization
High-fat diet
Control 5.80 ± 3.77 8.95 ± 6.91 6.55 ± 3.88 72.30 ± 32.53 39.00 ± 34.31 119.15 ± 60.65 63.50 ± 49.87 Cocaine 5 mg/kg 7.11 ± 7.40 12.17 ± 6.95 8.61 ± 3.63 64.33 ± 27.86 50.83 ± 36.12 114.89 ± 52.66 58.00 ± 47.85 Cocaine 10 mg/kg 6.94 ± 4.18 8.81 ± 5.11 7.38 ± 4.71 101.88 ± 59.80 28.50 ± 18.82 90.19 ± 62.22 65.63 ± 65.62 Cocaine 20 mg/kg 7.35 ± 6.55 8.50 ± 5.64 6.40 ± 4.13 109.75 ± 63.70 28.55 ± 18.27 85.95 ± 64.38 87.90 ± 57.57
Balanced diet
Control 5.39 ± 3.28 5.39 ± 2.86 6.56 ± 2.72 66.89 ± 64.38 17.44 ± 7.48 138.50 ± 65.02 84.00 ± 28.65 Cocaine 5 mg/kg 4.30 ± 4.10 6.60 ± 3.49 7.00 ± 2.91 39.00 ± 41.83 29.10 ± 14.13 167.50 ± 46.37 33.22 ± 38.86 Cocaine 10 mg/kg 4.75 ± 4.04 6.65 ± 3.12 7.35 ± 3.07 68.00 ± 58.81 24.80 ± 11.38 145.40 ± 75.87 37.11 ± 41.92 Cocaine 20 mg/kg 8.75 ± 5.87 7.80 ± 3.83 8.95 ± 3.37 86.10 ± 56.92 24.50 ± 15.34 120.45 ± 69.23 69.11 ± 27.00
P Diet 0.011 0.013 0.007 P Treatment 0.047
ment, mice receiving 20 µg/kg leptin and mice receiving no leptin dose showed closely simi-lar swimming frequencies until the adminis-tration of 10 mg/kg cocaine, when mice re-ceiving no leptin showed increased values and mice receiving the highest leptin dose showed decreased values when exposed to the same dose of cocaine.
Discussion
In rodents, high-fat intake may be associ-ated with increased serum leptin and obe-sity, and these leptin levels are related to the amount of body lipid (13,29). It was our objective to compare data for high-fat-fed mice with those for mice receiving a dose of rLeptin, in behavioral tests in order to detect changes in animal behavior due to leptin.
In contrast to other methods used to study anxious behavior in rodents, such as the el-evated plus-maze, the open-field test allows a comprehensive description of the animal’s behavior, since more behaviors can be readily observed and quantified (30,31). Locomotion, a behavioral that can be interpreted as an adaptation to a stressful situation, was affected by an interaction between high-fat or balanced diets and cocaine or saline treatments in the first experiment. In Experiment 1, high-fat-fed mice showed a lower value of increased locomotion when receiving 20 mg/kg cocaine. In Experiment 2, mice that had received co-caine also showed significant hyperactivity and leptin decreased this effect. Therefore, the results demonstrate that mice treated with co-caine display higher locomotion and that a high-fat diet or leptin treatment decrease this
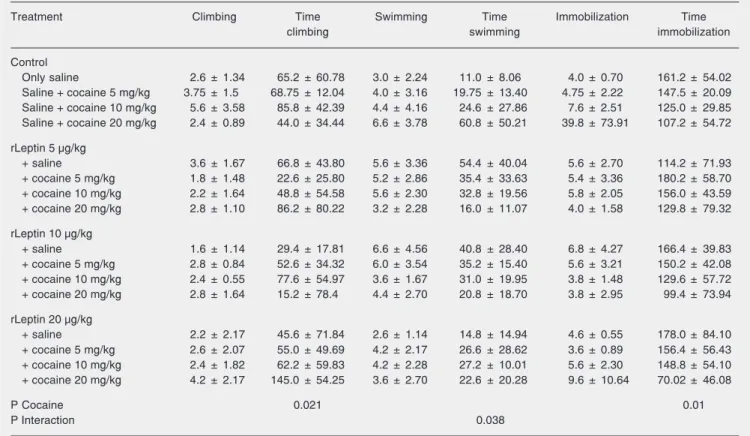
Table 7. Behavioral evaluation of the antidepressant activities of different doses of recombinant leptin (rLeptin) in mice exposed to cocaine. Forced swimming test (experiment 2).
Treatment Climbing Time Swimming Time Immobilization Time
climbing swimming immobilization
Control
Only saline 2.6 ± 1.34 65.2 ± 60.78 3.0 ± 2.24 11.0 ± 8.06 4.0 ± 0.70 161.2 ± 54.02
Saline + cocaine 5 mg/kg 3.75 ± 1.5 68.75 ± 12.04 4.0 ± 3.16 19.75 ± 13.40 4.75 ± 2.22 147.5 ± 20.09 Saline + cocaine 10 mg/kg 5.6 ± 3.58 85.8 ± 42.39 4.4 ± 4.16 24.6 ± 27.86 7.6 ± 2.51 125.0 ± 29.85 Saline + cocaine 20 mg/kg 2.4 ± 0.89 44.0 ± 34.44 6.6 ± 3.78 60.8 ± 50.21 39.8 ± 73.91 107.2 ± 54.72
rLeptin 5 µg/kg
+ saline 3.6 ± 1.67 66.8 ± 43.80 5.6 ± 3.36 54.4 ± 40.04 5.6 ± 2.70 114.2 ± 71.93
+ cocaine 5 mg/kg 1.8 ± 1.48 22.6 ± 25.80 5.2 ± 2.86 35.4 ± 33.63 5.4 ± 3.36 180.2 ± 58.70 + cocaine 10 mg/kg 2.2 ± 1.64 48.8 ± 54.58 5.6 ± 2.30 32.8 ± 19.56 5.8 ± 2.05 156.0 ± 43.59 + cocaine 20 mg/kg 2.8 ± 1.10 86.2 ± 80.22 3.2 ± 2.28 16.0 ± 11.07 4.0 ± 1.58 129.8 ± 79.32
rLeptin 10 µg/kg
+ saline 1.6 ± 1.14 29.4 ± 17.81 6.6 ± 4.56 40.8 ± 28.40 6.8 ± 4.27 166.4 ± 39.83
+ cocaine 5 mg/kg 2.8 ± 0.84 52.6 ± 34.32 6.0 ± 3.54 35.2 ± 15.40 5.6 ± 3.21 150.2 ± 42.08 + cocaine 10 mg/kg 2.4 ± 0.55 77.6 ± 54.97 3.6 ± 1.67 31.0 ± 19.95 3.8 ± 1.48 129.6 ± 57.72 + cocaine 20 mg/kg 2.8 ± 1.64 15.2 ± 78.4 4.4 ± 2.70 20.8 ± 18.70 3.8 ± 2.95 99.4 ± 73.94
rLeptin 20 µg/kg
+ saline 2.2 ± 2.17 45.6 ± 71.84 2.6 ± 1.14 14.8 ± 14.94 4.6 ± 0.55 178.0 ± 84.10
+ cocaine 5 mg/kg 2.6 ± 2.07 55.0 ± 49.69 4.2 ± 2.17 26.6 ± 28.62 3.6 ± 0.89 156.4 ± 56.43 + cocaine 10 mg/kg 2.4 ± 1.82 62.2 ± 59.83 4.2 ± 2.28 27.2 ± 10.01 5.6 ± 2.30 148.8 ± 54.10 + cocaine 20 mg/kg 4.2 ± 2.17 145.0 ± 54.25 3.6 ± 2.70 22.6 ± 20.28 9.6 ± 10.64 70.02 ± 46.08
P Cocaine 0.021 0.01
P Interaction 0.038
behavioral effect (32). This could be inter-preted as an antagonism of leptin against the effects of cocaine. It might be suggested that the effect of leptin is an adaptation to stressful situations.
Grooming behavior might also be con-sidered to be an index of behavioral adapta-tion to a stressful situaadapta-tion. Increased groom-ing behavior has been related to fear or an increased emotional response, and has been associated with conflict or frustration in dif-ferent species. As a manifestation of emo-tionality, grooming can be decreased when a very intense excitation is presented, being replaced by freezing (33) and therefore this reduction could be the result of excitation (that promotes an increase in locomotor ac-tivity) or of an intense anxiety/fear (that promotes freezing behaviors). Cocaine treat-ment induces an increase in grooming, but this effect was dependent on the diet. The mice fed a high-fat diet displayed lower frequencies of grooming compared to mice fed a balanced diet. Mice that received any dose of cocaine but no leptin showed higher grooming values, but after they receive 10 µg/kg leptin these values fell, pointing to an antagonistic action of leptin in decreasing this variable. Leptin treatment also decreased grooming behaviors after cocaine treatment. All of these results point to a possible anxio-lytic effect of leptin in the open-field test.
In the elevated plus-maze test, anxiolytic compounds selectively increased the per-cent of time spent and/or entries into the open arms and, in contrast, anxiogenic com-pounds selectively decreased percent time spent and/or percentage of entries into the open arms (28,34). As pointed out by Rogerio and Takahashi (35) in their experiment about the anxiogenic action of cocaine in mice, the ability of cocaine to induce anxiogenic ef-fects in mice may depend, at least in part, on the animals’ emotional state. They proposed that repeated handling made animals less anxious and more susceptible to the anxio-genic effects of cocaine. They concluded
that a single cocaine injection induces anx-iogenic-like effects in handling-habituated mice, while repeated injections of the drug did not alter the indices of anxiety as meas-ured in the elevated plus-maze. This could be the case for our mice on special diets that were handled every two or three days. How-ever, our animals showed the opposite effect with cocaine - an “anxiolytic” effect in mice on a high-fat diet or receiving leptin spent more time in the open arms. Also important to note is that the anxiolytic effect of leptin became more evident in those animals ex-posed to the highest dose of cocaine, i.e., lower values in mice treated only with leptin, and the percent time spent in the open arms increasing progressively with increasing leptin doses. This effect has been rarely reported by other laboratories, but has been seen with Wistar rats in our laboratory (Loebens M and Barros HMT, unpublished data) on other occasions. The explanation for this effect still needs to be determined. We believe that cocaine decreases risk evalu-ation by the animals and induces open-arm entries in spite of the risk involved, due to the impulsivity-induced effect. Leptin per se does not increase the percentage of entries into the open arms, but when mice received increasing doses of cocaine, this behavior became more evident, reaching peak values at 20 µg/kg leptin.
Frederich and co-workers (29) demon-strated that a high-fat diet evokes a sustained increase in circulating leptin in both normal and transgenic mice, and high levels of leptin have been shown to increase energy expen-diture. However, it is important to point out that, when animals on each diet type were divided into two groups - above or below the mean weight gain of control animals - no differences in behavior were detected be-tween these groups.
Leptin exerts its action through several other hormones in a cascade of reactions involving, for example, cocaine- and am-phetamine-regulated transcripts (CART). These CART peptides are neurotransmitters that have received much attention as media-tors of feeding behavior and body weight regulation in mammals, and animal studies have demonstrated that CART expression is regulated by both leptin and glucocorticoids (38). CART have also been implicated in the behavioral and neuroendocrine effects of leptin (39).
On the other hand, CART peptides have a role in drug abuse. They are found in key brain regions associated with reward/rein-forcement such as the ventral tegmental area (VTA), ventral pallidum, amygdala, lateral hypothalamus, and nucleus accumbens. CART mRNA levels were changed in the VTA of cocaine overdose victims, showing that cocaine affects CART in animals and also in humans and supporting a role for CART-cocaine interactions in humans. It is important to note that injection of CART peptides into the VTA caused a small in-crease in locomotor activity and promoted conditioned place preference, suggesting that CART has psychostimulant-like effects. However, co-treatment of the animals with both intra-VTA CART and systemic cocaine
produced only partially additive effects, and this additivity seemed to occur at lower con-centrations of the drugs. At higher doses, CART tended to oppose the locomotor ac-tivity induced by systemic cocaine, acting as a functional “partial agonist” in the VTA (40). This could explain why, in the present study, rats fed a high-fat diet or treated with rLeptin showed less hyperactivity in loco-motion and exploration in the open-field test when they received 20 mg/kg cocaine. Also, we observed an increased anxiolytic effect as shown by an increase in percent time spent in the open arms in the elevated plus-maze test with increasing doses of cocaine and leptin. Mice that had received cocaine and no leptin showed higher locomotion values. Thus, we may conclude that leptin can change the effects of cocaine in mice by increasing CART expression, as reported in other studies.
We have demonstrated that animals ex-posed to high leptin levels evoked by a high-fat diet or to rLeptin treatment can change the behavioral effects induced by cocaine in ethologic tests that measure degrees of anxi-ety and depression. Further studies are nec-essary to validate these findings and estab-lish a link between cocaine effects and nutri-tional status in humans.
Acknowledgments
References
1. Kalra SP, Dube MG, Pu S, Xu B, Horvath TL, Kalra PS. Interacting appetite-regulating pathways in the hypothalamic regulation of body weight. Endocr Rev 1999; 20: 68-100.
2. Harris RB, Zhou J, Redmann SM Jr, Smagin GN, Smith SR, Rodgers E, et al. A leptin dose-response study in obese (ob/ob) and lean (+/ ?) mice. Endocrinology 1998; 139: 8-19.
3. Inui A. Feeding and body-weight regulation by hypothalamic neu-ropeptides - mediation of the actions of leptin. Trends Neurosci 1999; 22: 62-67.
4. Prolo P, Wong ML, Licinio J. Leptin. Int J Biochem Cell Biol 1998; 30: 1285-1290.
5. Buchanan C, Mahesh V, Zamorano P, Brann D. Central nervous system effects of leptin. Trends Endocrinol Metab 1998; 9 (Suppl IV): 146-150.
6. Rodrigues AM, Boguszewski CL. Hormônios e neurotransmissores na regulação da ingestão alimentar. Arq Bras Endocrinol Metabol 1999; 43 (Suppl II): S41B-S47B.
7. Marti A, Berraondo B, Martinez JA. Leptin: physiological actions. J Physiol Biochem 1999; 55: 43-49.
8. O’Neill L. A role for leptin in autoimmunity? Trends Pharmacol Sci 2001; 22: 341.
9. Caprio M, Fabbrini E, Isidori AM, Aversa A, Fabbri A. Leptin in reproduction. Trends Endocrinol Metab 2001; 12: 65-72.
10. Antonijevic IA, Murck H, Frieboes RM, Horn R, Brabant G, Steiger A. Elevated nocturnal profiles of serum leptin in patients with depres-sion. J Psychiatr Res 1998; 32: 403-410.
11. Weigle DS, Duell PB, Connor WE, Steiner RA, Soules MR, Kuijper JL. Effect of fasting, refeeding, and dietary fat restriction on plasma leptin levels. J Clin Endocrinol Metab 1997; 82: 561-565.
12. Auwerx J, Staels B. Leptin. Lancet 1998; 351: 737-742.
13. Lagiou P, Signorello LB, Mantzoros CS, Trichopoulos D, Hsieh CC, Trichopoulou A. Hormonal, lifestyle, and dietary factors in relation to leptin among elderly men. Ann Nutr Metab 1999; 43: 23-29. 14. Hohmann JG, Teklemichael DN, Weinshenker D, Wynick D, Clifton
DK, Steiner RA. Obesity and endocrine dysfunction in mice with deletions of both neuropeptide Y and galanin. Mol Cell Biol 2004; 24: 2978-2985.
15. Clapham JC, Arch JR, Tadayyon M. Anti-obesity drugs: a critical review of current therapies and future opportunities. Pharmacol Ther 2001; 89: 81-121.
16. Leibowitz SF, Alexander JT. Hypothalamic serotonin in control of eating behavior, meal size, and body weight. Biol Psychiatry 1998; 44: 851-864.
17. Korner J, Chua SC Jr, Williams JA, Leibel RL, Wardlaw SL. Regula-tion of hypothalamic proopiomelanocortin by leptin in lean and obese rats. Neuroendocrinology 1999; 70: 377-383.
18. Suomalainen M, Mannisto PT. Lack of effect of leptin on the behav-iour of mice predicting the level of anxiety and depression. Pharmacol Toxicol 1998; 83: 139-142.
19. Asakawa A, Inui A, Inui T, Katsuura G, Fujino MA, Kasuga M. Leptin treatment ameliorates anxiety in ob/ob obese mice. J Diabetes Complications 2003; 17: 105-107.
20. Galduroz JC, Noto AR, Nappo SA, Carlini EA. Trends in drug use among students in Brazil: analysis of four surveys in 1987, 1989, 1993 and 1997. Braz J Med Biol Res 2004; 37: 523-531.
21. Blednov YA, Walker D, Harris RA. Blockade of the leptin-sensitive pathway markedly reduces alcohol consumption in mice. Alcohol
Clin Exp Res 2004; 28: 1683-1692.
22. Ministério da Saúde (Brazil). Coordenação-Geral da Política de Ali-mentação e Nutrição. http://dtr2004.saude.gov.br/nutricao/sobre peso.php. Accessed October 12, 2005.
23. Considine RV, Caro JF. Leptin: genes, concepts and clinical per-spective. Horm Res 1996; 46: 249-256.
24. Miller NS, Gold MS, Smith DE. Manual of therapeutics for addic-tions. 1st edn. New York: Johns Wiley & Sons Inc.; 1997.
25. Lin S, Thomas TC, Storlien LH, Huang XF. Development of high fat diet-induced obesity and leptin resistance in C57Bl/6J mice. Int J Obes Relat Metab Disord 2000; 24: 639-646.
26. Ahren B, Baldwin RM, Havel PJ. Pharmacokinetics of human leptin in mice and rhesus monkeys. Int J Obes Relat Metab Disord 2000; 24: 1579-1585.
27. Harro J. Measurement of exploratory behavior in rodents. J Neurosci Methods 1993; 14: 359-377.
28. Andreatini R, Bacellar LF. The relationship between anxiety and depression in animal models: a study using the forced swimming test and elevated plus-maze. Braz J Med Biol Res 1999; 32: 1121-1126.
29. Frederich RC, Hamann A, Anderson S, Lollmann B, Lowell BB, Flier JS. Leptin levels reflect body lipid content in mice: evidence for diet-induced resistance to leptin action. Nat Med 1995; 1: 1311-1314. 30. Stout JC, Weiss JM. An animal model for measuring behavioral
responses to anxiogenic and anxiolytic manipulations. Pharmacol Biochem Behav 1994; 47: 459-465.
31. Rodgers RJ, Cao BJ, Dalvi A, Holmes A. Animal models of anxiety: an ethological perspective. Braz J Med Biol Res 1997; 30: 289-304. 32. Buyse M, Bado A, Dauge V. Leptin decreases feeding and explor-atory behaviour via interactions with CCK(1) receptors in the rat. Neuropharmacology 2001; 40: 818-825.
33. Barros HM, Tannhauser SL, Tannhauser MA, Tannhauser M. The effects of GABAergic drugs on grooming behaviour in the open field. Pharmacol Toxicol 1994; 74: 339-344.
34. Lister RG. The use of a plus-maze to measure anxiety in the mouse. Psychopharmacology 1987; 92: 180-185.
35. Rogerio R, Takahashi RN. Anxiogenic action of acute but not re-peated cocaine administration in handling-habituated mice in the plus-maze test. Braz J Med Biol Res 1992; 25: 713-716.
36. Collin M, Hakansson-Ovesjo ML, Misane I, Ogren SO, Meister B. Decreased 5-HT transporter mRNA in neurons of the dorsal raphe nucleus and behavioral depression in the obese leptin-deficient ob/ ob mouse. Brain Res Mol Brain Res 2000; 81: 51-61.
37. Kraus T, Haack M, Schuld A, Hinze-Selch D, Pollmacher T. Low leptin levels but normal body mass indices in patients with depres-sion or schizophrenia. Neuroendocrinology 2001; 73: 243-247. 38. Hunter RG, Philpot K, Vicentic A, Dominguez G, Hubert GW, Kuhar
MJ. CART in feeding and obesity. Trends Endocrinol Metab 2004; 15: 454-459.
39. McAlister ED, Van Vugt DA. Effect of leptin administration versus re-feeding on hypothalamic neuropeptide gene expression in fasted male rats. Can J Physiol Pharmacol 2004; 82: 1128-1134. 40. Kuhar MJ, Jaworski JN, Hubert GW, Philpot KB, Dominguez G.