Decreasing FoxO3a and Increasing PGC-1
a
in
ob/ob
Mice
Neira Sa´inz1,3, Amaia Rodrı´guez1,3, Victoria Catala´n1,3, Sara Becerril1,3, Beatriz Ramı´rez1,3, Javier Go´mez-Ambrosi1,3, Gema Fru¨hbeck1,2,3*
1Metabolic Research Laboratory, University of Navarra, Pamplona, Spain,2Department of Endocrinology, Clı´nica Universidad de Navarra, Pamplona, Spain,3CIBER Fisiopatologı´a de la Obesidad y Nutricio´n (CIBEROBN), Instituto de Salud Carlos III, Madrid, Spain
Abstract
Absence of leptin has been associated with reduced skeletal muscle mass in leptin-deficientob/ob mice. The aim of our
study was to examine the effect of leptin on the catabolic and anabolic pathways regulating muscle mass. Gastrocnemius, extensor digitorum longus and soleus muscle mass as well as fiber size were significantly lower inob/obmice compared to
wild type littermates, being significantly increased by leptin administration (P,0.001). This effect was associated with an
inactivation of the muscle atrophy-related transcription factor forkhead box class O3 (FoxO3a) (P,0.05), and with a decrease in the protein expression levels of the E3 ubiquitin-ligases muscle atrophy F-box (MAFbx) (P,0.05) and muscle RING finger 1 (MuRF1) (P,0.05). Moreover, leptin increased (P,0.01) protein expression levels of peroxisome proliferator-activated receptorccoactivator-1a(PGC-1a), a regulator of muscle fiber type, and decreased (P,0.05) myostatin protein, a negative regulator of muscle growth. Leptin administration also activated (P,0.01) the regulators of cell cycle progression proliferating cell nuclear antigen (PCNA) and cyclin D1, and increased (P,0.01) myofibrillar protein troponin T. The present study provides evidence that leptin treatment may increase muscle mass ofob/obmice by inhibiting myofibrillar protein degradation as well as enhancing muscle cell proliferation.
Citation:Sa´inz N, Rodrı´guez A, Catala´n V, Becerril S, Ramı´rez B, et al. (2009) Leptin Administration Favors Muscle Mass Accretion by Decreasing FoxO3a and Increasing PGC-1ainob/obMice. PLoS ONE 4(9): e6808. doi:10.1371/journal.pone.0006808
Editor:Jose A. L. Calbet, University of Las Palmas de Gran Canaria, Spain ReceivedApril 1, 2009;AcceptedJuly 31, 2009;PublishedSeptember 4, 2009
Copyright:ß2009 Sainz et al. This is an open-access article distributed under the terms of the Creative Commons Attribution License, which permits unrestricted use, distribution, and reproduction in any medium, provided the original author and source are credited.
Funding:NS was recipient of a fellowship for specialist training from the Department of Industry of the Gobierno de Navarra of Spain. This work was supported by grants from the Fundacion Mutua Madrilena to GF; from the Instituto de Salud Carlos III, Fondo de Investigacion Sanitaria (FIS) del Ministerio de Sanidad y Consumo to GF and JG-A; and from the Department of Health of the Gobierno de Navarra of Spain to GF and JG-A CIBER de Fisiopatologia de la Obesidad y Nutricion (CIBEROBN) is an initiative of the Instituto de Salud Carlos III, Spain. The funders had no role in study design, data collection and analysis, decision to publish, or preparation of the manuscript.
Competing Interests:The authors have declared that no competing interests exist. * E-mail: [email protected]
Introduction
Leptin, the product of theobgene, is a hormone that acts as an afferent signal in a negative-feedback loop regulating the size of adipose tissue mass [1]. In addition to its function as a satiety factor, leptin regulates several physiological processes, such as glucose and lipid metabolism, immunity, reproduction and blood pressure homeostasis [2,3]. Skeletal muscle also constitutes an important target for leptin [3,4]. Several studies have reported that leptin-deficientob/obmice display a reduced skeletal muscle mass [5] compared with their lean littermates. However, the mecha-nisms whereby leptin regulates muscle growth are poorly understood.
Skeletal muscle mass and composition are critical for exercise, energy expenditure and glucose metabolism. Although the underlying mechanisms involved in the development of muscle atrophy are poorly understood, an imbalance between protein breakdown and synthesis, in favour of the former, plays an important role in this process [6]. The ubiquitin-proteasome system (UPS) is critical for the specific degradation of cellular proteins, being the main proteolytic system for protein breakdown in muscular atrophy. UPS induces the expression of the ubiquitin ligases E3 muscle atrophy F-box (MAFbx, also known as atrogin-1) and muscle RING finger-1 (MuRF1). These ubiquitin ligases
target proteins with a ubiquitin chain to be subsequently degraded within the proteasome complex to peptides [7]. Both MAFbx and MuRF1 have been shown to be up-regulated in different models of atrophy, conferring them the status of muscle atrophy markers [8,9]. Another key mediator in protein breakdown during atrophy is the forkhead box class O (FoxO) family of transcription factors [10]. In this sense, FoxO1 and FoxO3a, which are highly expressed in skeletal muscle, induce muscle mass loss by increasing the expression of MAFbx and MuRF1 [11–13], by inhibiting muscle growth and differentiation [14] and by impairing the progression of the cell cycle [15]. On the other hand, the enhancement of overall protein breakdown is blocked by the Akt signaling pathway. In its phosphorylated active form, Akt triggers the phosphorylation/inactivation of FoxO transcription factors, sequestering them to the cytosol, where they are unable to activate transcription of MAFbx and MuRF1 [16]. Nonetheless, under certain conditions, the regulation of Akt and FoxO seems to be independent of each other [17,18]. Recently, it has been reported that peroxisome proliferator-activated receptor coactivator 1a (PGC-1a) also constitutes an important mediator of muscle mass down-regulating the expression levels and activity of FoxO3a and, hence, inhibiting muscle atrophy [19].
revert the obese and diabetic phenotype ofob/obmice [20]. Thus, the aim of our study was to examine the catabolic and anabolic pathways involved in the regulation of muscle mass ofob/obmice, and whether leptin administration normalizes the reduced skeletal muscle mass of leptin-deficient animals through FoxO-dependent mechanisms. Data of our study provide evidence that leptin treatment may increase muscle mass ofob/obmice by inhibiting muscular atrophy markers as well as enhancing positive regulators of muscle cell proliferation.
Results
Leptin Administration Increases Muscle Mass
As expected, undetectable serum leptin concentrations were found inob/obmice. Leptin administration increased leptin levels in wild type and ob/ob mice. Importantly, the determination of leptin was performed 20 hours after the last exogenous adminis-tration of the hormone and measured values were whitin the nanomolar range observed under physiological circumstances. In addition,ob/obmice used in our study were obese, hyperinsulin-emic, hyperglycemic and hyperlipidemic. Leptin treatment corrected the obese phenotype and improved glucose and lipid
metabolism ofob/obmice, independently of the inhibitory effect of leptin on food intake, as compared to the pair-fedob/ob group. Moreover, leptin also decreased body weight and fat mass of wild type mice independently of appetite reduction (Figure S1). The biochemical characteristics of wild type and ob/ob mice are reported in Table S1.
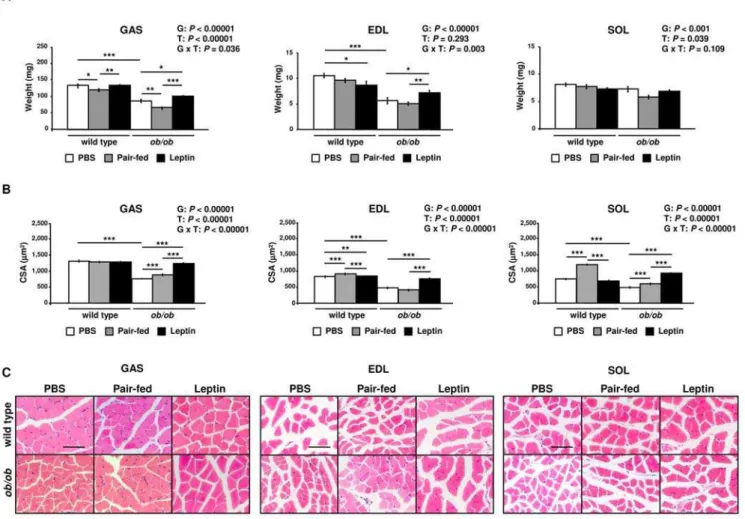
The weights of gastrocnemius (GAS) (P,0.0001), extensor digitorum longus (EDL) (P,0.0001) and soleus (SOL) (P,0.001) muscles were significantly lower inob/obmice as compared with
wild type, showing a strong effect of leptin deficiency on muscle mass (Figure 1). In addition, pair-feeding decreased the weight of GAS in wild type (P,0.05) and ob/ob (P,0.01) mice. Leptin treatment significantly increased GAS and EDL mass compared to control (P,0.05) and pair-fed (P,0.01) obese animals and prevented the SOL mass loss induced by pair-feeding in ob/ob
mice (P,0.05). Leptin administration also increased the weight of GAS muscle in wild type mice as compared to pair-fed animals (P,0.01). Curiously, the hormone reduced the weight of EDL in wild type mice (P,0.05). The cross-sectional area (CSA) of GAS, EDL and SOL muscle fibers was also decreased inob/obcompared to wild type animals (P,0.0001), a condition that was completely reverted by leptin treatment (P,0.0001). Surprisingly, pair-feeding
Figure 1. Leptin Increases Muscle Mass and Muscle Fiber Size ofob/obMice. (A)Gastrocnemius (GAS), extensor digitorum longus (EDL) and soleus (SOL) muscle weights of PBS (open), pair-fed (gray) and leptin-treated (closed) wild type andob/obmice (n = 9–10 per group). *P,0.05,
**P,0.01 and ***P,0.001.(B)Cross-sectional area (CSA) of GAS, EDL and SOL muscle fibers of PBS (open), pair-fed (gray) and leptin-treated (closed) wild type andob/obmice (approximately 100 fibers/muscle from 3 mice/group). **P,0.001 and ***P,0.0001.(C)Representative histological sections of hematoxylin-eosin-stained GAS, EDL and SOL muscles of wild type andob/obmice. Scale bars = 200mm. Results are presented as mean6SEM. G:
genotype, T: treatment.
increased CSA of EDL and SOL muscle fibers in wild type mice (P,0.0001), which was not observed in leptin-treated wild type mice. Therefore, our data show that leptin administration increases muscle mass and muscle fiber size ofob/obmice.
Gene Expression Profiles Reveal Significant Changes in Skeletal Muscle after Leptin Treatment
To investigate the effect of leptin on the catabolic and anabolic pathways involved in the regulation of the GAS muscle of wild type and ob/ob mice, their differential gene expression profiles were analyzed by microarray analysis. The hierarchical clustering of the gene expression profile in GAS muscle of wild type,ob/ob
and leptin-treatedob/obmice is shown in Figure S2. Microarray data showed 1,127 genes with differential expression (1.5-fold change) for leptin deficiency (wild type vs ob/ob; 51.5% up-regulated and 48.5% down-up-regulated genes), 1,546 genes for leptin administration (ob/ob vs leptin-treated ob/ob mice; 33.1% up-regulated and 66.9% down-up-regulated genes), and 1,960 for appetite inhibiting-independent effects of leptin (pair-fedob/ob vs
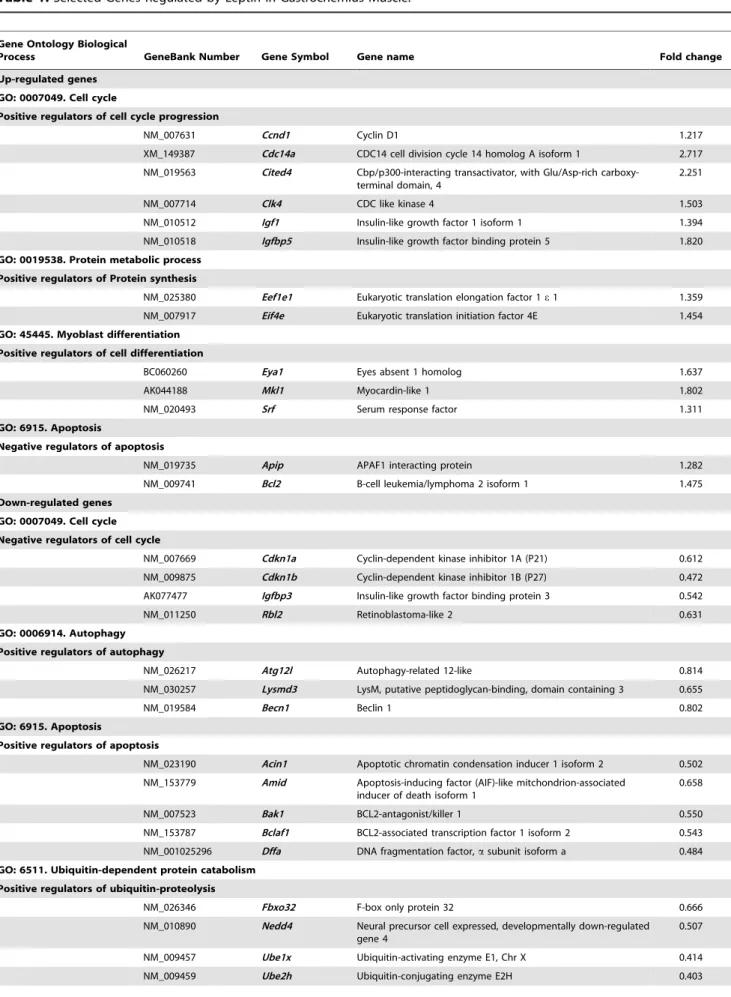
leptin-treated ob/ob group; 50.2% up-regulated and 49.8 down-regulated genes). The set of genes with altered expression levels induced by leptin deficiency and administration represents a broad spectrum of biological processes involved in muscle growth and atrophy, such as cell cycle progression, ubiquitin-proteolysis and apoptosis (Tables S2 and S3 in Supporting Information). Our study shows an up-regulation of positive regulators of muscle growth and cell cycle progression in GAS muscle of leptin-treated
ob/ob mice (Igf1, Igfbp5, Notch3, Ccnd1, Clk4, Cited4, Cdc14a), and myoblast differentiation (Eya1, Mkl1, Srf), whereas negative regulators of cell cycle progression, such asCdkn1a/p21, Cdkn1b/ p27Kip1orRbl2, were down-regulated by leptin administration in
ob/ob mice. Moreover, leptin treatment down-regulated the expression levels of positive regulators of ubiquitin proteolysis (Fbxo32/MAFbx, Need4, Ube2h, Ub1x), apoptosis (Acin1, Amid, Dffa, Bclaf1) and autophagy (Lysmd3, Becn1, Atg121) and up-regulated inhibitory factors of apoptosis (Apip, Bcl2) (Tables 1 and S2). Leptin administration also increased the gene expression levels of positive regulators of protein synthesis (Eif4e, Eefe1) and decreased the mRNA expression of inhibitors of protein synthesis (Gsk3b, Pten). Increased gene expression levels codifying for the contractile and sarcomeric proteins myosin (Myh1/Mhc2x, Myh2/Mhc2a, Myh7/ Mhc1, Myl3, Myl4), troponin (Tnni1, Tnnt1, Tnnc1), tropomyosin (Tpm3), nebulin (Neb) and titin (Ttn) were normalized by leptin treatment in ob/obmice (Tables 1 and S2). Furthermore, leptin prevented the up-regulation of positive regulators of ubiquitin proteolysis (Trim63/MuRF1, Fbxo32/MAFbx, Foxo1) and autophagy (Gabarap11) induced by pair-feeding in ob/ob mice (Table S3). Microarray data evidenced that leptin is an important regulator of the expression of genes involved in muscle growth and muscle atrophy. To confirm the microarray data, the mRNA expression of a number of representative transcripts involved in muscle growth and atrophy was analyzed by Real-Time PCR (Figure S3).
Leptin Administration Protects from Muscular Atrophy No differences in the transcript levels ofFoxo1 and Foxo3ain GAS muscle were detected between wild type andob/obmice, but a tendency towards a down-regulation of both transcription factors was found after leptin treatment (Figure S3).
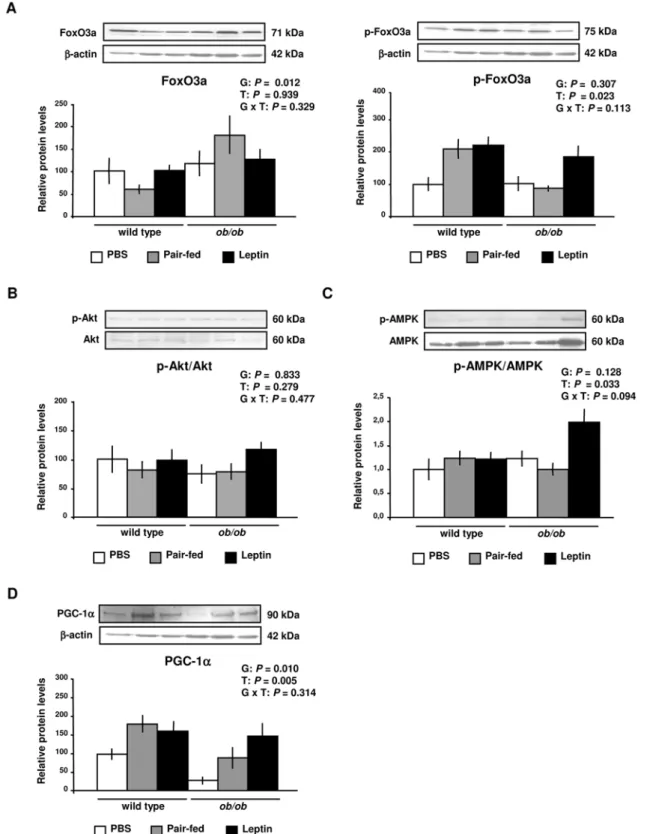
Nonetheless, at the protein level, the active form of FoxO3a was increased (P= 0.012) in ob/ob mice, with the phosphorylated-FoxO3a (inactive form) being increased by leptin administration (P= 0.023) in wild type andob/obmice (Figure 2A). Thus, since the activity of FoxO3a is inhibited by phosphorylation, data show that leptin reduces the functional form of this transcription factor in
GAS muscle of wild type andob/obmice. No effect of genotype (P= 0.833) or leptin treatment (P= 0.279) was observed on the activity of Akt in GAS muscle of experimental animals (Figure 2B). On the contrary, the activity of the AMP-activated protein kinase (AMPK) was increased by leptin treatment in ob/ob mice (P= 0.033) (Figure 2C). Gene expression studies showed a significant decrease (P,0.001) in Pgc-1a mRNA levels in GAS muscle ofob/obmice (Figure S3). The effect of leptin deficiency on PGC-1aprotein expression showed a similar pattern, being lower inob/obmice compared to wild type mice (P= 0.010). However, protein expression levels of PGC-1a were significantly increased (P= 0.005) by leptin administration in skeletal muscle of wild type andob/obmice (Figure 2D).
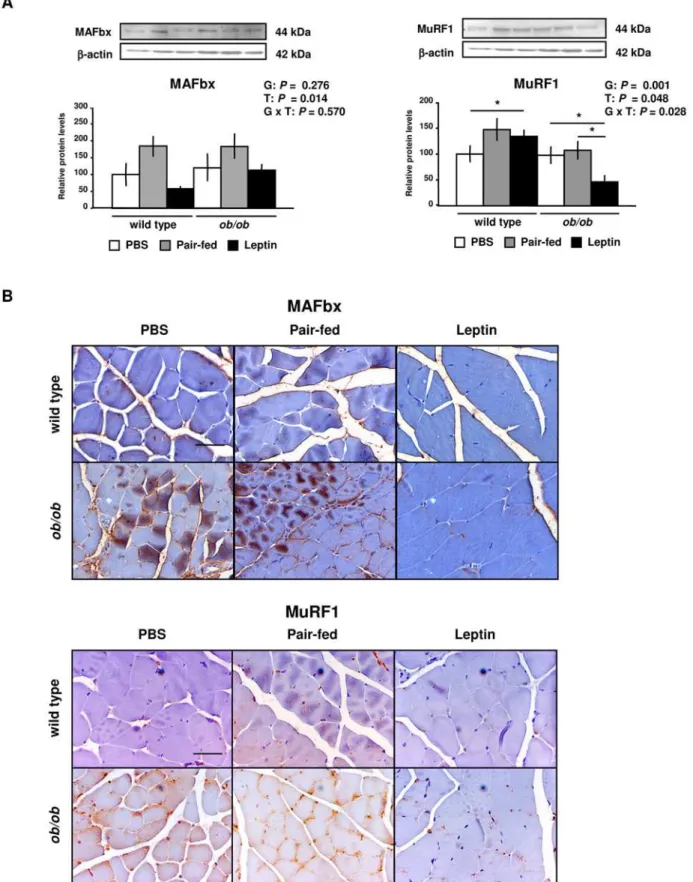
Leptin treatment decreased the mRNA expression levels of the atrophy marker MAFbx (P= 0.006) and tended to decrease MuRF1 in ob/ob mice, although no significant differences were found for the global effect of treatment (Figure S3 and Table S3). The protein content of MAFbx (P= 0.014) and MuRF1 (P= 0.021) was also reduced by leptin treatment in GAS muscle of wild type andob/obmice (Figure 3A). Since MAFbx and MuRF1 proteins have been associated with myofibrillar protein degradation, their tissue distribution was analyzed by immunohistochemical analysis. Fiber sections of GAS muscle showed higher sarcolemmal, cytosolic and nuclear immunoreactivity of MAFbx and MuRF1 inob/obmice as compared to wild type mice and, analogously to what happened with the protein content, were reduced in the leptin-treated ob/ob group (Figure 3B). Taken together, these results suggest that leptin administration decreases protein expression levels of the atrophy markers MAFbx and MuRFa in GAS muscle of wild type andob/obmice.
Leptin Treatment Enhances Skeletal Muscle Growth DNA microarray screening showed that leptin administration in
ob/obmice up-regulates genes involved in muscle growth and cell cycle in the GAS muscle (Table S2). We examined the effect of leptin on the protein expression of myostatin, a member of the transforming growth factor TGFbfamily, which acts as a negative regulator of muscle growth [21]. The mature form of myostatin (22 kDa) was almost undetectable in wild type mice. However, data showed a high protein expression of myostatin inob/obmice, which was reduced after leptin treatment as compared to theob/ob
(P= 0.026) and pair-fed ob/ob mice (P= 0.015) (Figure 4A), suggesting that leptin enhances muscle growth inob/obmice.
Table 1.Selected Genes Regulated by Leptin in Gastrocnemius Muscle.
Gene Ontology Biological
Process GeneBank Number Gene Symbol Gene name Fold change
Up-regulated genes GO: 0007049. Cell cycle
Positive regulators of cell cycle progression
NM_007631 Ccnd1 Cyclin D1 1.217
XM_149387 Cdc14a CDC14 cell division cycle 14 homolog A isoform 1 2.717
NM_019563 Cited4 Cbp/p300-interacting transactivator, with Glu/Asp-rich carboxy-terminal domain, 4
2.251
NM_007714 Clk4 CDC like kinase 4 1.503
NM_010512 Igf1 Insulin-like growth factor 1 isoform 1 1.394
NM_010518 Igfbp5 Insulin-like growth factor binding protein 5 1.820
GO: 0019538. Protein metabolic process Positive regulators of Protein synthesis
NM_025380 Eef1e1 Eukaryotic translation elongation factor 1e1 1.359 NM_007917 Eif4e Eukaryotic translation initiation factor 4E 1.454
GO: 45445. Myoblast differentiation Positive regulators of cell differentiation
BC060260 Eya1 Eyes absent 1 homolog 1.637
AK044188 Mkl1 Myocardin-like 1 1.802
NM_020493 Srf Serum response factor 1.311
GO: 6915. Apoptosis
Negative regulators of apoptosis
NM_019735 Apip APAF1 interacting protein 1.282
NM_009741 Bcl2 B-cell leukemia/lymphoma 2 isoform 1 1.475
Down-regulated genes GO: 0007049. Cell cycle Negative regulators of cell cycle
NM_007669 Cdkn1a Cyclin-dependent kinase inhibitor 1A (P21) 0.612
NM_009875 Cdkn1b Cyclin-dependent kinase inhibitor 1B (P27) 0.472
AK077477 Igfbp3 Insulin-like growth factor binding protein 3 0.542
NM_011250 Rbl2 Retinoblastoma-like 2 0.631
GO: 0006914. Autophagy Positive regulators of autophagy
NM_026217 Atg12l Autophagy-related 12-like 0.814
NM_030257 Lysmd3 LysM, putative peptidoglycan-binding, domain containing 3 0.655
NM_019584 Becn1 Beclin 1 0.802
GO: 6915. Apoptosis
Positive regulators of apoptosis
NM_023190 Acin1 Apoptotic chromatin condensation inducer 1 isoform 2 0.502
NM_153779 Amid Apoptosis-inducing factor (AIF)-like mitchondrion-associated inducer of death isoform 1
0.658
NM_007523 Bak1 BCL2-antagonist/killer 1 0.550
NM_153787 Bclaf1 BCL2-associated transcription factor 1 isoform 2 0.543
NM_001025296 Dffa DNA fragmentation factor,asubunit isoform a 0.484 GO: 6511. Ubiquitin-dependent protein catabolism
Positive regulators of ubiquitin-proteolysis
NM_026346 Fbxo32 F-box only protein 32 0.666
NM_010890 Nedd4 Neural precursor cell expressed, developmentally down-regulated gene 4
0.507
NM_009457 Ube1x Ubiquitin-activating enzyme E1, Chr X 0.414
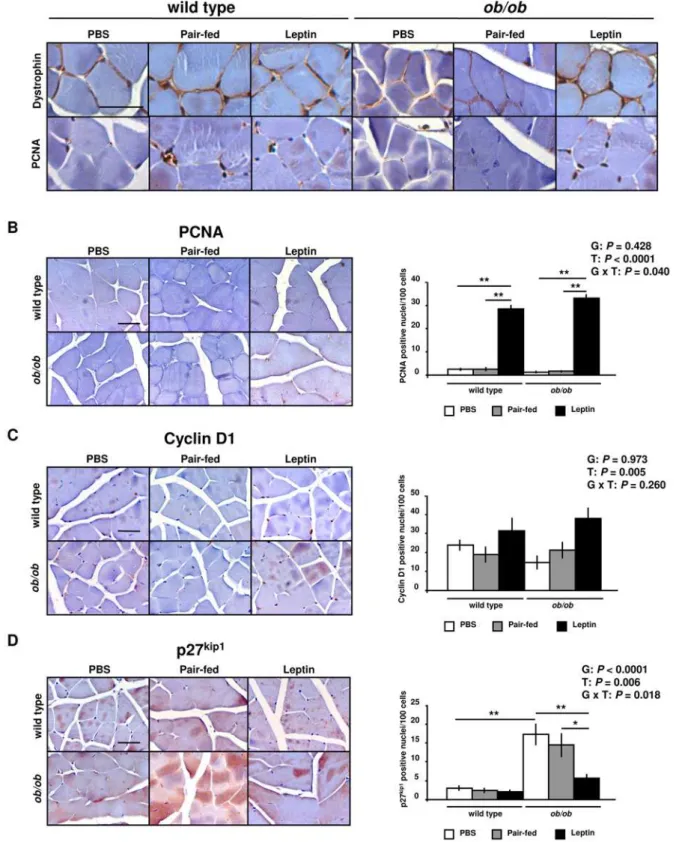
protein expression. In addition, we assessed immunostaining for the dystrophin protein, a marker molecule for plasmatic membrane (Figure 5A), to define positive PCNA nuclei and discriminate satellite cells from other cell types. In this sense, only nuclei between the basal lamina and the plasmatic membrane were counted. Leptin administration increased the nuclear immunostaining for PCNA (P= 0.002) (Figure 5B) and cyclin D1 (P= 0.005) (Figure 5C) in wild type and ob/ob mice. Moreover, nuclei of ob/ob mice showed an increased immunostaining of p27Kip1 (P= 0.002), which was reduced by leptin treatment as compared toob/ob(P= 0.004) and pair-fedob/ob(P= 0.015) mice (Figure 5D). These data provide evidence that leptin may enhance cell cycle progression in the GAS muscle ofob/obmice.
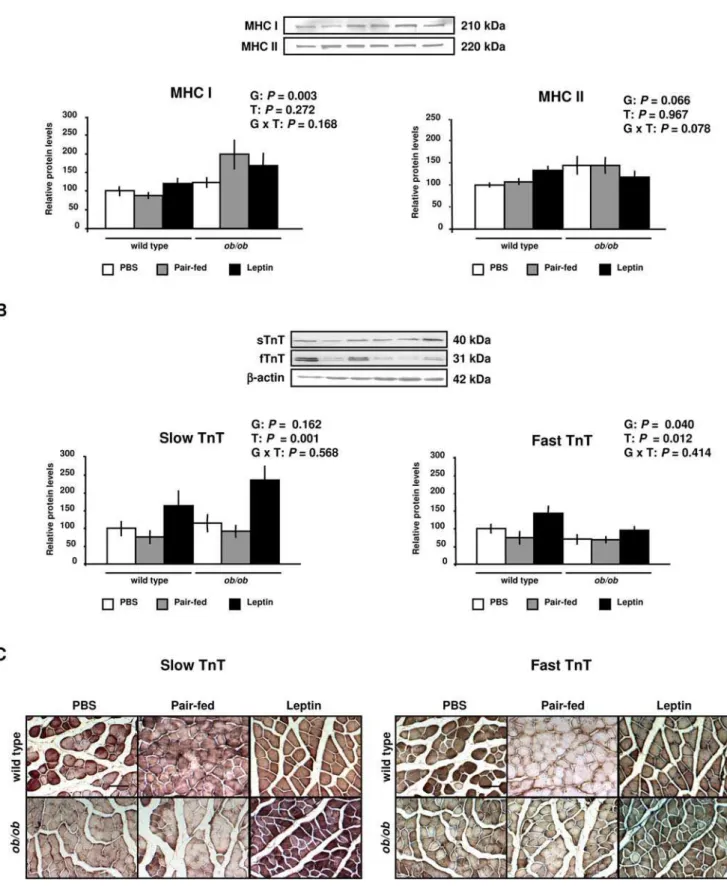
The growth of skeletal muscle requires an increase in the number of myonuclei together with an increase in the synthesis of myofibrillar proteins to maintain a constant ratio between number of nuclei per fiber and fiber size [29,30]. Gene expression analyses showed up-regulation of genes codifying for contractile and sarcomeric proteins in the GAS muscle ofob/obmice, which was normalized by leptin administration (Figure S3 and Table S2). Moreover, although a positive regulation of genes involved in the synthesis of proteins was induced by leptin administration (Table S2), no effect on the protein expression of both isoforms of MHC was found (Figure 6A). However, the administration of the hormone significantly increased the slow and fast isoforms of TnT in the GAS muscle of wild type andob/obmice (Figure 6B). These data were also confirmed by immunohistochemistry (Figure 6C). Therefore, leptin increases the protein expression of slow and fast isoforms of the contractile protein TnT.
Discussion
Muscle loss is the result of a reduced protein synthesis and increased myofibrillar degradation in response to inactivity, food deprivation or catabolic diseases [6,31]. Leptin-deficient ob/ob
mice display a reduced skeletal muscle mass [5,32,33] and an increased muscle proteosome activity [34] compared to their lean counterparts. Moreover, leptin administration has been shown to inhibit protein breakdown in C2C12 myotubes [35]. However, other authors failed to observe any direct effect of leptin on the synthesis and degradation rates of proteins in skeletal muscle of rats [36], suggesting that leptin effects on muscle mass may be mediated by the release of a secondary growth factor. Our study provides evidence for a myogenic effect of leptin on wild type and
ob/obmice. The main findings reported herein are that: 1) leptin induces changes in the expression of transcription factors involved in muscle growth (reduced FoxO3a and increased PGC-1a); 2) leptin down-regulates the atrophy markers, MAFbx and MuRF1, as well as the negative regulator of muscle growth myostatin; and 3) leptin increases the positive cell cycle markers cyclin D1 and PCNA.
Leptin Inhibits Muscular Atrophy
Animal and human studies have shown that caloric restriction enhances catabolic pathways in skeletal muscle through the activation of the energy sensor AMPK, which activates FoxO transcription factors leading to the up-regulation of MAFbx and MuRF1 [37–39]. Our results demonstrate that leptin increases the activity of AMPK in GAS ofob/obmice as well as decreases the protein expression of FoxO3a and the mRNA and protein expression of MAFbx and MuRF1 in wild type andob/obmice. These data suggest that leptin treatment inhibits the catabolic pathway of proteins mediated by the AMPK. Overexpression of FoxO3a is sufficient to cause skeletal muscle atrophy by increasing the UPS activity [11,14], but recentin vivoandin vitrostudies have shown that FoxO3a also activates the autophagic/lysosomal pathway [12,40]. In this sense, microarray data evidenced that
ob/obmice presented an upregulation of proteolytic (Need4, Ube2h), apoptotic (Acin, Amid), and autophagic (Lysmd3, Becn1, Atg121) genes, which were down-regulated by leptin treatment.
Gene Ontology Biological
Process GeneBank Number Gene Symbol Gene name Fold change
GO: 0019538. Protein metabolic process Negative regulators of Protein synthesis
NM_010124 Eif4ebp2 Eukaryotic translation initiation factor 4E binding protein 2 0.871
NM_008960 Pten Phosphatase and tensin homolog 0.665
NM_019827 Gsk3b Glycogen synthase kinase 3b 0.464
GO: 45214. Sarcomere organization Contractile and sarcomeric proteins
XM_354615 Myh1 Myosin, heavy polypeptide 1, skeletal muscle, adult 0.521
NM_144961 Myh2 Myosin, heavy polypeptide 2 0.521
XM_354614 Myh3 Myosin, heavy polypeptide 3, skeletal muscle, embryonic 0.214
NM_080728 Myh7 Myosin, heavy polypeptide 7, cardiac muscleb 0.665
NM_010859 Myl3 Myosin, light polypeptide 3 0.585
NM_010858 Myl4 Myosin, light polypeptide 4 0.688
XM_130232 Neb Nebulin 0.386
NM_021467 Tnni1 Troponin I, skeletal, slow 1 0.438
NM_011618 Tnnt1 Troponin T1, skeletal, slow 0.687
NM_022314 Tpm3 Tropomyosin 3c 0.648
Fold changes betweenob/ob vsleptin-treatedob/obmice of selected differentially expressed genes from Table S2. doi:10.1371/journal.pone.0006808.t001
Figure 2. Leptin Decreases FoxO3a Activity and Increases PGC-1aProtein in Gastrocnemius Muscle. (A)Representative Western blot analyses of forkhead box class O (FoxO3a) and phospho-FoxO3a proteins of gastrocnemius muscle of PBS (open), pair-fed (gray) and leptin-treated (closed) wild type andob/obmice are shown.b-actin was used as a loading control (n = 8 per group).(B)Representative Western blot analyses of Akt activity evidenced by phosphorylated-Akt and Akt proteins ratio of gastrocnemius muscle of PBS (open), pair-fed (gray) and leptin-treated (closed) wild type andob/obmice (n = 8 per group).(C)Representative Western blot analyses of AMP-activated protein kinase (AMPK) activity evidenced by phosphorylated-AMPK and AMPK proteins ratio of gastrocnemius muscle of PBS (open), pair-fed (gray) and leptin-treated (closed) wild type andob/ obmice are shown (n = 5 per group).(D)Representative Western blot analyses of AMP- (PGC-1a) of gastrocnemius muscle of PBS (open), pair-fed (gray) and leptin-treated (closed) wild type andob/obmice are shown.b-actin was used as a loading control (n = 8 per group). Data are expressed as mean6SEM. G: genotype, T: treatment.
Figure 3. Leptin Decreases MAFbx and MuRF1 Protein Expression in Gastrocnemius Muscle of Wild Type andob/obMice. (A) Representative Western blot analyses of muscle atrophy F box (MAFbx) and muscle RING finger 1 (MuRF1) proteins of gastrocnemius muscle of PBS (open), pair-fed (gray) and leptin-treated (closed) wild type andob/obmice are shown.b-actin was used as a loading control (n = 8 per group). *P,0.05.(B)Immunostaining for MAFbx and MuRF1 proteins was assessed by optic microscopy. Representative images are shown for gastrocnemius muscle. Scale bars = 50mm. Data are presented as mean6SEM. G: genotype, T: treatment.
The activation of PI3K/Akt signaling by insulin and growth factors regulates muscular mass by reducing FoxO3a activity and, hence, by blocking the expression of MAFbx and MuRF1 [16]. Nonetheless, under certain conditions, regulation of Akt and FoxO seems to be independent of each other [17,18]. Short-term leptin treatment activates Akt in smooth [41] and skeletal [42] muscles of rats, but long-term leptin treatment fails to activate this signaling pathway in myotubes [43] and in rat GAS muscle [44]. Our results showed that chronic leptin administration had no effect on Akt activity, which is in accordance with previous studies [43,44].
PGC-1a protects skeletal muscle from atrophy by blocking FoxO3a action and atrophy-specific gene transcription [19]. The transcript levels of PGC-1aare dramatically decreased in models of mice with muscle atrophy induced by denervation and diabetes [45], while energy restriction enhances the expression of PGC-1a in skeletal muscle of rodents and humans [46–48]. Leptin-deficient
ob/ob mice show a markedly reduced expression of Pgc-1a in brown adipose tissue, which is reverted by leptin treatment [49]. In the present study, we found that leptin deficiency is also associated with decreased PGC-1aexpression in GAS muscle, and that leptin treatment significantly increased the PGC-1aprotein in GAS muscle of wild type andob/obmice, which may be mediated by AMPK. In fact, AMPK reportedly enhances Pgc-1a
up-regulation in muscle [50,51] and AICAR, an AMPK-activating agent, leads to marked increases in PGC-1a protein content [52,53]. Taken together, our findings suggest that leptin inhibits the pathways leading to muscle atrophy by increasing PGC-1a, which, in turn, decreases the expression of FoxO3a and its down-stream effectors, MAFbx and MuRF1 in GAS muscle of wild type andob/obmice.
Leptin Enhances Muscle Growth
Muscle growth is related to a muscle fiber size increase, which involves a higher content of myofibrillar proteins as well as number of myonuclei to maintain a constant ratio between myonuclei per fiber and fiber size [30]. Mitogenic factors enhance cell cycle progression by increasing the activity of cyclin/CDK complexes, and inducing nuclear to cytoplasmic translocation of these inhibitors of cell cycle progression [23]. Moreover, FoxO proteins also regulate muscular mass by blocking the proliferation of muscle precursor cells via inhibiting DNA replication and cell cycle progression through the increase of the negative regulator of the cell cycle p27Kip1[15,54]. In this regard, our data show for the first time that leptin enhances cell cycle progression in GAS muscle by increasing the activity of the positive regulators of the cell cycle cyclin D1 and PCNA, and by simultaneously decreasing p27Kip1. Figure 4. Leptin Regulates Muscle Growth and Cell Cycle Factors. (A) Representative Western blot analyses of myostatin protein of gastrocnemius muscle of PBS (open), pair-fed (gray) and leptin-treated (closed) wild type andob/obmice are shown.b-actin was used as a loading control (n = 2–6 per group). The myostatin band was detected only in 2 samples of wild type groups.*P,0.05.(B)Representative Western blot analyses of proliferating cell nuclear antigen (PCNA), cyclin D1 and cyclin-dependent kinase inhibitor 1B (Cdkn1b/p27Kip1) proteins of gastrocnemius muscle of PBS (open), pair-fed (gray) and leptin-treated (closed) wild type andob/obmice are shown.b-actin was used as a loading control (n = 8 per group). *P,0.05, **P,0.01 and ***P,0.001. Data are expressed as mean6SEM. G: genotype, T: treatment.
Figure 5. Leptin Enhances Muscle Cell Proliferation. (A)Immunohistochemical staining for dystrophin and PCNA of gastrocnemious muscle of wild type andob/obmice (n = 3 per group). Scale bar = 50mm.(B)Immunohistochemical staining and relative stained nuclei number for PCNA evaluated among 500 cells in gastrocnemius muscle of PBS (open), pair-fed (gray) and leptin-treated (closed) wild type andob/obmice (n = 3 per group). Scale bar = 50mm. **P,0.01.(C)Immunohistochemical staining and relative stained nuclei number for cyclin D1 evaluated among 500 cells in gastrocnemius muscle of PBS (open), pair-fed (gray) and leptin-treated (closed) wild type andob/obmice (n = 3 per group). Scale bar = 50mm.(D) Immunohistochemical staining and relative stained nuclei number for p27Kip1evaluated among 500 cells in gastrocnemius muscle of PBS (open), pair-fed (gray) and leptin-treated (closed) wild type andob/obmice (n = 3 per group). Scale bar = 50mm. *P,0.05 and **P,0.01. Data are expressed as
Figure 6. Leptin Increases the Expression of Contractile Proteins in Skeletal Muscle. (A)Representative Western blot analyses of myosin heavy chain type I (MHC I), myosin heavy chain type II (MHC II), slow and fast troponin T (TnT) proteins of gastrocnemius muscle of PBS (open), pair-fed (gray) and leptin-treated (closed) wild type and ob/ob mice are shown. b-actin was used as a loading control (n = 8 per group). (B) Immunohistochemical staining for slow and fast troponin T (TnT) of gastrocnemius muscle of wild type andob/obmice. Scale bars = 100mm. Data are
These findings are in accordance with the mitogenic effects described for leptin in vascular endothelial cells [55], hepatocytes [56] cardiomyocytes [57], vascular smooth muscle cells [58], and myoblasts [59]. Until now, there is little information available on the effect of leptin on muscle growthin vivo. The work published by Ruth Harris [60,61] and by Abram M. Madiehe et al. [60,61] points to an increased protein synthesis and muscle mass in some strains ofdb/dbmice suggesting that leptin is able to increase the growth of db/dbmice via a mechanism that is dependent on the short isoform of the leptin receptor.
In order to explore other potential hormonal effects, circulating concentrations of testosterone were assessed taking into account that androgenic hormones affect muscle mass. However, no significant differences were observed following leptin administra-tion. These data seem to indicate that the leptin effects on muscle mass observed in the present study are not related to the changes in testosterone levels. Our findings do not rule out the possibility that other hormones may be involved in the regulation of muscle mass of ob/ob mice. It is possible that changes observed in the leptin-treated mice are related to the overall hormonal changes elicited by the administration of leptin rather than due to the direct effects of leptin on muscle mass. In addition, physical activity is a key regulator for muscle mass and leptin reportedly increases the reduced spontaneous locomotor activity of ob/ob mice [62,63]. Therefore, the possibility that muscle mass in leptin-treatedob/ob
mice may be affected by physical activity can not be ruled out. Unfortunately, physical activity was not assessed in the present study.
It has been suggested that myostatin plays a direct role in the deterioration of the skeletal muscle in states of obesity and insulin resistance [64–66]. The biological action of myostatin is well described in myostatin-deficient mice, which exhibit muscular hyperplasia and hypertrophy [21,67]. On the contrary, transgenic mice over-expressing myostatin exhibit a reduced muscular mass and fiber size [68,69], which has lead to consider myostatin as a negative regulator of skeletal muscle growth. Interestingly, myostatin regulates muscle growth by inhibiting the proliferation [70,71] and differentiation [72,73] of myoblasts. Myostatin inhibits the progression from the G1 to the S phase in myoblasts [74], blocks the expression of cyclin D1 and induces its degradation by the UPS [75,76]. In this respect, a high protein expression of myostatin was observed in GAS ofob/obmice in the present study. Importantly, our data show that leptin decreases the high myostatin protein expression related to leptin deficiency in
ob/obmice, suggesting that leptin enhances muscle growth. These data are consistent with the inhibitory effect of leptin on the high mRNA myostatin levels in adipose tissue and skeletal muscle ofob/ obmice previously observed [65].
Fiber size augmentation requires an increase of the myofibrillar protein content. FoxO1 down-regulates genes implicated in muscle growth and differentiation [14], and myostatin expression has been shown to be induced by FoxO1 in myotubes and mice [77,78]. Moreover, both myostatin and FoxO have been shown to inhibit protein synthesis by decreasing the activity of the components of the Akt/mammalian target of rapamycin pathway [70,79–81]. An unexpected finding of our study was the discordance for mRNA and protein expression of myofibrillar MHC and TnT isoforms, which has been suggested to be due to a higher proteolytic rate or lower translational efficiency, rather than changes in the transcription process [82–84]. The proteins which are ubiquitinated by MAFbx, MuRF1 and Need4 remain largely unknown, but some evidence indicates that MAFbx ubiquitinates and degradates MyoD [85], Need4 targets Notch [86], and MuRF1 ubiquitinates and degrades Troponin I [87] and MHC
[84], through a direct role of FoxO1 on the MuRF1 promoter activity [13]. Our data show that leptin administration prevented the increase of FoxO3a protein activity and MAFbx and MuRF1 gene and protein expression in wild type and ob/ob mice. Therefore, the increase of the Mhc1 and Mhc2a and slow TnT
mRNA levels inob/obmice in the absence of an increase in their protein levels may represent a compensatory adaptation to increase levels of lost myofibrillar proteins inob/obmice.
The control of muscle mass is regulated by a dynamic balance between the anabolic and catabolic processes. Data from our study indicate, for the first time, that leptin treatment prevents muscular atrophy by decreasing FoxO3a, MAFbx and MuRF1 protein expression in relation to an increase in the PGC-1aprotein in the GAS muscle of wild type and ob/obmice. The reduced skeletal muscle mass associated to leptin deficiency was prevented by leptin, on the one hand, reducing the negative regulator of muscle growth, myostatin, at the same time as by enhancing muscle cell proliferation through an increase in cyclin D1 and PCNA as well as the myofibrillar protein content of TnT, while decreasing p27Kip1.
Unfortunately, except in the rare cases of leptin deficiency, the clinical application of leptin in humans has not proved to be worthwhile in common obesity, since most obese patients exhibit hyperleptinemia pointing to the existence of leptin resistance. Therefore, no therapeutic benefit as regards improving body composition in obese humans might be foreseen. Furthermore, the sexual dimorphism relating to the fact that women have smaller muscles in spite of increased circulating leptin concentrations and higher leptin receptors expression should be also contemplated [88]. Nonetheless, practical applications of leptin administration may be envisaged in sports medicine and the area of disuse atrophy, which is a common clinical phenomenon. Prolonged immobilization due to fractures or neuromotor problems may represent scenarios for the application of leptin with therapeutic purposes targeting the restoration of muscle atrophy following limb disuse. Furthermore, from a physiologic perspective researchers involved in sports physiology might be also interested to gain more insight into the regulatory pathways involved in muscle mass accretion. Moreover, our study suggests that leptin treatment may be an attractive therapeutic approach to prevent muscular atrophy associated with catabolic diseases, which might be particularly useful in cachectic patients, such as frequently observed in oncological processes, HIV patients as well as other lipodystrophies.
Materials and Methods
Animals and Treatments
Ten-week-old male wild type (C57BL/6J) (n = 30) and genet-ically obeseob/ob mice (C57BL/6J) (n = 30) supplied by Harlan (Barcelona, Spain) were housed in a room with controlled temperature (2262uC), and a 12:12 light-dark cycle (lights on at 08:00 am). Wild type and ob/ob mice were divided in control, leptin-treated (1 mg/kg/d) and pair-fed groups (n = 10 per group). A pilot study with different leptin doses and routes of administration was carried out in order to select the appropriate dose to ensure that its concentration would fell within the physiological range (nanomolar range) in both the wild type and
daily food intake of the pair-fed groups was matched to the amount eaten by the leptin-treated groups the day before to discriminate the inhibitory effect of leptin on appetite. All experimental procedures conformed to the European Guidelines for the Care and Use of Laboratory Animals (directive 86/609) and were approved by the Ethical Committee for Animal Experimentation of the University of Navarra (080/05). Animals were sacrificed on the 28th day of treatment by CO2 inhalation 20 h after the last PBS or leptin administration (in order to avoid picking up effects reflecting an acute response) and after 8 h of fasting. Serum samples were obtained and stored at 280uC. Representative muscles of each muscle fiber type were excised: the SOL muscle is predominantly composed by oxidative, red fibers; the EDL contains mainly glycolytic, white fibers; while the GAS represents a mixed muscle type composed by both red and white fibers. Muscles of one leg were rapidly dissected out, weighed, frozen in liquid nitrogen, and stored at280uC until mRNA and protein extraction, while the contralateral leg muscles were formalin-fixed for immunohisto-chemical analyses. Epididymal, perirrenal and subcutaneous adipose tissue depots were also excised.
Blood Analysis
Serum glucose concentrations were measured using a sensitive-automatic glucose sensor (Ascensia Elite, Bayer, Barcelona, Spain). Serum triglycerides were spectrophotometrically determined using a commercial kit (Infinity, Thermo Electron, Melbourne, Australia). Serum free fatty acid (FFA) concentrations were measured by a colorimetric determination using the NEFA C kit (WAKO Chemicals, Neuss, Germany). Serum glycerol concen-trations were evaluated by enzymatic methods [89]. Insulin and leptin were determined using mouse ELISA kits (Crystal Chem Inc., Chicago, IL, USA). Adiponectin and testosterone concen-trations were also assessed using ELISA kits (BioVendor Laboratory Medicine, Inc., Modrice, Czech Republic and R&D Systems Europe, Ltd., Abingdon, United Kingdom, respectively). Intra- and inter-assay coefficients of variation for measurements of insulin, leptin, adiponectin and testosterone were 2.6–4.2% for the former, and 5.3–8.1%, for the latter.
Microarray Experiments and Analysis
Total RNA was extracted from 20–30 mg of GAS muscle samples by homogenization with an ULTRA-TURRAXH T 25 basic (IKAHWerke GmbH, Staufen, Germany) using TRIzolTM reagent (Invitrogen, Barcelona, Spain). Samples were purified using the RNeasy Mini kit (Qiagen, Barcelona, Spain) and treated with DNase I (RNase-free DNase Set, Qiagen) in order to remove any trace of genomic DNA.
Gene expression analyses were conducted using the Agilent Whole Mouse Genome array (G4121B, Agilent Technologies, Santa Clara, CA), containing 41,000 mouse genes and transcripts. Briefly, 1mg of total RNA from each sample was amino-allyl labeled and amplified using the Amino Allyl MessageAmp II aRNA Amplifica-tion Kit (Ambion, Austin, TX, USA). Aliquots (1.2mg) of amplified aRNA were fluorescently labeled using Cy3/Cy5 (Amersham, Biosciences, Buckinghamshire, UK) and then appropriately com-bined and hybridized to Agilent oligomicroarrays. Hybridizations were performed following a reference design, where control samples were pools of RNA from all individual samples. Two hybridizations with fluor reversal (Dye swap) were performed for each sample and 5 animals were used per group. After washing, microarray slides were scanned using a Gene Pix 4100A scanner (Axon Instruments, Union City, CA, USA) and image quantization was performed using the software GenePiX Pro 6.0. Gene expression data for all replicate experiments were analyzed using the GeneSpring GX software v
7.3.1 (Agilent Technologies). Clustering was accomplished with the Gene and Condition Tree algorithms. In addition, Gene Ontology groupings (http://babelomics.bioinfo.cipf.es) and the KEGG website (http://www.genome.ad.jp/kegg/pathway) were used in conjunction with GeneSpring (http://www.agilent.com/chem/ genespring) to identify pathways and functional groups of genes. All microarray data reported are described in accordance with MIAME guidelines. More information regarding the microarray experiments can be found at the EMBL-European Bioinformatics Institute (http://www.ebi.ac.uk/aerep/login. ArrayExpress accession number: E-MEXP-1831).
Real-Time PCR
To validate the microarray data, a number of representative differentially expressed genes were selected to be individually studied by Real-Time PCR (n = 5–10 per group). For first strand cDNA synthesis, constant amounts of 1.5mg of total RNA isolated from GAS muscle were reverse transcribed using random hexamers (Roche Molecular Biochemicals, Mannheim, Germany) as primers and 300 units of M-MLV reverse transcriptase (Invitrogen) as previously described [90]. The transcript levels were quantified by Real-Time PCR (7300 Real Time PCR System, Applied Biosystems, Foster City, CA, USA). Primers and probes were designed using the software Primer Express 2.0 (Applied Biosystems) (Table S4). Probes were designed to hybridize between exons to ensure the detection of the corresponding transcript avoiding genomic DNA amplification. The cDNA was amplified at the following conditions: 95uC for 10 min, followed by 45 cycles of 15 s at 95uC and 1 min at 59uC, using the TaqManH Universal PCR Master Mix (Applied Biosystems). The primer and probe concentrations for gene amplification were 300 nmoL/L and 200 nmoL/L, respectively. All results were normalized to the levels of 18SrRNA (Applied Biosystems) and relative quantification was calculated using the DDCt formula [90]. Relative mRNA expression was expressed as fold expression over the calibrator sample (average of gene expression corresponding to the wild type group). All samples were run in triplicate and the average values were calculated.
Western Blot
Muscle samples (20 mg) were homogenized in RIPA buffer (1 M Tris-HCl pH 7.4, 150 mM NaCl, 1% Triton X-100, 0.1% SDS, EDTA 2H2O 5 mM, 1% deoxycolate) supplemented with protease inhibitors (CompleteTM Mini-EDTA free, Roche). Soluble proteins were recovered after centrifugation at 16,000g
for 15 min at 4uC. Protein concentration was determined according to the method of Bradford [91] using bovine serum albumine (BSA) (Sigma, St. Louis, MO, USA) as standard. Equal amounts of protein (30mg) were boiled for 10 min and resolved on 10% SDS-PAGE at constant voltage (200 V for 1 h), except for MHC proteins (100 V for 4 h). Then, proteins were transferred to nitrocellulose membranes (BioRad, Hercules, CA, USA) and were blocked with 5% non-fat dry milk in TBS-Tween 20 0.05% for 1 h at room temperature (RT). Blots were then incubated with mouse monoclonal anti-PCNA (Dako Cytomation, Glostrup, Denmark), rabbit polyclonal anti-myostatin, anti-cyclin D1, and anti-p27Kip1 (Abcam, Cambridge, UK), mouse polyclonal MHC I, anti-MHC II, goat polyclonal anti-PGC-1a, anti-slow TnT, anti-fast TnT, anti-MAFbx, and rabbit polyclonal anti-MuRF1 (Santa Cruz Biotechnology, Santa Cruz, CA, USA), rabbit polyclonal anti-Akt1/PKB (phospho Thr 308) and anti-Akt1/PKB (Upstate, Cambridge, UK) antibodies in blocking buffer overnight at 4uC. After washing with TBS-Tween 0.5% (565 min), membranes
IgG (Zymed, San Francisco, CA, USA), rabbit IgG, or anti-mouse IgG (Amersham Biosciences) for 1 h at RT. Mouse monoclonal anti-b-actin (Sigma) was used for normalization of density values. The chemiluminescence ECL reactive (Enhanced Chemiluminescent System, Amersham Biosciences) was used to develop the bands, which were analyzed by densitometric analysis using the Gel Doc-Quantity One 4.5.0. software (Bio-Rad).
Histological Analyses
Sections (5mm) of formalin-fixed paraffin-embedded muscles were dewaxed with xylene and hydrated in decreasing concentrations of ethanol. Endogen peroxidase activity was quenched using 3% H2O2 (Sigma) in absolute methanol for 20 min at RT, and washed 3 times with ethanol. Sections were immersed in 10 mM citrate buffer (pH 6.0) and heated using a microwave oven at 800 W for 10 min to enhance antigen retrieval. After cooling, sections were blocked for 30 min at RT in a humidified chamber with 5% murine or goat serum (Sigma) in TBS. Polyclonal antibodies against MAFbx, MuRF1, PCNA, cyclin D1, p27Kip1, fast TnT and slow TnT, used for immunohistochemistry were the same than those used for western blot studies. In addition, the dystrophin protein was also immunolocalized with a monoclonal antibody (Abcam). Sections were subsequently incubated with the appropriate dilutions of primary antibodies in TBS with 5% mouse or goat serum (Sigma) (1:50–100) in a humidified chamber overnight at 4uC. After washing with TBS (365 min), sections were incubated with horseradish peroxidase-conjugated secondary antibodies diluted in TBS with 5% BSA (1:100) for 1 h at RT. After washing with TBS (365 min), localization of the antigen-antibody binding antibodies was performed by adding diaminobenzidine (DAB) (Sigma) or DAB with glucose oxidase (Sigma) as developing system [92]. Negative control slides with omission of the primary antibodies were included in the immunostaining procedure. The reaction was stopped and contrasted with Harris hematoxylin solution (Sigma). Sections were dehydrated with increasing concentrations of ethanol and xylol, mounted in DePeX (Panreac, Barcelona, Spain), and observed with an optic microscope (Axiovert 40 CFL, Zeiss, Go¨ttingen, Germany). Fiber size was determined by measuring the cross-sectional area of GAS, SOL and EDL muscle fibers with the Axiovision 4.6 program (Zeiss). Positive myonuclei for PCNA, cyclin D1 and p27kip1in cross-sections of GAS muscles were quantified from 4 microscope fields (400X) randomly selected. Mean value was expressed as positive myonuclei number per 100 cells.
Statistical Analysis
Data are expressed as mean6standard error of the mean (SEM). Global effects of genotype and treatment were determined using a two-way analysis of the variance (ANOVA). When interaction between both factors was detected, comparisons between groups were subsequently analyzed by Kruskal-Wallis followed byU-Mann Whitney tests. As previously outlined, Gene Ontology groupings were used to identify pathways significantly affected by leptin deficiency and administration. Furthermore, statistical comparisons for microarray data to identify differentially expressed genes across different groups were performed using one-way ANOVA and Student’s t-tests as appropriate. All statistical analyses were performed by using the SPSS statistical program version 15.0 for Windows (SPSS, Chicago, IL, USA) and statistical significance was defined asP,0.05.
Supporting Information
Table S1 Biochemical Characteristics of Wild Type and ob/ob Mice
Found at: doi:10.1371/journal.pone.0006808.s001 (0.03 MB XLS)
Table S2 Genes Differentially Regulated by Leptin Treatment in ob/ob Mice
Found at: doi:10.1371/journal.pone.0006808.s002 (0.10 MB XLS)
Table S3 Genes Differentially Regulated by Leptin Treatment as Compared to Pair-Feeding in ob/ob Mice
Found at: doi:10.1371/journal.pone.0006808.s003 (0.04 MB XLS)
Table S4 Sequences of the Primers and Taqman Probes Used in the Real-Time PCR
Found at: doi:10.1371/journal.pone.0006808.s004 (0.03 MB XLS)
Figure S1 Leptin Treatment Decreases Body Weight and Body Fat in Wild Type andob/obMice. (A) Body weight curves of PBS (open), pair-fed (gray) and leptin-treated (closed) wild type andob/ obmice (n = 9–10 animals per group). **P,0.01 and ***P,0.001 for PBS ob/ob vs PBS wild type and leptin-treated ob/ob mice. +P,0.05,++P,0.01 and+++P,0.001 for pair-fedob/obvs leptin-treatedob/ob. #P,0.05 and##P,0.001 for PBS wild type vs leptin-treated wild type. (B) Daily food intake curves of PBS (open), pair-fed (gray) and leptin-treated (closed) wild type andob/obmice (n = 9–10 animals per group). ***P,0.001 for PBS ob/obvs PBS wild type and leptin-treatedob/ob.#P,0.05 and# #P,0.001 for PBS wild type vs leptin-treated wild type. (C) Epididymal (EWAT), perirrenal (PWAT) and subcutaneous (SWAT) depots relative to body weight of PBS (open), pair-fed (gray) and leptin-treated (closed) wild type and ob/ob mice (9–10 animals per group). *P,0.05, **P,0.01 and ***P,0.001. Data are presented as mean6SEM. G: genotype, T: treatment. The striped line indicates the beginning of the pair-feeding treatment.
Found at: doi:10.1371/journal.pone.0006808.s005 (9.73 MB TIF)
Figure S2 Hierarchical Clustering of the Gene Expression Profile of the Gastrocnemius Muscle of Wild Type, ob/ob and Leptin-Treatedob/obMice. Red represents up-regulated expres-sion, green shows down-regulation, and yellow indicates a similar gene expression pattern as compared to reference. White boxes highlight that leptin treatment was able to reduce the mRNA expression of 732 up-regulated genes inob/obmice and to increase the expression of 846 down-regulated genes.
Found at: doi:10.1371/journal.pone.0006808.s006 (10.13 MB TIF)
Figure S3 Analyses by Real-Time PCR of Key Genes Involved in Muscular Atrophy and Muscle Growth. (A) Real-Time PCR analysis of forkhead box class O3a (Foxo3a) and Foxo1, and peroxisome proliferator-activated receptor coactivator 1a (Pgc-1a) in gastrocnemius muscle of PBS (open), pair-fed (gray) and leptin-treated (closed) wild type andob/obmice (n = 5 per group). (B) Real-Time PCR analysis of muscle atrophy F box (MAFbx) and muscle RING finger 1 (MuRF1) in gastrocnemius muscle of PBS (open), pair-fed (gray) and leptin-treated (closed) wild type andob/obmice (n = 5 per group). (C) Real-Time PCR analysis of myosin heavy chain type I (Mhc1), myosin heavy chain type IIa (Mhc2a), myosin heavy chain type IIb (Mhc2b) and slow troponin T (slow TnT), in gastrocnemius muscle of PBS (open), pair-fed (gray) and leptin-treated (closed) wild type and ob/ob
mice (n = 5 per group). Data are presented as mean6SEM of the ratio between gene expression and 18S rRNA. G: genotype, T: treatment.
Acknowledgments
The authors would like to thank all the staff of the animal housing facilities for their technical expertise in animal care and handling and, in particular, to Javier Guille´n and Juan Percaz.
Author Contributions
Conceived and designed the experiments: NS JGA GF. Performed the experiments: NS AR VC SB BR. Analyzed the data: NS AR VC SB BR JGA GF. Contributed reagents/materials/analysis tools: JGA GF. Wrote the paper: NS AR VC JGA GF.
References
1. Sahu A (2004) Minireview: A hypothalamic role in energy balance with special emphasis on leptin. Endocrinology 145: 2613–2620.
2. Margetic S, Gazzola C, Pegg G, Hill R (2002) Leptin: a review of its peripheral actions and interactions. Int J Obes Relat Metab Disord 26(11): 1407–1433. 3. Fru¨hbeck G (2001) A heliocentric view of leptin. Proc Nutr Soc 60: 301–318. 4. Ceddia R, William W, Curi R (2001) The response of skeletal muscle to leptin.
Front Biosci 6: 90–97.
5. Trostler N, Romsos DR, Bergen WG, Leveille GA (1979) Skeletal muscle accretion and turnover in lean and obese (ob/ob) mice. Metabolism 28: 928–933. 6. Eley H, Tisdale M (2007) Skeletal muscle atrophy, a link between depression of protein synthesis and increase in degradation. J Biol Chem 282: 7087–7097. 7. Pickart C, Eddins M (2004) Ubiquitin: structures, functions, mechanisms.
Biochim Biophys Acta 1695: 55–72.
8. Bodine S, Latres E, Baumhueter S, Lai V, Nunez L, et al. (2001) Identification of ubiquitin ligases required for skeletal muscle atrophy. Science 294: 1704–1708. 9. Gomes M, Lecker S, Jagoe R, Navon A, Goldberg A (2001) Atrogin-1, a muscle-specific F-box protein highly expressed during muscle atrophy. Proc Natl Acad Sci USA 98: 14440–14445.
10. Accili D, Arden K (2004) FoxOs at the crossroads of cellular metabolism, differentiation, and transformation. Cell 117: 421–426.
11. Sandri M, Sandri C, Gilbert A, Skurk C, Calabria E, et al. (2004) Foxo transcription factors induce the atrophy-related ubiquitin ligase atrogin-1 and cause skeletal muscle atrophy. Cell 117: 399–412.
12. Zhao J, Brault JJ, Schild A, Cao P, Sandri M, et al. (2007) FoxO3 coordinately activates protein degradation by the autophagic/lysosomal and proteasomal pathways in atrophying muscle cells. Cell Metab 6: 472–483.
13. Waddell D, Baehr L, van den Brandt J, Johnsen S, Reichardt H, et al. (2008) The glucocorticoid receptor and FOXO1 synergistically activate the skeletal muscle atrophy-associated MuRF1 gene. Am J Physiol Endocrinol Metab 295: 785–797.
14. Kamei Y, Miura S, Suzuki M, Kai Y, Mizukami J, et al. (2004) Skeletal muscle FOXO1 (FKHR) transgenic mice have less skeletal muscle mass, down-regulated Type I (slow twitch/red muscle) fiber genes, and impaired glycemic control. J Biol Chem 279: 41114–41123.
15. Rathbone CR, Booth FW, Lees SJ (2008) FoxO3a preferentially induces p27Kip1 expression while impairing muscle precursor cell-cycle progression. Muscle Nerve 37: 84–89.
16. Stitt T, Drujan D, Clarke B, Panaro F, Timofeyva Y, et al. (2004) The IGF-1/ PI3K/Akt pathway prevents expression of muscle atrophy-induced ubiquitin ligases by inhibiting FOXO transcription factors. Mol Cell 14: 395–403. 17. Hu M, Lee D, Xia W, Golfman L, Ou-Yang F, et al. (2004) IkB kinase promotes
tumorigenesis through inhibition of forkhead FOXO3a. Cell 117: 225–237. 18. Moylan J, Smith J, Chambers M, McLoughlin T, Reid M (2008) TNF induction
of atrogin-1/MAFbx mRNA depends on Foxo4 expression but not AKT-Foxo1/3 signaling. Am J Physiol Cell Physiol 295: 986–993.
19. Sandri M, Lin J, Handschin C, Yang W, Arany Z, et al. (2006) PGC-1aprotects skeletal muscle from atrophy by suppressing FoxO3 action and atrophy-specific gene transcription. Proc Natl Acad Sci USA 103: 16260–16265.
20. Muzzin P, Eisensmith RC, Copeland KC, Woo SL (1996) Correction of obesity and diabetes in genetically obese mice by leptin gene therapy. Proc Natl Acad Sci USA 93: 14804–14808.
21. McPherron AC, Lawler AM, Lee SJ (1997) Regulation of skeletal muscle mass in mice by a new TGF-bsuperfamily member. Nature 387: 83–90.
22. Rosenblatt JD, Yong D, Parry DJ (1994) Satellite cell activity is required for hypertrophy of overloaded adult rat muscle. Muscle Nerve 17: 608–613. 23. Adams GR (2006) Satellite cell proliferation and skeletal muscle hypertrophy.
Appl Physiol Nutr Metab 31: 782–790.
24. Johnson SE, Allen RE (1993) Proliferating cell nuclear antigen (PCNA) is expressed in activated rat skeletal muscle satellite cells. J Cell Physiol 154: 39–43. 25. Hawke TJ, Garry DJ (2001) Myogenic satellite cells: physiology to molecular
biology. J Appl Physiol 91: 534–551.
26. Borriello A, Cucciolla V, Oliva A, Zappia V, Della Ragione F (2007) p27Kip1 metabolism: a fascinating labyrinth. Cell Cycle 6: 1053–1061.
27. Alt JR, Cleveland JL, Hannink M, Diehl JA (2000) Phosphorylation-dependent regulation of cyclin D1 nuclear export and cyclin D1-dependent cellular transformation. Genes Dev 14: 3102–3114.
28. Diehl JA, Cheng M, Roussel MF, Sherr CJ (1998) Glycogen synthase kinase-3b
regulates cyclin D1 proteolysis and subcellular localization. Genes Dev 12: 3499–3511.
29. Bruusgaard JC, Liestol K, Ekmark M, Kollstad K, Gundersen K (2003) Number and spatial distribution of nuclei in the muscle fibres of normal mice studiedin vivo. J Physiol 551: 467–478.
30. O’Connor RS, Pavlath GK (2007) Point:Counterpoint: Satellite cell addition is/ is not obligatory for skeletal muscle hypertrophy. J Appl Physiol 103: 1099–1100.
31. Fru¨hbeck G (1998) Protein metabolism. Slow and fast dietary proteins. Nature 391: 843, 845.
32. Bergen WG, Kaplan ML, Merkel RA, Leveille GA (1975) Growth of adipose and lean tissue mass in hindlimbs of genetically obese mice during preobese and obese phases of development. Am J Clin Nutr 28: 157–161.
33. Warmington S, Tolan R, McBennett S (2000) Functional and histological characteristics of skeletal muscle and the effects of leptin in the genetically obese (ob/ob) mouse. Int J Obes Relat Metab Disord 24: 1040–1050.
34. Trostler N, Amin R, Shafrir E (1982) Increased protease activity in muscles of obese- (ob/ob) mice. Int J Obes 6: 557–566.
35. Ramsay T (2003) Porcine leptin inhibits protein breakdown and stimulates fatty acid oxidation in C2C12 myotubes. J Anim Sci 81: 3046–3051.
36. Carbo N, Ribas V, Busquets S, A´ lvarez B, Lo´pez-Soriano F, et al. (2000) Short-term effects of leptin on skeletal muscle protein metabolism in the rat. J Nutr Biochem 11: 431–435.
37. Greer E, Oskoui P, Banko M, Maniar J, Gygi M, et al. (2007) The energy sensor AMP-activated protein kinase directly regulates the mammalian FOXO3 transcription factor. J Biol Chem 282: 30107–30119.
38. Krawiec B, Nystrom G, Frost R, Jefferson L, Lang C (2007) AMP-activated protein kinase agonists increase mRNA content of the muscle-specific ubiquitin ligases MAFbx and MuRF1 in C2C12 cells. Am J Physiol Endocrinol Metab 292: 1555–1567.
39. Nakashima K, Yakabe Y (2007) AMPK activation stimulates myofibrillar protein degradation and expression of atrophy-related ubiquitin ligases by increasing FOXO transcription factors in C2C12 myotubes. Biosci Biotechnol Biochem 71: 1650–1656.
40. Mammucari C, Milan G, Romanello V, Masiero E, Rudolf R, et al. (2007) FoxO3 controls autophagy in skeletal musclein vivo. Cell Metab 6: 458–471. 41. Rodrı´guez A, Fortun˜o A, Go´mez-Ambrosi J, Zalba G, Dı´ez J, et al. (2007) The
inhibitory effect of leptin on angiotensin II-induced vasoconstriction in vascular smooth muscle cells is mediated via a nitric oxide-dependent mechanism. Endocrinology 148: 324–331.
42. Dube JJ, Bhatt BA, Dedousis N, Bonen A, O’Doherty RM (2007) Leptin, skeletal muscle lipids, and lipid-induced insulin resistance. Am J Physiol Regul Integr Comp Physiol 293: 642–650.
43. Tajmir P, Kwan J, Kessas M, Mozammel S, Sweeney G (2003) Acute and chronic leptin treatment mediate contrasting effects on signaling, glucose uptake, and GLUT4 translocation in L6-GLUT4myc myotubes. J Cell Physiol 197: 122–130.
44. Barazzoni R, Zanetti M, Bosutti A, Biolo G, Vitali-Serdoz L, et al. (2005) Moderate caloric restriction, but not physiological hyperleptinemia per se, enhances mitochondrial oxidative capacity in rat liver and skeletal muscle–tissue-specific impact on tissue triglyceride content and AKT activation. Endocrinol-ogy 146: 2098–2106.
45. Sacheck J, Hyatt J, Raffaello A, Jagoe R, Roy R, et al. (2007) Rapid disuse and denervation atrophy involve transcriptional changes similar to those of muscle wasting during systemic diseases. FASEB J 21: 140–155.
46. Lambert A, Wang B, Yardley J, Edwards J, Merry B (2004) The effect of aging and caloric restriction on mitochondrial protein density and oxygen consump-tion. Exp Gerontol 39: 289–295.
47. Nisoli E, Tonello C, Cardile A, Cozzi V, Bracale R, et al. (2005) Calorie restriction promotes mitochondrial biogenesis by inducing the expression of eNOS. Science 310: 314–317.
48. Arany Z (2008) PGC-1 coactivators and skeletal muscle adaptations in health and disease. Curr Opin Genet Dev 18: 426–434.
49. Kakuma T, Wang Z, Pan W, Unger R, Zhou Y (2000) Role of leptin in peroxisome proliferator-activated receptorccoactivator-1 expression. Endocri-nology 141: 4576–4582.
50. Lee WJ, Kim M, Park HS, Kim HS, Jeon MJ, et al. (2006) AMPK activation increases fatty acid oxidation in skeletal muscle by activating PPARaand PGC-1. Biochem Biophys Res Commun 340: 291–295.
51. Sriwijitkamol A, Ivy JL, Christ-Roberts C, DeFronzo RA, Mandarino LJ, et al. (2006) LKB1-AMPK signaling in muscle from obese insulin-resistant Zucker rats and effects of training. Am J Physiol Endocrinol Metab 290: 925–932. 52. Ojuka EO, Jones TE, Han DH, Chen M, Holloszy JO (2003) Raising Ca2+
in L6 myotubes mimics effects of exercise on mitochondrial biogenesis in muscle. FASEB J 17: 675–681.
53. Terada S, Tabata I (2004) Effects of acute bouts of running and swimming exercise on PGC-1aprotein expression in rat epitrochlearis and soleus muscle. Am J Physiol Endocrinol Metab 286: 208–216.
55. Park HY, Kwon HM, Lim HJ, Hong BK, Lee JY, et al. (2001) Potential role of leptin in angiogenesis: leptin induces endothelial cell proliferation and expression of matrix metalloproteinasesin vivoandin vitro. Exp Mol Med 33: 95–102. 56. Lang T, Ikejima K, Yoshikawa M, Enomoto N, Iijima K, et al. (2004) Leptin
facilitates proliferation of hepatic stellate cells through up-regulation of platelet-derived growth factor receptor. Biochem Biophys Res Commun 323: 1091–1095.
57. Tajmir P, Ceddia RB, Li RK, Coe IR, Sweeney G (2004) Leptin increases cardiomyocyte hyperplasia via extracellular signal-regulated kinase- and phosphatidylinositol 3-kinase-dependent signaling pathways. Endocrinology 145: 1550–1555.
58. Oda A, Taniguchi T, Yokoyama M (2001) Leptin stimulates rat aortic smooth muscle cell proliferation and migration. Kobe J Med Sci 47: 141–150. 59. Yu T, Luo G, Zhang L, Wu J, Zhang H, et al. (2008) Leptin promotes
proliferation and inhibits differentiation in porcine skeletal myoblasts. Biosci Biotechnol Biochem 72: 13–21.
60. Harris RB (1999) Parabiosis between db/db and ob/ob or db/+
mice. Endocrinology 140: 138–145.
61. Madiehe AM, Hebert S, Mitchell TD, Harris RB (2002) Strain-dependent stimulation of growth in leptin-treated obesedb/dbmice. Endocrinology 143: 3875–3883.
62. Della-Fera MA, Choi YH, Hartzell DL, Duan J, Hamrick M, et al. (2005) Sensitivity ofob/obmice to leptin-induced adipose tissue apoptosis. Obes Res 13: 1540–1547.
63. Pelleymounter MA, Cullen MJ, Baker MB, Hecht R, Winters D, et al. (1995) Effects of the obese gene product on body weight regulation inob/obmice. Science 269: 540–543.
64. Feldman BJ, Streeper RS, Farese RV Jr, Yamamoto KR (2006) Myostatin modulates adipogenesis to generate adipocytes with favorable metabolic effects. Proc Natl Acad Sci USA 103: 15675–15680.
65. Allen DL, Cleary AS, Speaker KJ, Lindsay SF, Uyenishi J, et al. (2008) Myostatin, activin receptor IIb, and follistatin-like-3 gene expression are altered in adipose tissue and skeletal muscle of obese mice. Am J Physiol Endocrinol Metab 294: 918–927.
66. Hittel D, Berggren J, Shearer J, Boyle K, Houmard J (2009) Increased secretion and expression of myostatin in skeletal muscle from extremely obese women. Diabetes 58: 30–38.
67. Lee SJ, McPherron AC (2001) Regulation of myostatin activity and muscle growth. Proc Natl Acad Sci USA 98: 9306–9311.
68. Reisz-Porszasz S, Bhasin S, Artaza JN, Shen R, Sinha-Hikim I, et al. (2003) Lower skeletal muscle mass in male transgenic mice with muscle-specific overexpression of myostatin. Am J Physiol Endocrinol Metab 285: 876–888. 69. Durieux AC, Amirouche A, Banzet S, Koulmann N, Bonnefoy R, et al. (2007)
Ectopic expression of myostatin induces atrophy of adult skeletal muscle by decreasing muscle gene expression. Endocrinology 148: 3140–3147. 70. Taylor WE, Bhasin S, Artaza J, Byhower F, Azam M, et al. (2001) Myostatin
inhibits cell proliferation and protein synthesis in C2C12 muscle cells. Am J Physiol Endocrinol Metab 280: 221–228.
71. McCroskery S, Thomas M, Maxwell L, Sharma M, Kambadur R (2003) Myostatin negatively regulates satellite cell activation and self-renewal. J Cell Biol 162: 1135–1147.
72. Langley B, Thomas M, Bishop A, Sharma M, Gilmour S, et al. (2002) Myostatin inhibits myoblast differentiation by down-regulating MyoD expression. J Biol Chem 277: 49831–49840.
73. Joulia D, Bernardi H, Garandel V, Rabenoelina F, Vernus B, et al. (2003) Mechanisms involved in the inhibition of myoblast proliferation and differen-tiation by myostatin. Exp Cell Res 286: 263–275.
74. Thomas M, Langley B, Berry C, Sharma M, Kirk S, et al. (2000) Myostatin, a negative regulator of muscle growth, functions by inhibiting myoblast proliferation. J Biol Chem 275: 40235–40243.
75. Yang W, Zhang Y, Li Y, Wu Z, Zhu D (2007) Myostatin induces cyclin D1 degradation to cause cell cycle arrest through a phosphatidylinositol 3-kinase/ AKT/GSK-3bpathway and is antagonized by insulin-like growth factor 1. J Biol Chem 282: 3799–3808.
76. Ji M, Zhang Q, Ye J, Wang X, Yang W, et al. (2008) Myostatin induces p300 degradation to silence cyclin D1 expression through the PI3K/PTEN/Akt pathway. Cell Signal 20: 1452–1458.
77. Liu CM, Yang Z, Liu CW, Wang R, Tien P, et al. (2007) Effect of RNA oligonucleotide targeting Foxo-1 on muscle growth in normal and cancer cachexia mice. Cancer Gene Ther 14: 945–952.
78. Allen DL, Unterman TG (2007) Regulation of myostatin expression and myoblast differentiation by FoxO and SMAD transcription factors. Am J Physiol Cell Physiol 292: 188–199.
79. Southgate RJ, Neill B, Prelovsek O, El-Osta A, Kamei Y, et al. (2007) FOXO1 regulates the expression of 4E-BP1 and inhibits mTOR signaling in mammalian skeletal muscle. J Biol Chem 282: 21176–21186.
80. Wu AL, Kim JH, Zhang C, Unterman TG, Chen J (2008) Forkhead box protein O1 negatively regulates skeletal myocyte differentiation through degradation of mammalian target of rapamycin pathway components. Endocrinology 149: 1407–1414.
81. Amirouche A, Durieux A, Banzet S, Koulmann N, Bonnefoy R, et al. (2009) Down-regulation of Akt/mammalian target of rapamycin signaling pathway in response to myostatin overexpression in skeletal muscle. Endocrinology 150: 286–294.
82. Booth FW, Kirby CR (1992) Changes in skeletal muscle gene expression consequent to altered weight bearing. Am J Physiol 262: 329–332.
83. Reilly ME, McKoy G, Mantle D, Peters TJ, Goldspink G, et al. (2000) Protein and mRNA levels of the myosin heavy chain isoforms Ib, IIa, IIx and IIb in type I and type II fibre-predominant rat skeletal muscles in response to chronic alcohol feeding. J Muscle Res Cell Motil 21: 763–773.
84. Clarke BA, Drujan D, Willis MS, Murphy LO, Corpina RA, et al. (2007) The E3 Ligase MuRF1 degrades myosin heavy chain protein in dexamethasone-treated skeletal muscle. Cell Metab 6: 376–385.
85. Tintignac LA, Lagirand J, Batonnet S, Sirri V, Leibovitch MP, et al. (2005) Degradation of MyoD mediated by the SCF (MAFbx) ubiquitin ligase. J Biol Chem 280: 2847–2856.
86. Koncarevic A, Jackman RW, Kandarian SC (2007) The ubiquitin-protein ligase Nedd4 targets Notch1 in skeletal muscle and distinguishes the subset of atrophies caused by reduced muscle tension. FASEB J 21: 427–437.
87. Kedar V, McDonough H, Arya R, Li HH, Rockman HA, et al. (2004) Muscle-specific RING finger 1 is a bona fide ubiquitin ligase that degrades cardiac troponin I. Proc Natl Acad Sci USA 101: 18135–18140.
88. Guerra B, Fuentes T, Delgado-Guerra S, Guadalupe-Grau A, Olmedillas H, et al. (2008) Gender dimorphism in skeletal muscle leptin receptors, serum leptin and insulin sensitivity. PLoS One 3: 3466.
89. Wieland O (1957) Enzymic method for the determination of glycerin. Biochem Z 329: 313–319.
90. Catala´n V, Go´mez-Ambrosi J, Rotellar F, Silva C, Rodrı´guez A, et al. (2007) Validation of endogenous control genes in human adipose tissue: relevance to obesity and obesity-associated type 2 diabetes mellitus. Horm Metab Res 39: 495–500.
91. Bradford MM (1976) A rapid and sensitive method for the quantitation of microgram quantities of protein utilizing the principle of protein-dye binding. Anal Biochem 72: 248–254.