Supplementary data file of Appendices 1-6
Appendix 1. Outline of the study.
219 eligible Senior
students
90 questionnaires were
distributed
(41%)
78 valid questionnaires were
collected and analysed
(86,6%)
Appendix 2. Details on the data collection instrument ABUEL.
The "ABUEL – Elder abuse: A multinational prevalence survey" is a questionnaire used
in a European study project on elder abuse.
The Portuguese version of the “ABUEL- Health and wellbeing questionnaire in
individuals between 60 and 84 years old” was translated and used by the Epidemiology
Department of the Faculty of Medicine of Oporto (2009).
Because it is an extensive questionnaire, only variables related to the objective were
used.
The final questionnaire used in the study was eleven pages long and it took about 30
minutes to fill. It was grouped in 13 domains: socio-demographic (age, gender, country
and place of birth, marital status, education), housing conditions, leisure activities, work
situation and income, physical activity, nutrition, smoking and drinking habits, oral
health, medication, falls history, social support.
Appendix 3. Characteristics of the sample
Appendix 2 Table. Characteristics of the sample
Freq.* %Age
Average = 68,00, Standard deviation = 6,17
Min = 60 years Máx = 86 years
55-64 years 23 29,5
65-74 years 42 53,8
75-84 years 12 15,4
+ 85 years
1 1,3
Gender
Feminine 57 73,1Masculine 21 26,9
Nationality
Portuguese 76 97,4Spanish 1 1,3
Double nationality (Portuguese and Spanish) 1 1,3
Marital status
Married/ living as such 49 62,8Divorced/ separated 5 6,4
Widow 24 30,8
Educational status
Can’t read or write 1 1,3Can read and write, no degree 12 15,4
Didn’t complete primary school 8 10,3
Primary education or first stage of basic
education (1st cycle) 19 24,4
Primary education or first stage of basic
education (2nd cycle) 5 6,4
(Upper) secondary education (3rd cycle) 17 21,8 First stage of tertiary education (10º e 11º
year) 8 10,3
First stage of tertiary education (12º year) 2 2,6 Second stage of tertiary education
(Undergraduate) 4 5,1
Second stage of tertiary education
(Graduate) 2 2,6
Income (monthly)
<250€ 14 17,9251-500€ 18 23,1
501-750€ 9 11,5
751-1000€ 5 6,4
1001-1500€ 9 11,5
1501-2000€ 6 7,7
2001-2500€ 1 1,3
Doesn’t answer 16 20,5
Total 78 100,0
Marital status
Married 49 62,8Widowed 5 30,7
Divorced 24 6,4
Working status
(actualand past)(
NR** 14,1%)
Domestic activity 29 37,2Tecnitians and intermediate level
Working status
Armed Forces 8 10,3 Administrative personal and similar 7 9Not qualified professions 7 9
Farmers and farming/fishing trained
personnel 2 2,6
Factory, industry and manual workers 2 2,6
Housing conditions
Own home/ apartment 55 70,5Rented 17 21,8
Others (living with family, etc) 6 7,7
No toilet 3 3,8
(14,1%) Not expensive in relation with income 13 (48,7%)16,7
Not enough space 35
44,9 (32,1%)
Not good public transport offer 46
59 (17,9%)
Reasonable offer of infrastructures 61 (7,7%)78,2
Pollution, noise, other 16
20,5 (19,2%)
Vandalism and crime 10
12,8 (19,2%)
Poor heating and air conditioning 28
35,9 (38,5%)
Income and work/
retirement situation
(20,5%)
Still working 5 6,4Retired (age) 37 47,4
Retired (disablement) 15 19,2
Widowed pension 5 6,4
No finantial support 1 1,3
Other source of income (family,
undisclosed) 11 15,4
Social Support
Living alone 23 29,5Household of two 43 55,1
Household of three 10 12,8
Worry about expenses (11,5%)
Allways 39 50
Sometimes 14 17,9
"A lot" 11 14,1
Never worry 5 6,4
* Freq.: Frequency (abrv)
** NR: no response (%)
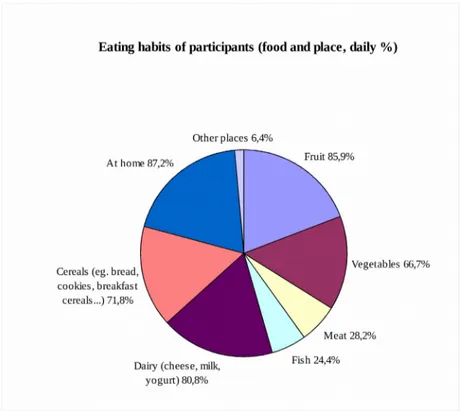
Figure 2. Eating habits of senior students.
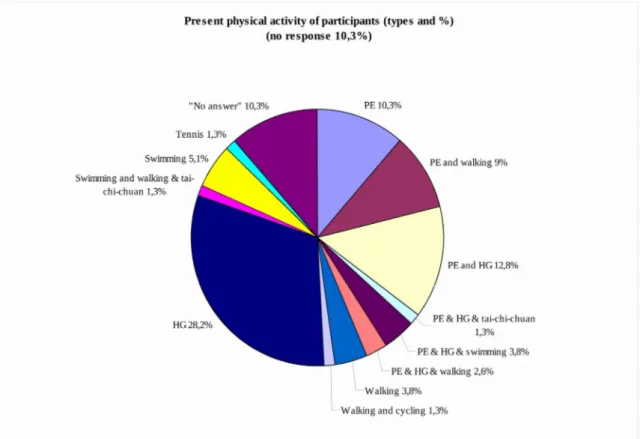
*PE- physical education, HG- hydrogymnastics
Figure 4. Present physical activities of senior students.
*PE- physical education
Appendix 5 Table 3. Pain, sleeping, depression, anxiety, high blood pressure, allergy, asthma, cholesterol, heart medication, other medicines, diabetes medication (%). National data and sample.
Years National
population data [12] Pain in joints
National population data
[12] Headache
National population data
[12] Other pain
Sample Pain
%
National population data
[12] Sleeping
Sample Sleeping
%
National population data
[12] Depression
Sample Depression
%
55-64 28,6 14,3 14,2 52,1 20,0 43,4 12,6 39
65-74 32,5 13,2 13,9 45,2 23,8 23,8 9,4 21,4
75-84 40,4 15,2 14,2 50,0 27,2 25 5,4 41,6
Years National population data [12] Anxiety Sample Anxiety % National population data [12]
High blood pressure
Sample High blood pressure % National population data [12] Allergy Sample Allergy % National population data [12] Asthma Sample Asthma %
55-64 15,8 12,9 45,4 13 4,8 13 3,6 0
65-74 15,5 19,1 56,6 7,1 3,3 9,5 4,3 2,4
75-84 12,7 16,7 57,4 16,7 2,9 8,3 3,8 0
+ 85 9,3 0 52,7 0 1,8 0 5,3 0
Years National population data [12] Cholesterol Sample Cholesterol % National population data [12] Heart medication Sample Heart medication % National population data Other medicines [12] Sample Other medicines % National population data [12] Diabetes Sample Diabetes %
55-64 31,6 13 15,0 26,1 26,5 8,7 15,1 13
65-74 33,8 7,3 23,8 38,1 28,5 2,4 15,6 16,7
75-84 26,3 0 33,6 58,3 31,4 8,3 16,4 16,7
+ 85 16,2 0 47,1 0 35,7 0 7,7 0
Appendix 5.
National population data and sample data: medication, tobacco, alcohol consumption (%).
Appendix 5 Table 2. Tobacco on national population and sample
(%)
Years National population data [12] Actual smokers
Sample % (Frequency) Actual smokers
55-64 13,1% 4,3% (1) N = 23
65-74 6,5% 7,1% (3) N = 42
75-84 3,2% 0% (0) N=12
+ 85 0% 0% (0) N=1
Table 1
. Tobacco use on national population and sample (%)
Appendix 5 Table 3. Alcohol consumption on national population
and sample
(%)
Years National population data
[12] Actual drinkers
Sample % (Frequency) Actual drinkers
55-64 70,8% 17,4% (4) N= 23
65-74 60,7% 21,4% (9) N = 42
75-84 52,6% 41,7% (5) N = 12
+ 85 43,2% 100% (1) N = 1
Appendix 6.
SPSS outputs from chi- square test results.
sexo * consumotabacoactual Crosstabulation
1 56 57
1,8% 98,2% 100,0%
3 18 21
14,3% 85,7% 100,0%
4 74 78
5,1% 94,9% 100,0%
Count
% within sexo Count
% within sexo Count
% within sexo Feminino Masculino sexo Total sim não consumotabacoactual Total Chi-Square Tests
4,953b 1 ,026
2,712 1 ,100
4,261 1 ,039
,057 ,057
4,890 1 ,027
78 Pearson Chi-Square
Continuity Correctiona Likelihood Ratio Fisher's Exact Test Linear-by-Linear Association N of Valid Cases
Value df Asymp. Sig. (2-sided) Exact Sig. (2-sided) Exact Sig. (1-sided)
Computed only for a 2x2 table a.
2 cells (50,0%) have expected count less than 5. The minimum expected count is 1,08.
b.
Test 1. Gender Vs Actual tobacco use Chi square results
IDADE2 * consumotabacoactual Crosstabulation
3 36 39
7,7% 92,3% 100,0%
1 38 39
2,6% 97,4% 100,0%
4 74 78
5,1% 94,9% 100,0% Count
% within IDADE2 Count
% within IDADE2 Count
% within IDADE2 Até 66 anos
Mais de 66 anos IDADE2 Total sim não consumotabacoactual Total Chi-Square Tests
1,054b 1 ,305
,264 1 ,608
1,101 1 ,294
,615 ,308
1,041 1 ,308
78 Pearson Chi-Square
Continuity Correctiona
Likelihood Ratio Fisher's Exact Test Linear-by-Linear Association N of Valid Cases
Value df Asymp. Sig. (2-sided) Exact Sig. (2-sided) Exact Sig. (1-sided)
Computed only for a 2x2 table a.
2 cells (50,0%) have expected count less than 5. The minimum expected count is 2,00.
b.
ESCOLA2 * consumotabacoactual Crosstabulation
1 39 40
2,5% 97,5% 100,0%
3 35 38
7,9% 92,1% 100,0%
4 74 78
5,1% 94,9% 100,0% Count
% within ESCOLA2 Count
% within ESCOLA2
Count
% within ESCOLA2 Até 1º ciclo do ensino
básico
Mais do que o 1º ciclo do Ensino Básico ESCOLA2 Total sim não consumotabacoactual Total Chi-Square Tests
1,166b 1 ,280
,321 1 ,571
1,212 1 ,271
,352 ,288
1,151 1 ,283
78 Pearson Chi-Square
Continuity Correctiona
Likelihood Ratio Fisher's Exact Test Linear-by-Linear Association N of Valid Cases
Value df Asymp. Sig.(2-sided) Exact Sig.(2-sided) Exact Sig.(1-sided)
Computed only for a 2x2 table a.
2 cells (50,0%) have expected count less than 5. The minimum expected count is 1,95.
b.
Test 3. Educational level Vs Actual tobacco use Chi square results
MONTANTE * consumotabacoactual Crosstabulation
3 38 41
7,3% 92,7% 100,0%
1 36 37
2,7% 97,3% 100,0%
4 74 78
5,1% 94,9% 100,0%
Count
% within MONTANTE Count
% within MONTANTE Count
% within MONTANTE até 750 euros
Mais de 750 euros MONTANTE Total sim não consumotabacoactual Total Chi-Square Tests
,851b 1 ,356
,167 1 ,683
,895 1 ,344
,617 ,348
,840 1 ,359
78 Pearson Chi-Square
Continuity Correctiona
Likelihood Ratio Fisher's Exact Test Linear-by-Linear Association N of Valid Cases
Value df Asymp. Sig. (2-sided) Exact Sig. (2-sided) Exact Sig. (1-sided)
Computed only for a 2x2 table a.
2 cells (50,0%) have expected count less than 5. The minimum expected count is 1,90.
b.
sexo * consumoetílicoactual Crosstabulation
7 50 57
12,3% 87,7% 100,0%
12 9 21
57,1% 42,9% 100,0%
19 59 78
24,4% 75,6% 100,0%
Count % within sexo Count % within sexo Count % within sexo Feminino Masculino sexo Total sim não consumoetílicoactual Total Chi-Square Tests
16,763b 1 ,000
14,416 1 ,000
15,464 1 ,000
,000 ,000
16,548 1 ,000
78 Pearson Chi-Square
Continuity Correctiona
Likelihood Ratio Fisher's Exact Test Linear-by-Linear Association N of Valid Cases
Value df Asymp. Sig. (2-sided) Exact Sig. (2-sided) Exact Sig. (1-sided)
Computed only for a 2x2 table a.
0 cells (,0%) have expected count less than 5. The minimum expected count is 5,12.
b.
Test 5. Gender Vs Actual alcohol consumption Chi square results
IDADE2 * consumoetílicoactual Crosstabulation
8 31 39
20,5% 79,5% 100,0%
11 28 39
28,2% 71,8% 100,0%
19 59 78
24,4% 75,6% 100,0%
Count
% within IDADE2 Count
% within IDADE2 Count
% within IDADE2 Até 66 anos
Mais de 66 anos IDADE2 Total sim não consumoetílicoactual Total Chi-Square Tests
,626b 1 ,429
,278 1 ,598
,628 1 ,428
,599 ,299
,618 1 ,432
78 Pearson Chi-Square
Continuity Correctiona
Likelihood Ratio Fisher's Exact Test Linear-by-Linear Association N of Valid Cases
Value df Asymp. Sig. (2-sided) Exact Sig. (2-sided) Exact Sig. (1-sided)
Computed only for a 2x2 table a.
0 cells (,0%) have expected count less than 5. The minimum expected count is 9,50.
b.
ESCOLA2 * consumoetílicoactual Crosstabulation
7 33 40
17,5% 82,5% 100,0%
12 26 38
31,6% 68,4% 100,0%
19 59 78
24,4% 75,6% 100,0% Count
% within ESCOLA2 Count
% within ESCOLA2
Count
% within ESCOLA2 Até 1º ciclo do ensino
básico
Mais do que o 1º ciclo do Ensino Básico ESCOLA2 Total sim não consumoetílicoactual Total Chi-Square Tests
2,096b 1 ,148
1,402 1 ,236
2,113 1 ,146
,190 ,118
2,070 1 ,150
78 Pearson Chi-Square
Continuity Correctiona
Likelihood Ratio Fisher's Exact Test Linear-by-Linear Association N of Valid Cases
Value df Asymp. Sig. (2-sided) Exact Sig. (2-sided) Exact Sig. (1-sided)
Computed only for a 2x2 table a.
0 cells (,0%) have expected count less than 5. The minimum expected count is 9,26.
b.
Test 7. Educational status Vs Actual alcohol consumption Chi square results
MONTANTE * consumoetílicoactual Crosstabulation
9 32 41
22,0% 78,0% 100,0%
10 27 37
27,0% 73,0% 100,0%
19 59 78
24,4% 75,6% 100,0% Count
% within MONTANTE Count
% within MONTANTE Count
% within MONTANTE até 750 euros
Mais de 750 euros MONTANTE Total sim não consumoetílicoactual Total Chi-Square Tests
,272b 1 ,602
,066 1 ,797
,272 1 ,602
,792 ,398
,268 1 ,604
78 Pearson Chi-Square
Continuity Correctiona
Likelihood Ratio Fisher's Exact Test Linear-by-Linear Association N of Valid Cases
Value df Asymp. Sig. (2-sided) Exact Sig. (2-sided) Exact Sig. (1-sided)
Computed only for a 2x2 table a.
0 cells (,0%) have expected count less than 5. The minimum expected count is 9,01.
b.
Chi-Square Tests
Value df
Asymp. Sig. (2-sided)
Pearson Chi-Square 1,780a 3 ,619
Likelihood Ratio 1,631 3 ,652
Linear-by-Linear Association ,502 1 ,479
N of Valid Cases 78
a. 5 cells (62,5%) have expected count less than 5. The minimum expected count is 1,08.
Test 9. Gender Vs Physical activity Chi square results
IDADE2 * actfísicaactual Crosstabulation Count
actfísicaactual
Total sim/vida activa
prática regular de desporto
não/vida
sedentária não responde
IDADE2 Até 66 anos 2 34 0 3 39
Mais de 66 anos 2 28 4 5 39
Total 4 62 4 8 78
Chi-Square Tests
Value df
Asymp. Sig. (2-sided)
Pearson Chi-Square 5,081a 3 ,166
Likelihood Ratio 6,632 3 ,085
Linear-by-Linear Association ,553 1 ,457
N of Valid Cases 78
a. 6 cells (75,0%) have expected count less than 5. The minimum expected count is 2,00.
Test 10. Age Vs Physical activity Chi square results
sexo * actfísicaactual Crosstabulation Count
actfísicaactual
Total sim/vida
activa
prática regular de desporto
não/vida
sedentária não responde
sexo Feminino 3 47 2 5 57
Masculino 1 15 2 3 21
ESCOLA2 * actfísicaactual Crosstabulation Count
actfísicaactual
Total sim/vida
activa
prática regular de
desporto
não/vida sedentária
não responde
ESCOLA 2
Até 1º ciclo do ensino básico
2 31 1 6 40
Mais do que o 1º ciclo do Ensino Básico
2 31 3 2 38
Total 4 62 4 8 78
Chi-Square Tests
Value df
Asymp. Sig. (2-sided)
Pearson Chi-Square 2,951a 3 ,399
Likelihood Ratio 3,088 3 ,378
Linear-by-Linear Association 1,979 1 ,160
N of Valid Cases 78
a. 6 cells (75,0%) have expected count less than 5. The minimum expected count is 1,95.