Edited by: Yuji Morita, Aichi Gakuin University, Japan
Reviewed by: Xian-Zhi Li, Health Canada, Canada Jessica M. A. Blair, University of Birmingham, UK Vassiliy Bavro, University of Essex, UK
*Correspondence: Miguel Viveiros [email protected]
†
These authors have contributed equally to this work.
‡
These authors share the senior authorship.
Specialty section: This article was submitted to Antimicrobials, Resistance and Chemotherapy, a section of the journal Frontiers in Microbiology
Received:30 December 2016 Accepted:06 April 2017 Published:27 April 2017
Citation: Machado D, Coelho TS, Perdigão J, Pereira C, Couto I, Portugal I, Maschmann RDA, Ramos DF, von Groll A, Rossetti MLR, Silva PA and Viveiros M (2017) Interplay between Mutations and Efflux in Drug Resistant Clinical Isolates of Mycobacterium tuberculosis. Front. Microbiol. 8:711. doi: 10.3389/fmicb.2017.00711
Interplay between Mutations and
Efflux in Drug Resistant Clinical
Isolates of
Mycobacterium
tuberculosis
Diana Machado1 †, Tatiane S. Coelho2, 3 †, João Perdigão4, Catarina Pereira4,
Isabel Couto1, Isabel Portugal4, Raquel De Abreu Maschmann2, 5, Daniela F. Ramos3,
Andrea von Groll3, Maria L. R. Rossetti5, 6, Pedro A. Silva2, 3‡and Miguel Viveiros1*‡
1Unidade de Microbiologia Médica, Global Health and Tropical Medicine, Instituto de Higiene e Medicina Tropical, Universidade Nova de Lisboa, Lisboa, Portugal,2Programa de Pós-Graduação em Biologia Celular e Molecular, Centro de Biotecnologia, Fundação Universidade Federal do Rio Grande, Porto Alegre, Brazil,3Núcleo de Pesquisa em Microbiologia Médica, Faculdade de Medicina, Fundação Universidade Federal do Rio Grande, Porto Alegre, Brazil,4iMed.ULisboa, Instituto de Investigação do Medicamento, Faculdade de Farmácia, Universidade de Lisboa, Lisboa, Portugal,5Fundação Estadual de Produção e Pesquisa em Saúde, Centro de Desenvolvimento Científico e Tecnológico, Porto Alegre, Brazil, 6Programa de Pós-Graduação em Biologia Celular e Molecular Aplicada à Saúde, Universidade Luterana do Brasil, Canoas, Brazil
Numerous studies show efflux as a universal bacterial mechanism contributing to antibiotic resistance and also that the activity of the antibiotics subject to efflux can be enhanced by the combined use of efflux inhibitors. Nevertheless, the contribution of efflux to the overall drug resistance levels of clinical isolates of Mycobacterium tuberculosis is poorly understood and still is ignored by many. Here, we evaluated the contribution of drug efflux plus target-gene mutations to the drug resistance levels in clinical isolates of M. tuberculosis. A panel of 17 M. tuberculosis clinical strains were characterized for drug resistance associated mutations and antibiotic profiles in the presence and absence of efflux inhibitors. The correlation between the effect of the efflux inhibitors and the resistance levels was assessed by quantitative drug susceptibility testing. The bacterial growth/survival vs. growth inhibition was analyzed through the comparison between the time of growth in the presence and absence of an inhibitor. For the same mutation conferring antibiotic resistance, different MICs were observed and the different resistance levels found could be reduced by efflux inhibitors. Although susceptibility was not restored, the results demonstrate the existence of a broad-spectrum synergistic interaction between antibiotics and efflux inhibitors. The existence of efflux activity was confirmed by real-time fluorometry. Moreover, the efflux pump genesmmr,mmpL7,Rv1258c,p55, andefpAwere shown to be overexpressed in the presence of antibiotics, demonstrating the contribution of these efflux pumps to the overall resistance phenotype of the M. tuberculosis clinical isolates studied, independently of the genotype of the strains. These results showed that the drug resistance levels of multi- and extensively-drug resistantM. tuberculosisclinical strains are a combination between drug efflux and the presence of target-gene mutations, a reality that is often disregarded by the tuberculosis specialists in favor of the almost undisputed importance of antibiotic target-gene mutations for the resistance in
M. tuberculosis.
Machado et al. Efflux Resistance Levels inM. tuberculosis
INTRODUCTION
The development of mutations in the genes associated with the resistance to the antituberculosis drugs have long been considered the sole cause of resistance in tuberculosis (Zhang and Yew, 2009; da Silva and Palomino, 2011). Nevertheless, Mycobacterium tuberculosis also presents intrinsic drug resistance, mainly attributed to the unusual structure of its mycolic acid-containing cell wall combined with effective efflux mechanisms (Jarlier and Nikaido, 1994; da Silva et al., 2011). The balance between the reduced permeability of the cell wall that acts synergistically with the activity of efflux pumps and the increased expression of genes that code for those efflux pumps is believed to constitute the first step for the development and stabilization of drug resistant phenotypes (Machado et al., 2012; Schmalstieg et al., 2012; Viveiros et al., 2012; da Silva et al., 2016). Previous studies have demonstrated the contribution of efflux mechanisms to antibiotic resistance inM. tuberculosisrevealing the presence of several putative efflux pumps of different classes involved in the transport of different compounds (Viveiros et al., 2012; Black et al., 2014; da Silva et al., 2016; Supplementary Table 1). The best-represented families of efflux transporters in M. tuberculosisare the ATP-binding cassette (ABC) superfamily and the major facilitator superfamily (MFS) followed by the resistance nodulation cell division (RND) superfamily of transporters. The most well-characterized ABC transporters showed to be involved in the transport of multiple drugs are the efflux pumps DrrAB, Rv2686c-2687c-2688c, Rv1456c-Rv1457c-Rv1458c, and the Rv1217c-1218c (Choudhuri et al., 2002; Pasca et al., 2004; Balganesh et al., 2010; Hao et al., 2011; Wang et al., 2013). Among the MFS, the most studied efflux pumps are the Rv1258c (Tap-like), associated with resistance to tetracycline, rifampicin and clofazimine (Siddiqi et al., 2004; Ramón-García et al., 2012); the P55, that confer resistance to aminoglycosides, tetracycline, rifampicin and clofazimine (da Silva et al., 2001; Ramón-García et al., 2009; Bianco et al., 2011); and the EfpA efflux transporter that is associated with resistance to isoniazid, fluoroquinolones and dyes (Doran et al., 1997). The RND efflux pumps are associated with the transport of a wide variety of substrates in M. tuberculosis(Bailo et al., 2015). Among these, it was shown that the MmpL7 protein confer low-level isoniazid resistance when overexpressed (Pasca et al., 2005; Machado et al., 2012). Likewise, the overexpression of the MmpS5-MmpL5 efflux transporter was associated with the resistance ofM. tuberculosis to azoles (Milano et al., 2009) and with the acquired resistance to bedaquiline, the diarylquinoline recently approved for the treatment of multidrug resistant tuberculosis (Andries et al., 2014). The Mmr efflux transporter is the only efflux pump from the small multidrug resistance (SMR) family present in theM. tuberculosisgenome and is associated with the reduced susceptibility ofM. tuberculosisto dyes and antibiotics such as isoniazid, erythromycin, and fluoroquinolones (De Rossi et al., 1998; Rodrigues et al., 2013).
The overexpression of these and other efflux pumps is believed to decrease the intracellular levels of the antibiotics and prevent the drug to reach its cellular target, allowing the emergence of a subpopulation presenting high-level resistance (Machado et al., 2012; Schmalstieg et al., 2012). Noteworthy,
efflux-based mechanisms were recently implicated in the intrinsic resistance to bedaquiline, and the efflux system MmpS5-MmpL5 was identified as being responsible for the non-target based resistance (Andries et al., 2014). In this sense, an approach to overcome the emergence of this efflux-mediated drug resistance can be the combined use of efflux inhibitors and antibiotics.
Up to now, a number of compounds have been shown as potential inhibitors of theM. tuberculosisefflux systems (Viveiros et al., 2012; da Silva et al., 2016). Among these, the most studied are the ion channel blockers like the phenothiazines thioridazine and chlorpromazine and the phenylalkylamine verapamil (Viveiros et al., 2012; da Silva et al., 2016; Machado et al., 2016). The mechanism by which these compounds are active against M. tuberculosis is not fully understood, however, some hypothesis for their mode action have been raised and discussed (Viveiros et al., 2012; Adams et al., 2014; Rayasam and Balganesh, 2015). Verapamil, a calcium channel blocker in eukaryotic cells, is able to decrease the minimum inhibitory concentrations (MICs) of antituberculosis drugs in M. tuberculosis clinical strains (Louw et al., 2011; Machado et al., 2012; Coelho et al., 2015), accelerates the bactericidal and sterilizing activities of antituberculosis drugs in a mouse model (Gupta et al., 2013), potentiates the activity of bedaquiline (Gupta et al., 2014), and inhibits macrophage-induced antibiotic tolerance of M. tuberculosis (Adams et al., 2011, 2014). Likewise, the phenothiazines have shown similar activities in spite of their toxicity compared to verapamil and other efflux inhibitors (Ordway et al., 2003; Viveiros et al., 2012). The phenothiazines disturb the calcium-calmodulin transport and signaling pathways (Salih et al., 1991; Pluta et al., 2011), cause modifications at the level of the bacterial membrane and on nucleic acid stability (Pluta et al., 2011; Thorsing et al., 2013), inhibit the type II NADH-ubiquinone dehydrogenase and other electron-transport chain enzymes (Weinstein et al., 2005), and have significant activity against M. tuberculosis in vitro, ex vivo, and in murine models (Ordway et al., 2003; Machado et al., 2012; Dutta et al., 2014; Singh and Sharma, 2014; Coelho et al., 2015). Recently, we observed that these ion channel blockers lead to a significant decrease in the intracellular mycobacterial load as result of the inducement of phagosome acidification and activation of lysosomal hydrolases (Machado et al., 2016). The potential use of efflux inhibitors in combination with antibiotics may constitute an important alternative as adjuvants of the antituberculosis conventional therapeutic regimen. Previously, we have demonstrated that multidrug resistance and in particular the development of resistance to isoniazid develops in M. tuberculosis laboratory strains associated with the genetic and physiological activity of efflux pumps (Machado et al., 2012). Nonetheless, two questions remain answered—the role of the efflux systems inM. tuberculosisresistant strains that already carry mutations in the drug target genes and how do they respond to the drug pressure despite the presence of these mutations—a contribution to the overall resistance level poorly understood and still disregarded by many.
The main purpose of this study is to assess the role played by the efflux systems inM. tuberculosisstrains that carry mutations
in the drug target genes. In order to do this, we have studied the contribution of efflux to the overall resistance levels toward antituberculosis drugs in a panel of mono-, multi- and extensively drug resistant (MDR/XDR) M. tuberculosis clinical isolates from two geographical distinct areas baring well-known and characterized drug-resistance associated mutations. To quantify the role of efflux in these strains and establish clinical correlation, we performed quantitative drug susceptibility testing (qDST) and investigated the time to detection (TTD) of growth of each strain for first- and second-line antituberculosis drugs in the presence and absence of the efflux inhibitors verapamil, thioridazine, and chlorpromazine. The results obtained revealed that the addition of efflux inhibitors enhanced the effect of the antituberculosis drugs independently of the genotype of theM. tuberculosisstrains. Here we have demonstrated the effectiveness of a synergistic combination of drugs with the conventional therapy despite the presence of a mutation conferring resistance that showed to be beneficial since it reduced the resistance level of the strain. Moreover, these results strongly support the relevance of these inhibitors as adjuvants in tuberculosis chemotherapy.
MATERIALS AND METHODS
Strains
The strains selected for this study are described in Table 1
and were isolated from Portuguese and Brazilian tuberculosis patients as part of the routine mycobacteriology laboratory services provided by Universidade NOVA de Lisboa (Lisboa, Portugal) and Universidade Federal do Rio Grande (Porto
Alegre, Brazil) to the local hospitals. Since the main objective of this work was to analyze the interplay between the mutational resistance and the efflux activity, the strains were selected based on their drug resistance pattern in order to include pan-susceptible, isoniazid monoresistant, rifampicin monoresistant, ofloxacin monoresistant, poly-drug resistant (resistant to more than one first-line antituberculosis drugs other than both isoniazid and rifampicin), MDR (resistant at least to isoniazid and rifampicin), and XDR (MDR plus resistance to any fluoroquinolone and amikacin, kanamycin, or capreomycin) strains. The H37Rv ATCC27294Treference strain was obtained
from the American Type Culture Collection (Virginia, USA), and used as control. Given the retrospective nature of the work involving only anonymized bacterial isolates, informed consent was not required for this study.
Drug Susceptibility Testing and MIC
Determination
First- and second-line drug susceptibility testing (DST) and MIC determination were done using the MGIT 960 system using the Epicenter V5.80A software and the TB eXIST module (Becton Dickinson, Diagnostic Systems, Sparks, MD, USA). The critical concentrations used for DST were as follows: isoniazid, 0.1
µg/ml; rifampicin, 1µg/ml; streptomycin, 1µg/ml; ethambutol,
5 µg/ml; amikacin, 1 µg/ml; capreomycin, 2.5 µg/ml; and
ofloxacin, 1µg/ml. The results were interpreted as follows: at
the time of positivity of the proportional control [Growth units (GU)=400] if the tubes containing the drugs were GU>100, they were considered resistant to that concentration. If the GU of
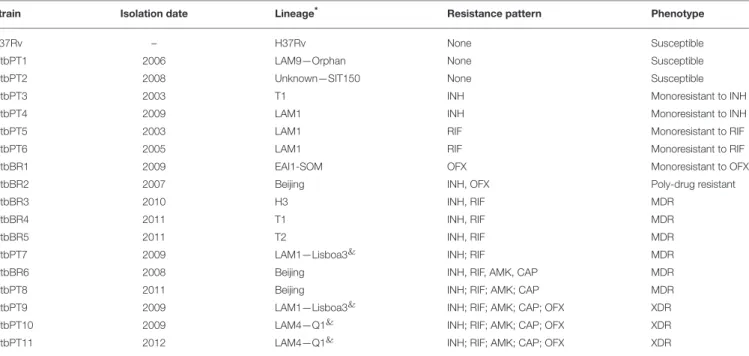
TABLE 1 | Categorization of theM. tuberculosisstrains studied according to their lineage, resistance pattern, and phenotype.
Strain Isolation date Lineage* Resistance pattern Phenotype
H37Rv – H37Rv None Susceptible
MtbPT1 2006 LAM9—Orphan None Susceptible
MtbPT2 2008 Unknown—SIT150 None Susceptible
MtbPT3 2003 T1 INH Monoresistant to INH
MtbPT4 2009 LAM1 INH Monoresistant to INH
MtbPT5 2003 LAM1 RIF Monoresistant to RIF
MtbPT6 2005 LAM1 RIF Monoresistant to RIF
MtbBR1 2009 EAI1-SOM OFX Monoresistant to OFX
MtbBR2 2007 Beijing INH, OFX Poly-drug resistant
MtbBR3 2010 H3 INH, RIF MDR
MtbBR4 2011 T1 INH, RIF MDR
MtbBR5 2011 T2 INH, RIF MDR
MtbPT7 2009 LAM1—Lisboa3& INH; RIF MDR
MtbBR6 2008 Beijing INH, RIF, AMK, CAP MDR
MtbPT8 2011 Beijing INH; RIF; AMK; CAP MDR
MtbPT9 2009 LAM1—Lisboa3& INH; RIF; AMK; CAP; OFX XDR
MtbPT10 2009 LAM4—Q1& INH; RIF; AMK; CAP; OFX XDR
MtbPT11 2012 LAM4—Q1& INH; RIF; AMK; CAP; OFX XDR
*Spoligotype lineages/sublineages according to the international spoligotype database SITVITWEB rules. “Unknown” designates patterns with signatures that do not belong to any of the major lineages defined in the SITVITWEB database.&Lisboa3 and Q1 M. tuberculosis strains were clustered by 24-loci MIRU-VNTR analysis. AMK, amikacin; CAP, capreomycin;
Machado et al. Efflux Resistance Levels inM. tuberculosis
the tube containing the drugs were<100 they were considered susceptible (Springer et al., 2009; Cambau et al., 2015). In these assays, the critical concentration of the antituberculosis drugs are defined as the concentration that is required to eliminate more than 99% of the population of a control strain that never has been in contact with the drug. A strain is considered susceptible to a given drug tested at their critical concentration if, among the population, the proportion of resistant cells is<1% (critical proportion). The strain is considered resistant when the number of drug-resistant bacteria present in the drug-containing tube is
>1%, when compared with the drug-free proportional growth control.
MIC determination of the antibiotics and efflux inhibitors was done within the MGIT 960 system and the growth monitored with the Epicenter V5.80A software as previously described (Machado et al., 2016). The MIC was considered as the lowest concentration with GU < 100 when the drug-free proportional control tube reached a GU = 400. The lowest
concentration tested corresponded to the critical concentration of each antibiotic (susceptibility breakpoint).
An absolute growth control (undiluted) was included in every assay to monitor the normal growth of each strain. In this study, the TTD for positivity of the drug-free proportional control varied between 8 and 16 days depending on the strains. DST and MIC determination were performed at least in duplicate and the final value was given as the result of two concordant values.
Quantitative Drug Susceptibility Testing
qDST of the antibiotics was conducted using the MGIT 960 system and the growth monitored with the Epicenter V5.80A software and the TB eXIST module (Becton Dickinson). The test was performed and interpreted according to the protocol previously described (Cambau et al., 2015). Isoniazid was tested at 0.1, 1, 3, and 10µg/ml, rifampicin and amikacin at 1, 4, and20µg/ml, capreomycin at 2.5, 5, and 25µg/ml, and ofloxacin
at 1, 2, and 10 µg/ml. Antibiotics for which the strains were
resistant at the highest concentration tested by qDST, were further tested at higher concentrations by MIC determination. The interpretation of the results was done as described above. The antibiotic resistance levels were quantified as follows: isoniazid low-level resistance when resistant (R) at 0.1 and susceptible (S) at 1 µg/ml; isoniazid high-level resistance when R≥1µg/ml;
rifampicin and amikacin low-level resistance when R at 4 and S at 20µg/ml; rifampicin and amikacin high-level resistance when
R ≥20µg/ml; capreomycin low-level resistance when R at 5
and S at 25 µg/ml; capreomycin high-level resistance when R
≥25µg/ml; ofloxacin low-level resistance when R at 1 and S
at 2µg/ml; ofloxacin high-level resistance when R≥2µg/ml
(Cambau et al., 2015). The evaluation of bacterial growth/survival vs. growth inhibition was done by the comparison between the TTD, defined as the time from the start of incubation to the positivity signal of growth (Diacon et al., 2014; Bowness et al., 2015), of a given strain in the presence and absence of an inhibitor (1TTD). To obtain the degree of potentiation of each compound on the antibiotic activity, the1TTD was normalized against the control tube with no inhibitor. qDST was performed at least in duplicate and the final value was given as the result of two concordant values.
Detection of Mutations Associated with
Resistance
Genomic DNA was isolated using the QIAamp DNA mini kit (QIAGEN, GmbH, Hilden, Germany) according to the manufacturer’s instructions. The most common mutations in inhA regulatory region, and katG, gyrA, and rrs genes
were studied using the Genotype MTBDRplus and MTBDRsl
(Hain Lifescience GmbH, Nehren, Germany) according to the manufacturer’s instructions. Genomic analysis of the complete inhA, katG, and tlyA genes and eis promoter region was performed by PCR amplification and DNA sequencing using the primers described elsewhere (Feuerriegel et al., 2009; Machado et al., 2013; Perdigão et al., 2013). The annealing temperatures were 60◦C forinhA, 62◦C forkatG, 56◦C foreis,and 55◦C for tlyA.
Evaluation of Ethidium Bromide
Accumulation and Efflux
Real-time detection of efflux activity was performed with a semi-automated fluorometric method using a Rotor-Gene 3000 thermocycler (Corbett Research, Sydney, Australia) (Paixão et al., 2009; Viveiros et al., 2010; Rodrigues et al., 2015). The assays were performed as previously described (Machado et al., 2012). M. tuberculosis strains were grown in 10 ml of Middlebrook 7H9 (Difco, Madrid, Spain) supplemented with 10% OADC (oleic acid, albumin, dextrose, catalase; Becton and Dickinson) with 0.05% Tween 80 at 37◦C until an OD600 nm(OD600) of 0.8. The cells were collected by
centrifugation at 2940×g for 3 min, the supernatant discarded, the pellet washed in PBS and centrifuged again in the same conditions.
Ethidium Bromide Accumulation Assays
For the ethidium bromide accumulation assays, the pellet was resuspended in PBS and the OD600adjusted to 0.8. To determine
the concentration of ethidium bromide that establishes the equilibrium between efflux and influx, the cells were incubated with different concentrations of ethidium bromide (0.625–5
µg/ml). The assays were conducted at 37◦C in a Rotor-Gene 3000
(530; 585 nm) and the equilibrium concentration determined for each strain as the concentration that promoted a plateau of no more than 10% of relative fluorescence units during the 60 min of the assay. To evaluate the effect of the efflux inhibitors on the accumulation of ethidium bromide, the assays were performed as described above with the exception that each inhibitor was added to the buffer solution at half MIC and ethidium bromide was used at the equilibrium concentration (determined for each strain). The inhibitory activity of the compounds was determined by the calculation of the relative final fluorescence (RFF;Machado et al., 2011) which is a measure of how effective the compound is on the inhibition of ethidium bromide efflux (at a given concentration) by comparison of the final fluorescence at the last time point (60 min) of the treated cells with the cells in presence of only ethidium bromide. An index of activity above zero indicated that the cells accumulate more ethidium bromide under the condition used than those of the control (non-treated cells). Negative RFF values indicated that the treated cells accumulated less ethidium bromide than those of the control condition.
Values above 1 in the presence of the efflux inhibitors indicated enhanced accumulation of ethidium bromide inside the cells. The experiments were done in triplicate and the RFF values are presented as the average of three independent assays plus standard deviation (±SD).
Ethidium Bromide Efflux Assays
For the ethidium bromide efflux assays, the pellet was
resuspended in PBS and the OD600 adjusted to 0.4. The
cell suspensions were exposed to ethidium bromide at the equilibrium concentration determined above, in the presence of verapamil at half MIC for 1 h at room temperature. The cells were then pelleted by centrifugation and resuspended in new buffer with and without 0.4% glucose in the presence and absence of half MIC of verapamil and the fluorescence measured as described above. Data was normalized by comparing the relative fluorescence units obtained under the conditions that promote efflux (presence of glucose and absence of verapamil) with the relative fluorescence units from the control in which there is no efflux (presence of verapamil and no glucose). The RFF corresponds to the ratio of the fluorescence that remains per unit of time, relatively to the cells in presence of the inhibitor.
RT–qPCR Analysis of Putative Efflux Pumps
Strains were grown in MGIT tubes (mycobacteria growth indicator tubes; Becton Dickinson) for the MGIT 960 system in the presence of half MIC of each antibiotic as follows: MtbPT3 was exposed to isoniazid; MtbPT5 was exposed to rifampicin; MtbBR1 was exposed to ofloxacin; H37Rv, MtbPT7, and MtbPT11 were exposed to isoniazid or rifampicin. Total RNA was extracted using a GTC/Trizol method as previously described (Machado et al., 2016). The relative expression level of the efflux pump genesmmpL7,p55,efpA,mmr,Rv1258c,and Rv2459was analyzed by RT-qPCR. The primer sets and sequences of oligonucleotides used are described elsewhere (Machado et al., 2012). RT-qPCR assay was performed in a Rotor-Gene 3000 thermocycler and followed the protocol recommended for use with the QuantiTect SYBR Green RT-PCR Kit (QIAGEN) with the following amplification program: reverse transcription for 30 min at 50◦C; initial activation step for 15 min at 95◦C; 35 cycles of denaturation at 94◦C for 30 s, annealing at 52◦C for 30 s and extension at 72◦C for 30 s; a final extension step at 72◦C for 5 min; and an additional step at 50◦C for 15 s followed by melt analysis (50–99◦C). The determination of the relative mRNA expression level was performed using the comparative quantification cycle (Cq) method (Livak and Schmittgen, 2001). The relative expression of each target gene was determined by comparison of the relative quantity of the respective mRNA in the presence of the antibiotic to the non-exposed condition. Each strain was assayed in triplicate using total RNA obtained from three independent cultures. A relative expression level equal to 1 indicated that the expression level was identical to the unexposed strain. Genes showing expression levels above one were considered to be overexpressed. Genes showing expression levels above two were considered to be significantly overexpressed. Normalization of the mRNA levels was done using theM. tuberculosis16S rDNA as internal controlfor each experiment and presented as the mean-fold change (±SD) compared with the control.
MIRU-VNTR and Spoligotyping Analysis
Mycobacterial Interspersed Repetitive Unit—Variable Number of Tandem Repeats (MIRU-VNTR) genotyping was performed by multiplex PCR amplification of 24-loci MIRU-VNTR, as described previously (Supply et al., 2006). Spoligotyping was performed as per Kamerbeek et al. (1997). The genotype ofthese strains was analyzed using the MIRU-VNTRplus web
application (Allix-Béguec et al., 2008; Weniger et al., 2010) and the SITVITWEB database (Demay et al., 2012).
Data Analysis
Data analysis was carried out using the Student’st-test. A∗P<
0.05 was considered statistically significant and highly significant when∗∗P<0.01 and∗∗∗P<0.001 (two-tailed tested).
RESULTS
Correlation between the Phenotype and
Mutations Associated with Antibiotic
Resistance
Firstly, to establish a correlation between the phenotypic
drug resistance level and the presence of resistance
associated mutations, we searched for mutations in the genes associated with drug resistance to the antibiotics studied (Table 2).
The three pan-susceptible strains showed no mutation in any of the genes evaluated. Resistance to isoniazid was associated
with mutations in the katG and inhA genes which are in
accordance with published data (Cambau et al., 2015; Domínguez et al., 2016). MtbPT3 showed the S315T mutation in katG and MtbPT4 presented the C-15T substitution in the inhA promoter region. Among the nine MDR strains, five harbored mutations in katG, of which four had the S315T mutation and one has a rare mutation at codon 735. The remaining four strains harbored double mutations in inhA. The double mutations C-15T/S94A were detected in strains MtbPT7 and MtbPT9 and the pair C-15T/I194T was detected in MtbPT10 and MtbPT11.
In respect to rifampicin resistance, all MDR strains and the two rifampicin monoresistant strains showed the mutation S531L in rpoB. This is the most common mutation found in clinical isolates resistant to rifampicin (Cambau et al., 2015; Domínguez et al., 2016). Strain MtbBR2 carries the mutation D516Y in rpoB but it was found susceptible to rifampicin. Although was not our aim to evaluate susceptible strains, MtbBR2 was initially found to be resistant to rifampicin at 1 µg/ml (critical concentration). After re-testing MtbBR2
Machado et al. Efflux Resistance Levels inM. tuberculosis
TABLE 2 | Mutations associated with resistance to first- and second-line drugs detected in theM. tuberculosisstrains in study.
Strain ID Mutations
INH RIF AMK/CAP AMK CAP OFX
inhAprom inhAORF katG rpoBRRDR rrs1400 region eisprom tlyA gyrAQRDR
SUSCEPTIBLE
H37Rv wt wt wt wt wt wt wt wt
MtbPT1 wt wt wt wt wt wt wt wt
MtbPT2 wt wt wt wt wt wt wt wt
INHR
MtbPT3 wt wt S315T wt wt nt nt wt
MtbPT4 C-15T wt wt wt wt nt nt wt
RIFR
MtbPT5 wt nt wt S531L wt wt wt wt
MtbPT6 wt nt wt S531L wt nt nt wt
OFXR
MtbBR1 wt nt wt wt wt nt nt D94N
Poly-DR
MtbBR2 wt nt S315T D516Y wt nt nt A90V
MDR
MtbBR3 wt nt S315T S531L wt wt nt wt
MtbBR4 wt nt S315T S531L wt wt nt wt
MtbBR5 wt nt S315T S531L wt wt nt wt
MtbPT7 C-15T S94A wt S531L wt wt wt wt
MtbBR6 wt nt D735A S531L A1401G wt wt wt
MtbPT8 wt wt S315T S531L wt/A1401G* wt wt wt
XDR
MtbPT9 C-15T S94A wt S531L wt G-10A ins GT at pos 755/756 S91P
MtbPT10 C-15T I194T wt S531L A1401G wt wt D94A
MtbPT11 C-15T I194T wt S531L A1401G nt nt D94A
*Heteroresistance. AMK, amikacin; CAP, capreomycin; ID, identification; INH, isoniazid; MDR, multidrug resistant; nt, not tested; OFX, ofloxacin; ORF, open reading frame; Poly-DR, poly-drug resistant; Prom, promoter; QRDR, quinolone resistance determining region; RIF, rifampicin; RRDR, rifampicin resistance determining region; wt, wild-type sequence; XDR, extensively drug resistant.
susceptible strains (Somoskovi et al., 2006; Andres et al., 2014), therefore a non-consensual genotype associated to resistance important to be included and analyzed in the context of this study.
Regarding second-line drugs, the MDR strains MtbBR6 and MtbPT8 were additionally resistant to one second line-injectable drug, and MtbBR2 was resistant to ofloxacin. MtbBR6 and MtbPT8 harbored a mutation in rrs, A1401G, and in strain
MtbBR2 was found the A90V mutation in gyrA. MtbPT9,
MtbPT10, and MtbPT11 were classified as XDR. Strains MtbPT10 and MtbPT11 harbored therrs A1401G. This is the most common mutation found in clinical isolates resistant to second-line aminoglycosides (Cambau et al., 2015; Domínguez et al., 2016). For MtbPT9, no mutation could be found in therrs gene. The resistance to amikacin was assigned to a mutation in eis promoter and the resistance to capreomycin was attributed to the insertion of a GT base pair at position 755/756 of the tlyAgene. The mutation G-10A in theeispromoter region was previously showed to be associated with resistance to kanamycin (Zaunbrecher et al., 2009) and with low-level resistance to
amikacin (Perdigão et al., 2013). The insertion of a GT base pair at position 755/766 oftlyA was previously showed to be associated with capreomycin resistance (Perdigão et al., 2013). Resistance to ofloxacin of these three strains was associated with common mutations ingyrAat codons 91 and 94 (Table 2;
Cambau et al., 2015; Domínguez et al., 2016). MtbBR1 exhibited monoresistance to ofloxacin associated with a mutation ingyrA, D94N.
Summing up, we have selected a representative and diverse sample of clinical strains of M. tuberculosis from two geographical distinct areas harboring the most representative gene mutations in known drug targets, accounting for clinical resistance to the most important first- and second-line antituberculosis drugs. As per the most commonly accepted dogma about the mechanisms accounting for drug resistance in M. tuberculosis, the sole cause of the resistance levels noticed in these strains are expected to be derived exclusively from the diminished affinity of the mutated genes toward the respective antibiotic (Zhang and Yew, 2009; Domínguez et al., 2016).
Quantification of the Drug Resistance
Levels in the Presence of Efflux Inhibitors
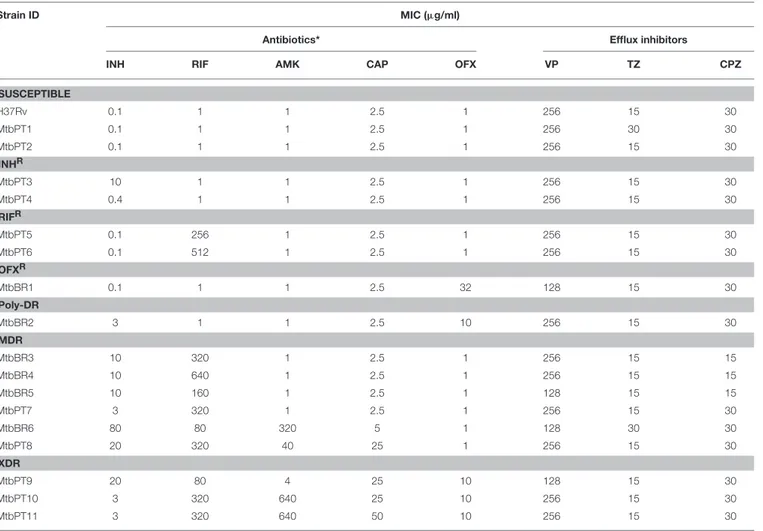
Secondly, we quantified the drug resistance levels of the strains toward the antibiotics in study. For this purpose, the MICs of the antibiotics and efflux inhibitors were determined for each strain and the results are presented inTable 3. The MICs of the efflux inhibitors were found to be quite homogenous among the seven groups of strains. Conversely, the MICs of the antibiotics showed that for the same mutation different resistance levels were present. Therefore, we hypothesize that the different resistance levels presented for the same genotype are due to different levels of active efflux of the antibiotics. The existence of active efflux was evaluated indirectly through the reduction of the resistance levels of the antibiotics in the presence of the efflux inhibitors verapamil, thioridazine and chlorpromazine by qDST and MIC determination (Table 4).Resistance Levels for Isoniazid
Eleven out of 12 strains resistant to isoniazid presented high-level resistance (R≥1µg/ml). Efflux activity was detected in all except
MtbPT4, the only strain that showed low-level resistance. The
low-level resistance presented by this strain was attributed to the single C-15T mutation, which results ininhAoverexpression and leads to titration of isoniazid and consequent mild increased resistance. For the remaining 11 strains, the resistance levels were reduced from high- to low-level (R < 1 µg/ml) in 4/11 with
verapamil; 2/11 with thioridazine; and 5/11 with chlorpromazine. For the strains that do not reached low-level resistance, the MICs were reduced to 3µg/ml. In respect to the efflux levels of the
strains that harbored mutations inkatG, the results showed that they have less efflux activity than those presenting mutations in inhA. Strains MtbPT7, MtbPT9, MtbPT10, and MtbPT11 have the C-15T mutation and additionally have a mutation in theinhA ORF contributing to their high-level resistance to isoniazid, as previously shown (Machado et al., 2013). The level of resistance of these strains was reduced with the efflux inhibitors to values always above that conferred by the single mutation in theinhA promoter (0.4 µg/ml), suggesting that the net resistance level
conferred byinhAdouble mutations (promoter plus ORF) bears also a strong contribution from efflux. Noteworthy is that the strain MtbBR6 with a rare mutation in katG presents high-level resistance that could be reduced by all inhibitors tested.
TABLE 3 | MIC of antibiotics and efflux inhibitors for theM. tuberculosisstrains studied.
Strain ID MIC (µg/ml)
Antibiotics* Efflux inhibitors
INH RIF AMK CAP OFX VP TZ CPZ
SUSCEPTIBLE
H37Rv 0.1 1 1 2.5 1 256 15 30
MtbPT1 0.1 1 1 2.5 1 256 30 30
MtbPT2 0.1 1 1 2.5 1 256 15 30
INHR
MtbPT3 10 1 1 2.5 1 256 15 30
MtbPT4 0.4 1 1 2.5 1 256 15 30
RIFR
MtbPT5 0.1 256 1 2.5 1 256 15 30
MtbPT6 0.1 512 1 2.5 1 256 15 30
OFXR
MtbBR1 0.1 1 1 2.5 32 128 15 30
Poly-DR
MtbBR2 3 1 1 2.5 10 256 15 30
MDR
MtbBR3 10 320 1 2.5 1 256 15 15
MtbBR4 10 640 1 2.5 1 256 15 15
MtbBR5 10 160 1 2.5 1 128 15 15
MtbPT7 3 320 1 2.5 1 256 15 30
MtbBR6 80 80 320 5 1 128 30 30
MtbPT8 20 320 40 25 1 256 15 30
XDR
MtbPT9 20 80 4 25 10 128 15 30
MtbPT10 3 320 640 25 10 256 15 30
MtbPT11 3 320 640 50 10 256 15 30
M
a
c
h
a
d
o
e
t
a
l.
E
fflu
x
R
e
sis
ta
n
c
e
L
e
ve
ls
in
M
.
tu
b
e
rc
u
lo
s
is
TABLE 4 | Quantitative drug susceptibility testing for isoniazid, rifampicin, amikacin, and ofloxacin in the presence and absence of efflux inhibitors.
Antibiotic Quantitative susceptibility testing (µg/ml)
Suscep. INHR RIFR OFXR Poly-DR MDR XDR
H37Rv MtbPT3 MtbPT4 MtbPT5 MtbPT6 MtbBR1 MtbBR2 MtbBR3 MtbBR4 MtbBR5 MtbPT7 MtbBR6 MtbPT8 MtbPT9 MtbPT10 MtbPT11
INH No EI 0.1 10 0.4 – – – 10 10 10 10 3 80 20 20 3 3
+VP 0.1 10 0.4 – – – 3 3 3 3 1 3 10 1 1 1
+TZ 0.1 3 0.4 – – – 3 3 10 3 1 3 3 20 1 3
+CPZ 0.1 3 0.4 – – – 1 10 10 3 1 3 3 1 1 1
RIF No EI 1 – – 256 512 – 1 320 640 160 320 80 320 80 320 320
+VP 1 – – 32 32 – <0.125 40 40 20 20 20 20 20 20 20
+TZ 1 – – 256 32 – <0.125 80 320 40 320 80 320 20 320 320
+CPZ 1 – – 32 20 – <0.125 80 320 40 320 20 20 4 20 20
AMK No EI 1 – – – – – – – – – – 320 40 4 640 640
+VP 1 – – – – – – – – – – 320 1 4 640 640
+TZ 1 – – – – – – – – – – 320 1 4 640 640
+CPZ 1 – – – – – – – – – – 320 1 4 40 40
CAP No EI 2.5 – – – – – – – – – – 5 25 25 25 50
+VP 2.5 – – – – – – – – – – 5 25 25 5 5
+TZ 2.5 – – – – – – – – – – 2.5 25 25 5 25
+CPZ 2.5 – – – – – – – – – – 2.5 25 25 5 5
OFX No EI 1 – – – – 32 10 – – – – – – 10 10 10
+VP 1 – – – – 16 2 – – – – – – 10 10 10
+TZ 1 – – – – 16 <1 – – – – – – 10 10 10
+CPZ 1 – – – – 16 <1 – – – – – – 10 10 10
The lowest concentration tested corresponds to the critical concentration for each antibiotic except for rifampicin testing for strain MtbBR2 (see Section Materials and Methods for details). Synergistic interactions are in bold; –, not done. AMK, amikacin; CAP, capreomycin; CPZ, chlorpromazine; EI, efflux inhibitor; INH, isoniazid; MDR, multidrug resistant; OFX, ofloxacin; RIF, rifampicin; TZ, thioridazine; VP, verapamil; XDR, extensively drug resistant.
F
ro
n
tie
rs
in
M
ic
ro
b
io
lo
g
y
|w
w
w
.fr
o
n
tie
rs
in
.o
rg
8
A
p
ril
2
0
1
7
|V
o
lu
m
e
8
|
A
rtic
le
7
1
The difference between the levels of resistance caused by this mutation compared with those presented by the strains with the katG S315T mutation may be due to fitness cost. It is known that the mutation S315T has no fitness cost for the bacteria (Gagneux, 2009) being the most frequent and successful katG mutation accounting for isoniazid resistance worldwide (Seifert et al., 2015). Efflux activity is minimal in strains that bare this mutation since they don’t need efflux to cope with the presence of isoniazid. These results confirm our previous findings that the high-levels of resistance associated with mutations ininhA have an increased component of efflux when compared withM. tuberculosisstrains with high-level resistance associated with the katGS315T mutation (Machado et al., 2016).
Resistance Levels for Rifampicin
All the strains resistant to rifampicin presented high-level resistance (R≥20µg/ml). Efflux activity was detected in all with
all the inhibitors although with different efficiencies (Table 4). The resistance levels toward rifampicin were significantly reduced in the presence of verapamil (11/11), thioridazine (4/11), and chlorpromazine (9/11). To assess the contribution of efflux activity to the borderline susceptibility toward rifampicin in MtbBR2, this strain was evaluated for susceptibility to rifampicin in the presence of efflux inhibitors. Notably, the borderline susceptibility was reversed with all inhibitors tested to concentrations well below the critical concentration (Table 4). We hypothesize that the rpoB D516Y mutation is associated with intermediate rifampicin susceptibility that has a strong association with efflux activity. For all other strains, the results demonstrated that efflux acts synergistically with mutations associated with rifampicin resistance although the rpoBS531L mutation is sufficient to produce high-levels of resistance to this antibiotic.
Resistance Levels for Amikacin and Capreomycin
The rrs A1401G is associated with high-levels resistance to amikacin and capreomycin (Sirgel et al., 2011; Du et al., 2013). Strains MtbBR6, MtbPT8, MtbPT10, and MtbPT11 share the mutation A1401G. Efflux activity was detected in all except in MtbBR6 (Table 4). Amikacin resistance levels of MtbPT10 and MtbPT11 were reduced with chlorpromazine from 640 to 40 µg/ml, a 16-fold reduction. However, although significant,
this reduction was not sufficient to reach amikacin low-level resistance. The low-level resistance to amikacin of MtbPT9 was due to a mutation in theeispromoter region and no reduction was obtained with any of the inhibitors tested. Amikacin is acetylated by Eis (Zaunbrecher et al., 2009). We hypothesize that the structural modification of the drug impairs substrate recognition and consequently its efflux by the efflux pumps but more studies are required to demonstrate this. Strain MtbPT8 showed the lowest level of resistance to amikacin (40 µg/ml)
when compared with the other three amikacin resistant strains with the rrs A1401G mutation. In this strain, the resistance to amikacin was reversed with all the efflux inhibitors. This strain is heteroresistant to amikacin, i.e., the strain population is composed by an amikacin-susceptible subpopulation and an amikacin-resistant subpopulation. Heteroresistance was detected
by reverse hybridization using the MTBDRslassay. The detection of mixed genotypes (hybridization with both wild-type and resistant probes) in the same sample is dependent on the concentration of each individual genotype.Zhang et al. (2013)
showed that the low-level of amikacin resistance presented by heteroresistant strains in mainly due to the presence of the drug susceptible population. This data indicates that the proportion of the amikacin-resistant subpopulation is reduced comparatively with the amikacin-susceptible subpopulation only conferring low-level resistance. Therefore, the resistant population during the acquired resistance pathway could be highly reduced in the presence of efflux inhibitors, further demonstrating the contribution of efflux to the establishment and stabilization of mutations in aM. tuberculosispopulation under drug selection (Machado et al., 2012; Schmalstieg et al., 2012).
Of the five strains resistant to capreomycin, four have the mutationrrsA1401G (including the heteroresistant one) and one presented a mutation intlyA. With the exception of MtbBR6 all the others presented high-level resistance toward this antibiotic. The low-level resistance presented by MtbBR6 was reversed with thioridazine and chlorpromazine. Capreomycin resistance was reduced to low-level with verapamil (2/5), chlorpromazine (2/5), and thioridazine (1/5). Interesting, capreomycin resistance could not be reduced with any of the inhibitors tested in the heteroresistant strain (MtbPT8) for which amikacin resistance was reversed. Since cross-resistance between amikacin and capreomycin is due to the mutationrrsA1401G, this unexpected result may be explained by the existence of an unknown mechanism associated with capreomycin resistance in this strain. We search for mutations intlyAthat could co-exist with therrs mutation but none was found and this subject will be explored in future work. It was not possible to reduce capreomycin resistance in MtbPT9 which is associated with an insertion mutation in tlyA. Capreomycin is methylated by TlyA and the loss of methyltransferase activity due to the presence of mutations in tlyAreduces susceptibility to this drug (Maus et al., 2005). Similar to that observed for Eis, we can speculate that the alteration of an essential pathway necessary for the binding of the drug to the target will hamper the substrate recognition and consequently its efflux by the mycobacterial efflux pumps.
Resistance Levels for Ofloxacin
Resistance to fluoroquinolones involve mainly mutations in gyrA and the most common are at positions 90, 91, and 94 which are associated with high-level resistance (Cambau et al., 2015). All the strains resistant to ofloxacin presented high-level resistance (Table 4). Resistance to ofloxacin of strains MtbPT9 to MtbPT11 could not be reduced with any of the inhibitors tested. On these strains, resistance could be solely attributed to the mutations S91P and D94A ongyrA. For MtbBR1 only basal efflux activity could be detected (Table 4). Contrary, ofloxacin resistance of strain MtbBR2 was reversed by thioridazine and chlorpromazine to levels below the critical concentration and reduced from 10 to 2 µg/ml with verapamil (Table 4). This
Machado et al. Efflux Resistance Levels inM. tuberculosis
i.e., the level of resistance can be close or below the critical concentration of 1 µg/ml (Niward et al., 2016). In contrast, Farhat et al. (2016) reported that strains with thegyrA A90V mutation have a comparable effect on ofloxacin MIC as the mutation D94A/G (1 µg/ml>MIC<10 µg/ml). Other studies
associate this mutation with ofloxacin resistance above 2µg/ml
(Poissy et al., 2010; Cambau et al., 2015). Our results showed that the A90V mutation can confer resistance up to 2µg/ml and
that the remaining resistance presented has an efflux component that can be reduced with an efflux inhibitor. This mutation have also been found in strains harboring both mutated and wild-type sequences, i.e., fluoroquinolone heteroresistant strains, or in samples harboring two different strains (van den Boogaard et al., 2011). The discrepancies noted between these studies together with the evidence that efflux in linked to this mutation may indicate that the mutation gyrAA90V is associated with intermediate resistance to ofloxacin in strong association with fluoroquinolone efflux that increases the levels of resistance, nevertheless, more studies are needed to support this hypothesis. All other gyrA mutations detected were sufficient to produce stable ofloxacin resistance demonstrating that efflux has little contribution toward ofloxacin resistance when these mutations are present.
Determination of the Intrinsic Efflux
Capacity of the
M. tuberculosis
Strains
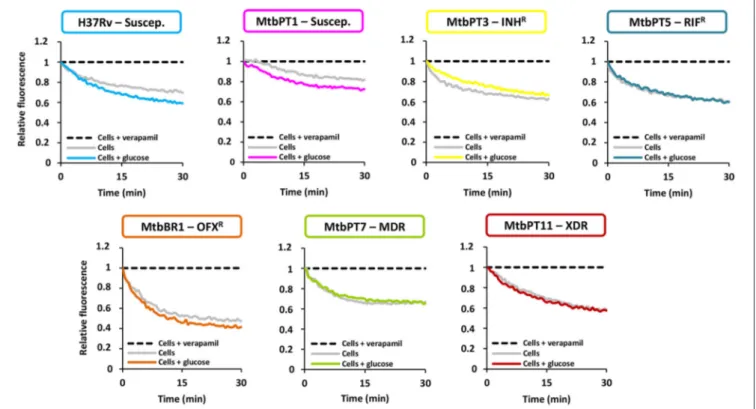
Thirdly, to confirm the existence of active efflux systems on these strains we have evaluated their ability to efflux ethidiumbromide, a fluorescent efflux substrate, by real-time fluorometry (Paixão et al., 2009; Viveiros et al., 2010; Machado et al., 2012). To perform these assays, one representative of each drug resistant group was selected: MtbPT3, monoresistant to isoniazid; MtbPT5, monoresistant to rifampicin; MtbBR1, monoresistant to ofloxacin; MtbPT7, multidrug resistant, and MtbPT11, extensively drug resistant (Figure 1).M. tuberculosis H37Rv and MtbPT1 were included as representatives of drug susceptible strains. The strains were incubated with ethidium bromide at the equilibrium concentration determined for each strain and verapamil at half MIC (seeTable 3for MIC values) for 1 h. After this period, verapamil was washed out from the solution, the cells were assayed with glucose, as energy source, and without glucose, and their efflux capacity was measured by fluorometry (see Section Materials and Methods for details). As can be observed in Figure 1, efflux of ethidium bromide was detected in all these strains (colored curve), although with different efficiencies, which was inhibited in presence of verapamil at half MIC (black dashed line). It was also noted that the efflux of ethidium bromide is not affected by the presence of glucose (compare gray curve with the colored curve on each graph) which shows that the external energization of the cells is not necessary to guarantee an optimal efflux activity inM. tuberculosis, a common requirement for efficient efflux in Gram-negative bacteria (Paixão et al., 2009; Viveiros et al., 2010). The assays performed with the susceptible strains further confirmed that efflux activity in M. tuberculosis is an intrinsic characteristic of susceptible and drug resistance strains
FIGURE 1 | Assessment of efflux activity on theM. tuberculosisstrains in study.Ethidium bromide was used at the equilibrium concentration for each strain as follows: 0.25µg/ml for H37Rv, MtbPT1, MtbPT5, MtbPT7, and MtbPT11; 0.5µg/ml, MtbPT3; and 1µg/ml, MtbBR1; verapamil was tested at half MIC.
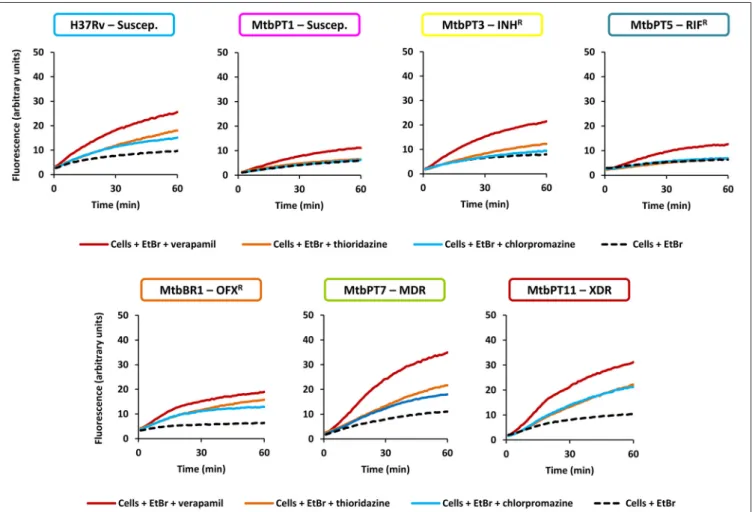
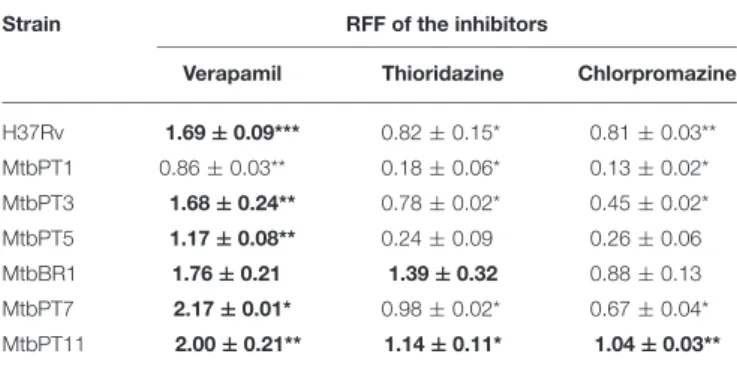
(Machado et al., 2012). The different degrees of efflux activity observed, e.g., MtbBR1 presented increased efflux activity and MtbPT1 presented reduced efflux activity compared with the other strains, may be related to the different environmental conditions to which these strains were subject in the clinical setting. To further confirm that the efflux activity of these strains could be inhibited in the presence of the efflux inhibitors, we performed ethidium bromide accumulation assays in presence of verapamil, thioridazine, and chlorpromazine (Figure 2) and determined the RFF index (Table 5). The RFF index is a measure of how efficient is the inhibitor in promoting intracellular accumulation of ethidium bromide. The results showed that the three inhibitors were capable to increase the ethidium bromide accumulation in all the tested strains (Table 5). The most efficient efflux inhibitor in these assays was verapamil (6/7), followed by thioridazine (2/7), and chlorpromazine (1/7). The results demonstrated that these compounds are able to promote intracellular accumulation of ethidium bromide onM. tuberculosis susceptible, monoresistant and MDR/XDR strains, clearly putting in evidence that active efflux is inhibited by these compounds.
Effect of Antibiotics on Efflux Pump Gene
Expression
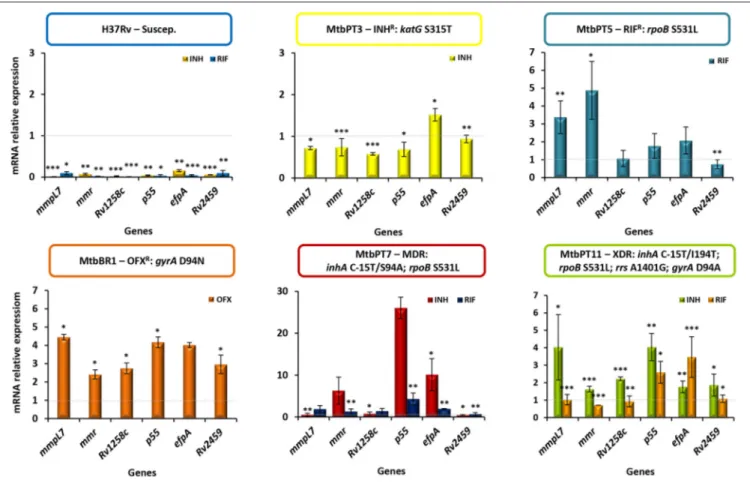
To further corroborate these findings we analyzed the transcriptional profile of putative efflux pumps described in the literature as being associated with antibiotic resistance phenotypes ofM. tuberculosisstrains (Viveiros et al., 2012; Black et al., 2014; da Silva et al., 2016). RT-qPCR was done for six genes previously shown to be overexpressed in response to antibiotic exposure (Machado et al., 2012, 2016). The results showed the occurrence of significant changes in the expression levels in all strains upon exposure to the antibiotics except in the susceptible H37Rv strain (Figure 3). Concerning the monoresistant strains, in MtbPT3 exposed to isoniazid only efpAwas found overexpressed. In strain MtbPT5 exposed to rifampicin, from the six genes tested, four were found overexpressed namelymmpL7, mmr,p55,andefpA. The ofloxacin resistant strain MtbBR1 when exposed to ofloxacin showed significant overexpression all the genes tested (≥two-fold expression). The MDR and XDR strains were exposed to rifampicin or isoniazid and similar patterns were observed. Three to six genes were overexpressed upon exposure to isoniazid or rifampicin. P55 showed the highest level
FIGURE 2 | Evaluation of the effect of efflux inhibitors on the accumulation of ethidium bromide on theM. tuberculosisstrains in study.Ethidium bromide (EtBr) was used at the equilibrium concentration for each strain as follows: 0.25µg/ml for H37Rv, MtbPT1, MtbPT5, MtbPT7, and MtbPT11; 0.5µg/ml,
Machado et al. Efflux Resistance Levels inM. tuberculosis
TABLE 5 | RFF based on the accumulation of ethidium bromide for the M. tuberculosisstrains in the presence of efflux inhibitors.
Strain RFF of the inhibitors
Verapamil Thioridazine Chlorpromazine
H37Rv 1.69±0.09*** 0.82±0.15* 0.81±0.03** MtbPT1 0.86±0.03** 0.18±0.06* 0.13±0.02*
MtbPT3 1.68±0.24** 0.78±0.02* 0.45±0.02* MtbPT5 1.17±0.08** 0.24±0.09 0.26±0.06 MtbBR1 1.76±0.21 1.39±0.32 0.88±0.13 MtbPT7 2.17±0.01* 0.98±0.02* 0.67±0.04* MtbPT11 2.00±0.21** 1.14±0.11* 1.04±0.03**
Ethidium bromide was used at the equilibrium concentration for each strain as follows: 0.25µg/ml, H37Rv, MtbPT1, MtbPT5, MtbPT7, and MtbPT11; 0.5µg/ml, MtbPT3; and 1µg/ml, MtbBR1; the inhibitors were tested at half MIC. The effect of the inhibitors on the accumulation of ethidium bromide was interpreted as follows: RFF values above zero indicated that the cells accumulate more ethidium bromide under the condition used than those of the control (non-treated cells). Values in boldface (above 1) indicated enhanced accumulation of ethidium bromide in the presence of the efflux inhibitors. Each assay was performed in triplicate and the results presented correspond to the average of three independent assays plus standard deviation (±SD). The results were considered significant when*P<0.05; and highly significant when**P<0.01 and***P<0.001.
of expression on both strains and for both antibiotics. Overall, EfpA was overexpressed in all strains independently of the antibiotic to which it was exposed. Contrary, Rv2459 was found overexpressed only in the ofloxacin monoresistant strain exposed to ofloxacin. For the remaining efflux pumps analyzed we could not associate an antibiotic to the overexpression of a particular efflux pump. We have observed a general pattern of efflux pump gene expression upon the exposure to the antibiotics.
M. tuberculosis
Growth Kinetics in the
Presence of Antibiotics and Efflux
Inhibitors
If efflux really contributes to the overall drug resistance level seen above, the delay in the growth of each drug resistant strain, due to the stress imposed by the combination of an antibiotic plus an efflux inhibitor at subinhibitory concentrations, will render them more susceptible to the effect of the antibiotic. To test this hypothesis, we performed qDST for selectedM. tuberculosis strains and investigated the TTD of growth in the presence and absence of the efflux inhibitors to attain clinical correlation (Machado et al., 2016).
The results showed a delay between the TTD of the tube containing the antibiotic plus an efflux inhibitor and the tube containing only the antibiotic ranging from 1 to 63 days depending on the antibiotic concentration and the drug combination (Supplementary Tables 2–4). Rifampicin at 1 µg/ml in combination with the efflux inhibitors showed
a delay in the TTD of strain MtbPT11 of 48 h in the presence of thioridazine, corresponding to a potentiation of rifampicin activity of 63.23% when compared with rifampicin only. Similarly, in the presence of verapamil or chlorpromazine, the delay was 72 h corresponding to a potentiation of rifampicin activity of 95.81 and 96.77%, respectively. Noteworthy, this
strain became susceptible to rifampicin at 20 µg/ml in
the presence of verapamil (Figure 4) and chlorpromazine, with a delay in the TTD of 386 and 195 h, respectively (Supplementary Table 2). In Figure 5 is presented the qDST of isoniazid for the same strain and it can be observed the increasing of the TTD at each concentration of isoniazid in the presence of half MIC of verapamil. These results showed that the antibiotic activity is clearly potentiated by the efflux inhibitors as demonstrated by the delay on the TTD of growth although, as seen previously, they do not reach susceptibility levels due to the antibiotic-target mutations they carry.
DISCUSSION
Whilst drug resistance inM. tuberculosishas long been associated with the development of mutations in the genes that code for the drug targets, efflux pump activity was only recently recognized to play a significant role in the development of drug resistant phenotypes in M. tuberculosis. Several recent studies have demonstrated the importance of the overexpression of efflux pump genes in MDR and XDRM. tuberculosis clinical strains (Calgin et al., 2013; Coelho et al., 2015; Li et al., 2015a; Yamchi et al., 2015; Kanji et al., 2016; Machado et al., 2016; Oh et al., 2017), in rifampicin monoresistant strains (Li et al., 2015b), or in the H37Rv susceptible strain after exposure to drugs (Garima et al., 2015; Caleffi-Ferracioli et al., 2016). Nevertheless, most of these studies are based on the simple assessment and evaluation of the levels of expression ofM. tuberculosisefflux pump genes, and few have determined the effect of efflux inhibitors on the MICs of the antituberculosis drugs and have quantified the activity of the overexpressed efflux systems. Therefore, further studies are needed to explore the contribution of the overactivity of efflux pumps to the resistance levels inM. tuberculosisstrains.
In a previous work, we presented a model on how multidrug resistance develops in tuberculosis patients, the role of efflux pumps on the development of isoniazid resistance once exposed to the critical concentration of this antituberculosis drug and how these events determine the basis of acquired multidrug resistance (Machado et al., 2012). From that work two questions were raised: (i) what is the role played by the efflux systems inM. tuberculosis strains that already carry mutations in the drug target genes? and (ii) do they respond in the same way to the drug pressure despite the presence of a mutation? In this work, we selected a panel ofM. tuberculosisstrains presenting different phenotypes and genotypes to study the relationship between the effects of efflux inhibitors on the levels of resistance of the main antituberculosis drugs, the overexpression of efflux pumps upon drug pressure, and the presence of active efflux systems. This study was designed and executed to provide a simple and comprehensive demonstration that drug resistance in M. tuberculosisis a combination between efflux and the presence of a mutation in the drug target gene, a controversial subject in debate for many years (Jarlier and Nikaido, 1994; Louw et al., 2009; da Silva et al., 2011, 2016; Machado et al., 2012; Schmalstieg et al., 2012; Viveiros et al., 2012).
FIGURE 3 | Quantification of the relative mRNA expression levels of a panel of efflux pump genes.Strains were grown in MGIT tubes for the MGIT 960 system in the presence of half MIC of each antibiotic as follows: MtbPT3 was exposed to isoniazid; MtbPT5 was exposed to rifampicin; MtbBR1 was exposed to ofloxacin; H37Rv, MtbPT7, and MtbPT11 were exposed to isoniazid or rifampicin. The relative expression of the efflux pump genes was assessed by comparison of the relative quantity of the respective mRNA in the presence of an antibiotic to the non-exposed strain. A level of relative expression equal to 1 indicates that the expression level was identical to the strain that was being compared (gray dashed line in the graphs). Genes showing expression levels above 1 were considered to be expressed; genes showing expression levels above two were considered to be significant overexpressed. The results were considered significant when *P<0.05; and highly significant when **P<0.01 and ***P<0.001.
First we analyzed the effect of verapamil, thioridazine and chlorpromazine, known inhibitors of M. tuberculosis efflux pumps, on the resistance levels of first- and second-line drugs against a panel of monoresistant, MDR and XDRM. tuberculosis strains. The results obtained demonstrated that the resistance levels of the M. tuberculosis clinical strains toward the first-and second-line antibiotics studied could be reduced by an efflux inhibitor, independently of the genotype of the strains, demonstrating that the efflux pump inhibitors could be useful in combination with the standard antituberculosis therapy. These results showed that the drug resistant level observed on these strains is a combination between the efflux activity and the mutation in a drug resistance target. With the concentrations of the efflux inhibitors that we tested (half MIC), we can only aim to reduce the efflux component but the resistance component due to the mutation remains untouched. It is not plausible that a compound, whose main function is the inhibition of efflux activity, could reverse the antibiotic resistance in the presence of a mutation associated with high-level resistance. Since all
these strains presented mutations associated with high-level drug resistance, these antibiotics are useless in these cases. Although the degree of synergism does not reach full susceptibility, the reduction of the MIC value of the antibiotics to values close or within the serum concentration can improve therapy outcomes demonstrating the possible usefulness of the efflux inhibitors as helper-compounds of antibiotic activity in tuberculosis treatment (Böttger, 2011; Machado et al., 2012; Viveiros et al., 2012; da Silva et al., 2016). Furthermore, it is described that the antibiotics can penetrate and concentrate within macrophages (Prokesch and Hand, 1982) increasing, by this manner, their effective concentrations.
Machado et al. Efflux Resistance Levels inM. tuberculosis
FIGURE 4 | Quantitative drug susceptibility testing of rifampicin for the strain MtbPT11, in the presence or absence of verapamil.Quantitative drug susceptibility testing of isoniazid was conducted using the BACTEC 960 system and the Epicenter V5.80A software equipped with the TB eXIST module. In the Figure is presented the result of the testing for the strain MtbPT11 at 20µg/ml of rifampicin alone (full orange curve) and rifampicin at
20µg/ml in the presence of verapamil at half MIC (dashed orange curve).
Verapamil alone does not inhibit the growth of the strain (gray curve). Absolute control is given by the dotted blue curve (undiluted strain 1:1) and the proportional control is given by the continuous blue curve (strain diluted 1:100). At the time of growth of the proportional growth control (GU=
400—black dashed line), the comparison between this tube and the tubes containing the drugs(s) was performed. If the GU of the tubes containing the drug were>100 (red dashed line), they were considered to be resistant to that concentration. If the GU of the tube containing the drug was<100 they were considered susceptible.
the efflux activity inM. tuberculosis. It has been hypothesized in several studies that these efflux inhibitors affectM. tuberculosis membrane energetics and that they inhibit efflux by inhibiting the energy required for the pumps function (Black et al., 2014; Pule et al., 2016; da Silva et al., 2016). Due to the paucity of new antituberculosis drugs in the tuberculosis drug discovery pipeline and the increasing of drug resistant tuberculosis there is an urgent need for the development of new drugs and the implementation of new therapeutic strategies. The use of compounds that have the ability to inhibit mycobacterial efflux pumps promoting the retention of the co-administered antibiotics that are subject to efflux will obviously improve the efficacy and will extend the clinical utility of the existing antibiotics. In this sense, in the last years, various compounds have been developed and described as putative efflux pump inhibitors, e.g., verapamil analogs were shown to be effective antituberculosis inhibitors being able to reduce the level of resistance to rifampicin by binding to the efflux pump Rv1258c (Singh et al., 2014); thioridazine derivatives have demonstrated to potentiate the antituberculosis drug activity againstM. tuberculosis in vitroandex vivo(Pieroni et al., 2015), and hybrid efflux pump inhibitors, combining the activities of verapamil and thioridazine, were also shown to possessin vitro
FIGURE 5 | Quantitative drug susceptibility testing of isoniazid for the strain MtbPT11, in the presence or absence of verapamil.Quantitative drug susceptibility testing of isoniazid was conducted using the BACTEC 960 system and the Epicenter V5.80A software equipped with the TB eXIST module. Absolute control is given by the dotted blue curve (undiluted strain 1:1) and the proportional control is given by the continuous blue curve (strain diluted 1:100). The orange, yellow, pink, and green full curves correspond to the growth curves of the strain in the presence of only isoniazid; the respective colored dashed curves corresponded to the growth curves of the strain in the presence of isoniazid and verapamil; Verapamil alone does not inhibit the growth of the strain (gray curve). At the time of growth of the proportional growth control (GU=400—black dashed line), the comparison between this tube and the tubes containing the drugs(s) was performed. If the GU of the tubes containing the drug were>100 (red dashed line), they were considered to be resistant to that concentration. If the GU of the tube containing the drug was<100 they were considered susceptible. Isoniazid was tested at 0.1, 1, 3, and 10µg/ml with and without half MIC of verapamil.
antituberculosis activity and intracellular activity in macrophages (Kumar et al., 2016).
Next, we analyzed the expression levels of five putative efflux pumps upon exposure to the antibiotics in the H37Rv susceptible strain, and in the monoresistant, MDR and XDRM. tuberculosis clinical isolates. The efflux pump genesmmr,mmpL7,Rv1258c, p55, and efpA were shown to be overexpressed in presence of antibiotics demonstrating the contribution of these efflux pumps to the resistance phenotype of the strains studied, with the exception of the H37Rv strain. We have noticed a general overexpression of almost all efflux genes studied upon exposure to the antibiotics in the drug resistant strains independently on the genotype of the strains. Indeed, when we look to the substrate specificity of each of theM. tuberculosisefflux pumps described in the literature we cannot find a correlation between a given substrate and a specific efflux pump (Supplementary Table 1). These results indicated thatM. tuberculosisefflux pumps are promiscuous in their activity as we cannot associate the extrusion of drugs to a specific gene. Moreover, the RT-qPCR data combined with the real-time fluorometry results showed that the drug resistant clinical strains are more prompt to respond, via an efflux-mediated response, to the antibiotics, whereas
the susceptible H37Rv strain shows a less prompt detoxifying response to the drugs to which it was exposed. Altogether, the results obtained demonstrate thatM. tuberculosisclinical strains are primed to efflux noxious compounds and showed that efflux pump induction is involved in the antibiotic resistance pattern of the strains in study, reinforcing the validity of the hypotheses that efflux contributes to the resistance level of these strains, contributing also to their MDR phenotype.
We also showed that the TTD ofM. tuberculosisgrowth in the MGIT 960 culture system in combination with qDST is a valuable methodology to evaluate M. tuberculosisdrug response and to characterize the potency of drug combinations for personalized treatment, especially for MDR/XDR-TB patient regimens. Since the TTD and the inoculum concentration are inversely correlated (Diacon et al., 2010; Bowness et al., 2015), this synergistic activity can be highly beneficial during tuberculosis therapy, either in drug susceptible or drug-resistant strains, allowing the antibiotic, combined with the host’s immune system, to tackle in the most effective way the infecting strain. This method allowed the monitoring, on a real-time basis, of bacterial growth/survival vs. growth inhibition by the comparison between the TTD of growth of a given strain in the presence and absence of an efflux inhibitor. The methodology used proved to be useful to study the contribution of the efflux mechanisms to M. tuberculosis drug resistance and simultaneously evaluate the efficacy of an efflux inhibitor to decrease the level of resistance of a strain to a given drug in the perspective of the development of new therapeutic strategies for susceptible and drug resistant tuberculosis, incorporating efflux inhibitors in the control and prevention of drug resistance during therapy.
In conclusion, this study allowed us to show that the main mechanisms associated with drug resistance in M. tuberculosis correlates mutations in target genes with increased efflux and that compounds that inhibit efflux activity can significantly reduce the phenotypic level of such resistance. The level of drug resistance inM. tuberculosisis a combination between the presence of a mutation in the drug target genes and a general stress response to the presence of noxious compounds that regulates the intracellular level of a drug. The data obtained in the presented study corroborated our previous findings (Machado et al., 2012; Coelho et al., 2015) now tested on a larger and diverse panel of M. tuberculosis clinical strains. The demonstration that the efflux activity modulates the levels of antibiotic resistance by complementing the resistance due to target-gene mutations, is a very relevant finding in the context of the ongoing discussion on the ability and clinical reliability of sole molecular based detection of the target-gene
mutations as the future routine DST for M. tuberculosis (Böttger, 2011; Domínguez et al., 2016; Pankhurst et al., 2016; Schön et al., 2016). The use of efflux inhibitors as adjuvants of the antituberculosis therapy may be a promise for the development of new and shorter therapeutic strategies as they may potentiate the activity of the current antituberculosis drugs shortening the recommended 6 month treatment for cure, they can increase the activity of drugs that are no longer used due to the emergence of resistance, and they may also be used to protect the activity and usefulness of the new antituberculosis drugs from the development of drug resistance.
AUTHOR CONTRIBUTIONS
DM and MV conceived and designed the study. DM, TC, JP, and CP performed the experiments. DM, TC, JP, IC, IP, RM, DR, AV, MR, PS, MV analyzed the data. IP, IC, and MV contributed with reagents/materials. DM and MV wrote the manuscript. All authors reviewed and approved the final version of the manuscript.
FUNDING
This work was partially supported by projects PTDC/BIA-MIC/121859/2010 and UID/Multi/04413/2013 from Fundação para a Ciência e a Tecnologia (FCT), Portugal, and project “Ciência sem Fronteiras/Professor Visitante Especial” (Ref. 88881.064961/2014-01) from CAPES/MEC/Brazil.
ACKNOWLEDGMENTS
DM and JP were supported by post-doctoral grants
SFRH/BPD/100688/2014 and SFRH/BPD/95406/2013,
respectively, from Fundação para a Ciência e a Tecnologia (FCT), Portugal. TC and DR were supported by doctoral and post-doctoral grants, respectively, from Coordenação de Aperfeiçoamento de Pessoal de Nível Superior/Ministério da Educação (CAPES/MEC), Brazil. PEA has a Research Productivity Fellowship of National Council for Scientific and Technological Development (CNPq)/MCT/Brazil.
SUPPLEMENTARY MATERIAL
The Supplementary Material for this article can be found online at: http://journal.frontiersin.org/article/10.3389/fmicb. 2017.00711/full#supplementary-material
REFERENCES
Adams, K., Szumowski, J., and Ramakrishnan, L. (2014). Verapamil, and its metabolite norverapamil, inhibit macrophage-induced, bacterial efflux pump-mediated to multiple anti-tubercular drugs. J. Infect. Dis. 210, 456–466. doi: 10.1093/infdis/ jiu095
Adams, K., Takaki, K., Connolly, L., Wiedenhoft, H., Winglee, K., Humbert, O., et al. (2011). Drug tolerance in replicating mycobacteria mediated by a macrophage-induced efflux mechanism. Cell 145, 39–53. doi: 10.1016/j.cell.2011.02.022