i
k
ORGANIZATIONAL
CULTURE
INFLUENCE
ON
INFORMATION
QUALITY
-
USE
BUSINESS
INTELLIGENCE
SYSTEMS
RELATIONSHIP
Raquel Antas Gonçalves Onofre Capelo
Dissertation report presented as partial requirement for
the degree of Master in Statistics and Information
Management,
Specialization
in
Management
of
iii
School of Statistics and Information Management Universidade Nova de Lisboa
ORGANIZATIONAL CULTURE INFLUENCE ON INFORMATION
QUALITY - USE OF BUSINESS INTELLIGENCE SYSTEMS
RELATIONSHIP
PORTUGUESE CONTEXT
by
Raquel Antas Gonçalves Onofre Capelo
Dissertation report presented as partial requirement for the degree of Master in Statistics and Information Management, Specialization in Management of Information Systems and Technologies
Dissertation Supervisor: AlešPopovič, PhD
v
ACKNOWLEDGEMENTS
Over this period of intensive labor, I would like to acknowledge some people that in different ways have smoothed my work.
I am particularly grateful to my supervisor, Professor AlešPopovič, for sharing his knowledge and keeping sharp criticism most useful for my work and also for providing me fast feedbacks over my work.
I thank to ISEGI, particularly to Virgínia Júdice, Dra. Olívia Fernandes, Dra. Ângela Santos, Dra. Antónia Correia, Dra. Gisela Garcia, Dr. Paulo Catarino, in behalf of IS department, Dr. Pedro Bernardino for all the logistical support and kindness that they always provide me.
I am deeply grateful to my former Director, Eng. Rui Almeida for his wise advises and for always promoting the development of my professional skills, stimulating my great will to further explore management of information systems and technologies under my professional tasks.
I am deeply grateful to João Perpétua, not only for being a good friend, but for discussing important issues related to my master and my work, providing always all necessary IT support and helping me with critical tasks.
I am also very grateful to Eng. José Sousa Uva, my coordinator, for the professional opportunities he offered me, that have been taken me further, and for his flexibility towards my needs of being absent.
To Raquel Lobo do Vale, a dear old friend who lost some hours providing me some critical overview over my work, I deeply thank.
To all my family I thank the comfort and the ability of making me laugh in most unlikely situations, particularly to my parents, for their wisdom and respect.
vii
ABSTRACT
Business intelligence systems offer managerial advantage in a business environment that rapidly evolves, however the accomplishment of its unique capacities and the delivery of overall efficiency much relies on its use. The use of business intelligence systems is closely related to information quality, in a sense that
information should meet end user’s needs, providing trust, fast access and reliability.
In an attempt to fulfill a research need, it is provided a framework to analyze organizational culture in a sample of medium to large organizations operating in Portugal, and tested potential linkages with individual culture types (e.g. clan, adhocracy, market and hierarchy), and use of business intelligence, trough information quality.
KEYWORDS
INDEX
1. Introduction ... 1
1.1.Information systems shaping business ... 1
1.1.1.The IS Adoption Process ... 1
1.1.2.Is Use of IS guaranteed? ... 4
1.1.3.Organizational culture: the missing link ... 6
1.2.Description of working problem and research general question ... 8
1.3.Research objectives ... 8
1.4.Added value of this research ... 9
2. Literature review ... 10
2.1.Users and IS ... 10
2.2.The importance of BIS for organizations ... 13
2.3.Organization culture ... 16
2.3.1.Origin and concepts ... 16
2.3.2.The importance of organization culture ... 18
2.3.3.Dimensions of organizational culture ... 19
2.3.4.Culture changes and organizational impacts ... 21
3. Methodology ... 23
3.1.Data Collection ... 23
3.2.Data analysis ... 23
4. Results and discussion ... 26
4.1.Descriptive statistics and stepwise regression ... 26
4.1.1.Descriptive Statistics Results for Organizational Culture ... 26
4.1.2.Stepwise regression analysis... 29
4.1.3.Discussion of the results ... 32
4.2.OCAI analysis to medium and large organizations operating in Portugal ... 33
4.2.1.Dominant culture ... 34
4.2.2.Dominant Characteristics ... 34
4.2.3.Organizational leadership ... 36
4.2.4.Management of employees ... 37
4.2.5.Organizational Glue ... 38
ix
4.2.7.Criteria of Success ... 40
4.3.Interpretation of OCAI Results ... 41
5. Conclusions ... 43
6. Limitations and recomendations for future research ... 45
INDEX OF FIGURES
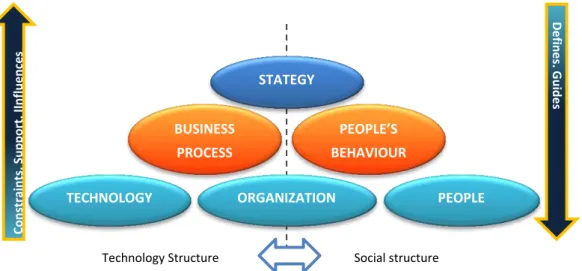
Figure 1 - Integrated framework of organizational performance, adapted from Cabrera,
Cabrera & Barajas (2001) ... 8
Figure 2 - Updated DeLone and McLean IS success model, adapted from DeLone, & McLean (2008) ... 11
Figure 3 - Organization characteristics that impact on IQ ... 12
Figure 4 - BIS Users by their reporting needs, adapted from Ballard, Farrell, Gupta, Mazuela, & Vohnik (2006) ... 15
Figure 5 - Three Levels of Culture, according to Alavi, Kayworth, & Leidner (2005) ... 17
Figure 6 - Organizational culture framework, adapted from Cameron and Quinn (2006) ... 20
Figure 7 – Dominant culture ... 34
Figure 8 – Dominant Characteristics ... 35
Figure 9 – Organizational leadership ... 36
Figure 10 - Management of employees ... 37
Figure 11- Organizational glue ... 38
Figure 12 - Strategic emphasis ... 39
xi
INDEX OF TABLES
Table 1 - Results for dominant characteristics ... 27
Table 2 - Results for organizational leadership ... 28
Table 3 - Results for management of employees ... 28
Table 4 - Results for organizational glue ... 28
Table 5 - Results for strategic emphasis ... 29
Table 6 - Results of criteria of success ... 29
Table 7 - Summary of the regression models ... 32
Table 8 - Percentage of responses by sector of activity ... 33
ACRONYMS
BI - Business intelligence
BIS - Business intelligence system
DM - Data mart
DW - Data warehouse
IQ - Information quality
IS - Information Systems
IT - Information Technologies
KM - Knowledge management
OC - Organizational culture
1
1.
INTRODUCTION
1.1. Information systems shaping business
Information systems (IS) are nowadays widely present in organizations, as the need of understanding the own business and the external environment, at reasonable costs, rises. The information era promoted cheap data storage which triggered a very fast and broad development of IS in business. Information was never been so accessible, yet technological investments had to be made in order to take the best advantage of this information. Top executives became directly involved on new technologies management, as they understood the power of good use of information for competitive advantage (Porter & Millar, 1985). Managerial decisions, once heavily supported on intuition and experience, became to benefit from IS with strong analytical capabilities, that provided a whole business scenario at real time (Turban, Sharda, & Delen, 2011), particularly business intelligence systems (BIS) (Popovič, Turk,
& Jaklič, 2010). In fact, this IS large-scale adoption lead to a total remake of how business is done, from public services to enterprises including media. In fact, Watson (2012, p. 444) argues that “organisations, both public and private, have changed almost beyond recognition since 1970. Whilst mainframe computers were used in 1970 to do much of the routine transaction processing, most office work was still done manually and paper-based files and typewriters were still the mainstay of office work. In 2010 personal computers sit on every desk, almost everybody has a mobile phone, and these and other electronic gadgets and communications networks have transformed business, government and people’s private lives”. Moreover, business offices are scattered due to the increase of smartphones use and its increasing powerful applications, delivering the promise of being at office everywhere.
1.1.1. The IS Adoption Process
Information technology (IT)-based innovation is a large concept that umbrellas initiation, assembling and analyzing information on technological innovation, adoption, where decisions are made over innovation adoption and implementation, which refers to implementing technological innovation in the business (Thong, 1999).
different channels, behavioral, considering human behavior and its impacts on both individual and organizations, and economic, focusing on competitive advantages on decision-making. Moreover, IT adoption has been defined as the capability to integrate information of its business processes through technologies, and deliver it for effective decision-making (Li, Yang, Sun, & Sohal, 2009).
“The process by which a firm adopts and implements technological innovations is influenced by the technological context, the organizational context, and the environmental context. The technological context includes the internal and external technologies that are relevant to the firm. Technologies may include both equipment as well as processes. The organizational context refers to the characteristics and resources of the firm, including the firm’s size, degree of centralization, degree of formalization, managerial structure, human resources, amount of slack resources, and linkages among employees. The environmental context includes the size and structure of the industry, the firm’s competitors, the macroeconomic context, and the
regulatory environment.” (Tornatzky, Fleischer, & Chakrabarti, 1990, p. 152).
IS implementation by organizations is not a linear process. Important considerations must be thoroughly analyzed to achieve desired effectiveness:
Organizations must decide upon its intrinsic characteristics if the best solution is providing a new IS or upgrading an old IS, with integration issues to solve (time consuming, thus highly expensive). Scalability might be an interesting feature to think over, postponing legacy systems problems. Moreover, there are technological issues to take care, such as software compatibility, data sources, network capabilities, security features, data protection, performance, particularly important when IS umbrella heavy analytical processing. Popovič, Hackney, Coelho and Jaklič (2012, p. 730) asserts that “A lower understanding of business processes, supporting IS, legacy systems, and even hardware infrastructure will be reflected in lower BIS maturity, information quality and,
consequently, information use”.
3 Organizational alignment between business and IT strategies in what regards IS is crucial to achive maximum value out of it (Henderson & Venkatraman, 1993).
Communication among parts, organization and development team, must assure that IS requirements meet the organization objectives. This means that organizations should know exactly what they need and IT developers must be able to translate that to development of the IS, targeting business-IT alignment. Frequent adjustments to initial plan may be translated into disastrous result. Agile methodologies, use a close communication approach while developing, creating iterative visible prototypes, to ensure that the final product is the best suit - Dynamic Systems Development Method (Stapleton, 1997). In the case of analytical IS, as BIS, the level of complexity is much higher than in transactional IS. A vast range of less structured decisions and end-users groups must be taken into account. A thorough requirement analysis has been pointed out as a critical phase to achieve IS effectiveness (Stroh, Winter, & Wortmann, 2011). Moreover, IS professionals frequently do not adopt a proper methodology to determine executive information needs (March & Hevner, 2007).
Organizations must be aware that IS implementation allow reorganizing business processes, thus should be prepared to review business process models
that better achieve organization’s goals (cost reduction, time saving). Moreover, Henderson and Venkatraman (1993) state that “innovative IT systems generally offer great opportunities to improve a company’s competitiveness”.
IS development must be oriented to end-users usage, meaning that it’s extremely important that IS provides accessible, accurate and current information to earn end-users trust and commitment (Eppler, 2006).
proof its value and worth-investment, so it it’s advisable that managers identify target areas to see results (Glaser & Stone, 2008).
Successful implementation of IS in organizations involve innovation acceptance and integration both by organization and users, as its continuous use in time (Gopalakrishnan & Damanpour, 1997). Achieving and maintaining business-IT alignment is an ongoing process, demanding to both business and IT professionals a commitment to adaptation to changes (Wong, Ngan, Chan, & Chong, 2012). Human dimension must be accounted for an organization achieves its performance targets. Several researchers (Cabrera, Cabrera, & Barajas, 2001; Davis, 1989) agree on the fact that IS projects frequently fail because human and organizational components are disregarded, factors recognized as critical for effectiveness of the new systems. IT projects are commonly driven under technological perspective and reveal being high sensitive to costs. There is a reported lack of understanding in business managers over linkages between technical and organization issues, thus over new technologies and strategic business goals. Harrington and Guimaraes (2005, p. 58) conclude that
“Managerial IT knowledge, coupled with a strong external and internal communication channel, should aid the implementation of IT innovations, resulting in better payback, user satisfaction, reliability and competitive advantage”. IT implementation success calls for a highlight on organizational change, where people and technical factors are connected and interdependent. As a result, top managers must promote long-term strategic change and project managers should manage this change, accounting the impact of technological innovation into working teams organization and jobs design (Cabrera, et al., 2001).
1.1.2. Is Use of IS guaranteed?
5
Although IS supplies the potential for improving business goals, users often oppose to accept and use this systems, dooming all expectations (Powell & Dent-Micallef, 1997; Sharda, Barr, & McDonnell, 1988; Venkatesh, 1999). This fact has been attracting the attention of researchers that have been studying user’s behavior towards technology. Davis (1989) propose the technology acceptance model (TAM), the most widely use model of technology acceptance, to explain how users accept and use technology. Critical factors affecting usage are perceived usefulness and perceived ease-of-use, reinforcing the role of behavioral science to IT research.
While IS use depends much upon user satisfaction, McGill, Hobbs, Chan and Khoo (1998) express that end-user applications utility for decision-making is powered by outputs that meet the user’s information needs. Moreover, user satisfaction leads to usage rather than usage stimulating satisfaction. Thus, user satisfaction is presented as a critical factor for IS use and consequently success.
Wixom and Todd (2005) research has proven that combining previous research streams on user satisfaction and technology acceptance in a unified model provides more information on linkages between design and implementation, arguments supporting user satisfaction theories, and prediction of usage, the target of technological acceptance models.
transfer acquired knowledge into organization’s innovation process (Chiaroni, Chiesa, & Frattini, 2011).
BIS should target IQ that makes information useful for users across different user-groups, in order to reinforce BIS usage. English (2009) proposes the term of knowledge workers instead of users, arguing that people who bring up value to BIS are not merely users, they input their knowledge across the system in order to increment its value.
While implementing BIS, it is not unusual for BIS users to create high expectations that never are fulfilled and often disappointed by performing hard-working tasks on assuring data quality (Glaser & Stone, 2008). Effective communication while developing might mitigate this undesired effect. Chuah and Wong (2011) refer that technological, organizational, cultural and infrastructural issues drive the majority of BIS to failure. Moreover, they emphasize inaccessible tools for end-users or deviations on meeting end-users needs effectively.
The most cited factor affecting IS end-user satisfaction in literature are perceived benefits and convenience, user background and involvement and organizational attitude and support (Mahmood, Burn, Gemoets, & Jacquez, 2000). Dasgupta and Gupta (2012), state that organizations should evaluate the determinant role of organizational culture and assess its impact on IT planning. Baron, Patterson and Harris (2006) propose an extension of technology acceptance model by applying a more interpretative approach over cultural context in which occur acceptance experiences.
1.1.3. Organizational culture: the missing link
According to Schein (2004, p. 1) culture is a dynamic process, resulting from the interaction among others and promoted by leadership behaviors. Culture encompasses
“a set of structures, routines, rules, and norms that guide and constrain behavior”. Claver (2001, p. 248) proposes a definition of culture as “a set of values, symbols and rituals, shared by the members of a specific firm, which describes the way things are done in an organization in order to solve both internal management problems and
7
Studying organizational culture dates back from 1980s and its impact on organizations competitiveness and survival in a growing fierce competitive global market where previously disregard.
Figure 1 - Integrated framework of organizational performance, adapted from Cabrera, Cabrera and Barajas (2001)
1.2.Description of working problem and research general question
Literature suggests a need of specific research on interdependencies between use of BIS and organizational culture. This research purpose is to assess how does specific prevailing culture styles defined by Cameron and Quinn (2006) namely Clan, Adhocracy, Market and Hierarchy Cultures affect BIS use. This research aims to bring some insight over these dependencies, using a methodology that has been largely tested by practitioners and researchers.
1.3.Research objectives
This research objective is to provide a scenario over implications that organization culture might have in the use of BIS in a Portuguese business context. Once use of IS is highly related to IQ (L. P. English, 2009; Vlahos, et al., 2004), the question if culture types affect the relationship IQ – use of BIS, will be addressed.
The purpose of offering a profile on organizational culture among medium to large organizations operating in Portugal is also an objective of this research.
PEOPLE’S BEHAVIOUR BUSINESS
PROCESS
TECHNOLOGY PEOPLE
9
1.4.Added value of this research
2.
LITERATURE REVIEW
2.1.Users and IS
Although passing through an economic climate of insecurity and uncertainty, investments on IT have been globally growing, in spite of the pressures to cut costs. Organizations have to measure and evaluate the benefits and costs of technology in order to assess its continuous investments. As the impacts of IT are often indirect and influenced by human, organizational, and environmental factors, the measurement of IS success is complex given its multidimensional nature (Petter, et al., 2008).
DeLone and McLean Model (1992) propose a model as frameworks for conceptualizing and operationalizing IS success that has been vastly used and tested by several researchers. This model, known as D&M IS Success Model it’s based on Shannon and Weaver’s over their theory of communication (1949) and Mason following findings (1978), identifying three levels of information measurements, considered interdependent, and its effects:
i) Technical level, which refers to accuracy and efficiency of information production system, measured by system quality;
ii) Semantic level, which refers to how successful is information conducted across IS according to its meaning, measured by IQ;
iii) Effectiveness level, measuring information effect on its receptor/user, measured by use, user satisfaction , individual impacts and organizational impacts
a) Information reception and evaluation. b) Information effect on receptor/user.
c) Inputs from receptor/user on IS, directly caused by information received.
11
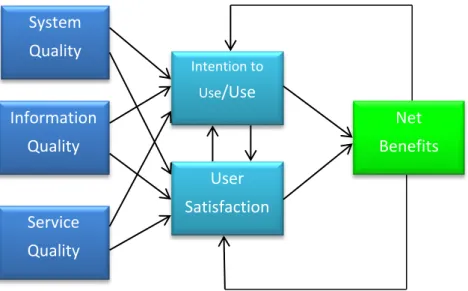
unlike impact, which might be positive, negative or neutral. The IS Success model is presented on Figure 2.
Delone and McLean (2003) researches have proven that IQ is strongly associated with system use and net benefits. Teo and Wong (1998), revisiting D&M IS success model, conclude that IQ appears to be significantly related to managerial satisfaction, improvement in work environments and organizational impact.
Delone and McLean (2003) advert for careful attention when defining each dimension of the dependent variable (IS Success) and its measurements, given the complex nature of the multidimensional, and interdependent nature of IS success, that should be interpreted in conformity with the research scope. Petter, et al (2008) reviewed DeLone and McLean IS Success Model, analyzing different types of IS, concluded that the model was equally successfully applicable to both individual and organization level of analysis. They confirm a reasonable support from the model, suggesting D&M model of IS Success value on utilitarian IS. The research didn´t focus on IS design for leisure, like gaming or social networking.
Use, user satisfaction and intention to use are therefore key determinants to IS success. Researchers frequently link factors and processes behind IT investments and the accomplishment of their economic value to user perceptions about IT and how it impacts their work (Torkzadeh & Doll, 1999; Wixom & Todd, 2005).
Figure 2 - Updated DeLone and McLean IS success model, adapted from DeLone, & McLean (2008)
System Quality
Information Quality
Service Quality
Intention to Use/Use
User Satisfaction
“After years of significant investment in putting in place a technological platform that supports business processes and strengthens the efficiency of operational structure, most organizations have reached a point where the use of tools to support the decision making process at the strategic level emerges as more important than ever”(Petrini & Pozzebon, 2009, p. 178).
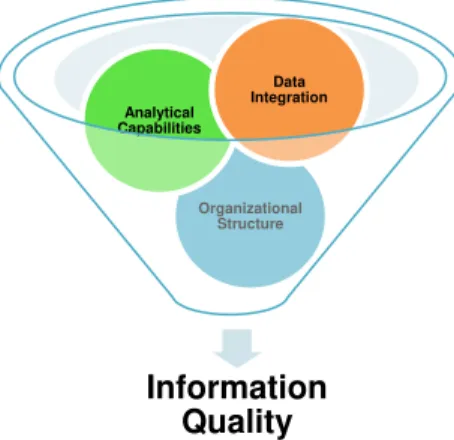
Eppler (2006) states that IQ is an ambiguous concept, much supported by the use of the information. Nevertheless, the usefulness of that information for a specific purpose involving decision making arises as a sensible and critical issue inside organizations. This usefulness is related to data quality, given its content, format, cost and time characteristics (Eppler, 2006) and purpose (Chengalur-Smith, Ballou, & Prazer, 1999). Popovič, Coelho and Jaklič (2009) state that BIS can provide better IQ, by increasing its accessibility, simplifying querying and analysis, offering a higher level of interactivity, improving data consistency by assuring data integration processes and by enabling focused management activities. Both technological and business processes affect IQ; analytical capabilities, data integration and organizational structure combined together influence the quality of information. Wixom and Todd (2005)
highlighted the need of integrating information technologies and its user’s behavior.
The trust decision makers have on the information they use is determinant for a business intelligence system proper usage. This understanding is illustrated on Figure 3, as it can be seen the crucial organization characteristics that impact on IQ.
Figure 3 - Organization characteristics that impact on IQ
IQ is considered a major dimension for evaluating IS success (DeLone & McLean, 2003). Several researchers interested in different fields of knowledge have discussed
Information Quality
Organizational Structure Analytical Capabilities
13
consensus on the criteria used to describe information products value (Eppler, Helfert, & Gasser, 2004).
2.2.The importance of BIS for organizations
According to Watson (2009, p. 23) , “Business intelligence (BI) can be defined as a broad category of applications, technologies, and processes for gathering, storing, accessing, and analyzing data to help business users make better decisions. Organizations use BI in a variety of ways – as a single or a few related applications, an enterprise-wide adaptability, or an enabler of organizational transformation to support a new business model.” Human resources are as important as information resources to achieve organization effectiveness. In fact, information is not valuable intrinsically, but in the measure that meets knowledge workers quality requirements. IQ is a premise for a proper use of BI (L. English, 2005).
BIS state their importance on rapidly changing business environment, supported on web resources and technologies also on a fast speed evolution. Under these conditions, organizations are pressured to adapt to changes and challenged to undertake innovative ways of doing business (Lonnqvist & Pirttimaki, 2006; Turban, et al., 2011). Strategic, tactical and operational decisions must be quick, independently of the complexity involved, which must be supported by a considerable amount of relevant information, turning organizations more fit to face challenges and opportunities. BIS are nowadays powerful tools to achieve added value in products and services in the market. BIS collect and process data, thus offering quality information, enabling end-user’s ability to make good decisions (Michalewicz, Schmidt, Michalewicz, & Michalewicz, 2007), being quite fit on achieving information asymmetry. As Rud (2009, p. 25) states, business intelligence encompasses all
components that allow “getting the right information to the right people at the right time through the right channel”.
BIS is a particular IS and stands out from traditional decision support systems as they encompass a broader technology components, namely knowledge management, data mining, among others. In its architecture, BIS are composed of two main parts: a) Data warehousing (DW) and b) data analysis, data access, reporting and delivery
(Popovič, et al., 2010). Data integration in data warehouse, combining consistent information from scattered sources, provides to BIS an advantage of being application oriented, embedding business strategies. Inmon (1996) emphasises the symbiotic relationship between DW and data mining. The goal of having one version of the truth is acquired through a good DW development. DW allows effective analytics, like analytical functions used in forecasting, organizing, managing, training and controlling-evaluating solution management problems (Ratiu-Suciu, 2009). DW offers integrated data, detailed and summarized data, historical data and metadata, the fundamental basis for keeping track of relevant data, time-efficient on using proper data for each analysis path, enabling trend analysis over time and always assuring the proper context of data. Kimball and Ross (2002) state that DW not only organize business needs as provides benefits for the overall organization, allowing a better control of scarce resources and obtain gain efficiencies through the use of reusable components.
BIS are particular IS that enclose technology, business and people in an interdependent way. Typical components of BIS (Glaser & Stone, 2008) are:
Infrastructure: The organization's servers, operating systems, workstations, and networks;
Data acquisition: The core transaction systems that are the sources of data used by BI analyses software;
Data integration: The software used to extract data from source systems, clean the data, and link data from different sources;
Data aggregation and storage: The repository of data that results from the data integration process, which can store both detailed data and metadata, subject-oriented according to business processes and needs;
Data analyses: The analytic software used to query the repository, manipulating, mining, and analysing the data in the data warehouse in order to create information and knowledge and run reports, and conduct data
15 Portal or User Interface: The interface used by managers and IT analysts to
interact with information they need.
BIS were first used as tools to support strategic decision-making. Nowadays, organizations further exploit BIS capabilities to support tactical and operational process improvements, supply chain, production and customer service.
Trustworthiness and expertise arise as relevant factors for a user’s credibility decision,
mainly over a knowledge source that supports decision (Elbashir, Collier, & Davern, 2008).
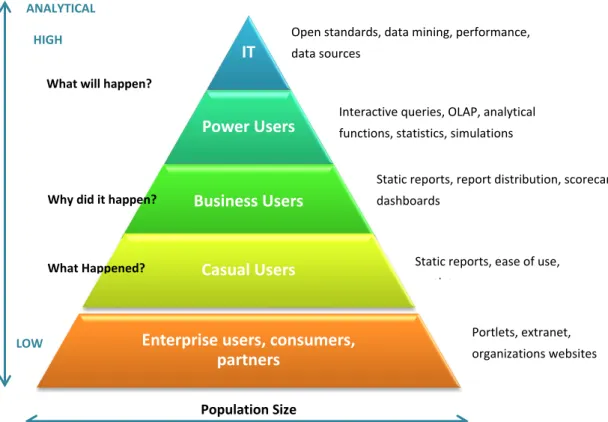
Given the ratio on Figure 4, organizations should endeavor an extra effort on making BIS a success for its different users. This might require perceiving the organization’s prevailing culture and to undertake processes of change that might arise as necessary.
Figure 4 - BIS Users by their reporting needs, adapted from Ballard, Farrell, Gupta, Mazuela, & Vohnik (2006)
IT
Power Users
Business Users
Casual Users
Enterprise users, consumers, partners
LOW
HIGH Open standards, data mining, performance,
data sources
Population Size
Interactive queries, OLAP, analytical functions, statistics, simulations
Static reports, report distribution, scorecards, dashboards
Static reports, ease of use, portlets
Portlets, extranet, organizations websites What Happened?
2.3.Organization culture
Powell and Dent-Micallef (1997) emphasize that innovations impacting organization characteristics, both formal, structure and informal, organizational culture, have the most strong effect on resistance to adoption, as managers recognize them as survival risks, avoiding IT developments in open cultures.
Hansen and Wernerfelt (1989), studying firm performance, merging economic data and behavioral data, conclude that human resource factors explain better performance variance obtained than strategic and economic data. Ginsberg and Venkatraman (1992) stated that behavioral responses to an implementation that radically changes organizations can be a blockage, even when there’s managerial evidence of the need to change. These findings suggest that there is empirical data supporting cultural aspects of an organization that need to be known, analyzed and action taken.
2.3.1. Origin and concepts
Organizational culture is a recent concept, being explicitly used only in the last few decades (Schein, 1990). Although there are many definitions in the literature, organizational culture can be defined as “a pattern of shared basic assumptions that the group learned as it solved its problems of external adaption and internal integration, that has worked well enough to be considered valid, and, therefore, to be taught to new members as the correct way to perceive, think and feel in relation to
those problems”(Ruzevicius & Gedminaite, 2007; Schein, 2004).
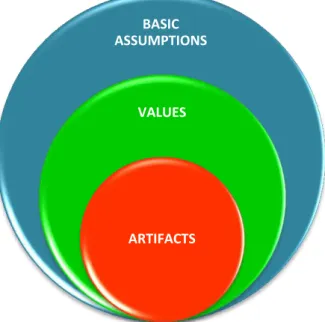
Schein (2004) decomposes culture at three levels, represented on Figure 5:
1) Basic assumptions, which refer to interpretative personal schemes used for perceiving situations, creating the basis for collective action. They develop over time while members of a group create strategies to face problems and pass them along to incoming members. A certain culture exists when groups share similar interpretative schemes, independently of group size.
2) Values embody a more perceptible manifestation of culture and imply
17
cultural group. These values allow organizational members to interpret signals, events and issues that guide behaviour.
3) Artifacts are considered the most visible manifestation of culture and umbrella concepts such as art, technology, myths, rituals and language. Its use can either reinforce existing values, or reshape them over time, impacting also basic assumptions.
Therefore, organizational culture is represented as dynamic process of interaction among basic assumptions, values, and artifacts (Alavi, et al., 2005; Schein, 1996).
Farris, Senner and Butterfi.Da (1973) emphasizes the role of trust in organization interpersonal relationships. Their findings show a linkage between trust and organizational culture and organization workers commitment to their work and integration into their work groups and organizations.
Organization culture is a complex matter, built upon dynamic social processes.
“Cultures are challenged, ever-changing and emergent; they are invented and reinvented in social life. IS researchers need to consider the ways in which people within organizations create and recreate meaning through the use of information technology” (Avison & Myers, 1995, p. 52). Schein (2004) argues that organizations
BASIC ASSUMPTIONS
VALUES
ARTIFACTS
should have a deeper understanding of organizational culture, so they can better know how to manage and improve them.
2.3.2. The importance of organization culture
In a rapidly changing business environment, were uncertainties are considerable, organizational culture has lately been described as a determinant factor of success though not traditionally recognized as one. Several examples of success point out organizational culture as the key to prosperity (Cabrera, et al., 2001; Claver, et al., 2001; Detert, et al., 2000; Jackson, 2011). Hofstede (1986) emphasizes as fundamental for managers getting an insight into the organizational culture and perceive how it contributes to organization control: leading it to meet its goals and foresee consequences if no action is taken.
Organizational culture role in an organization comprise its functions, namely internal integration, which refers to the feeling of belonging and commitment, and coordination, concerning the creation of a competitive ground and development of social glue that holds organization together, and, its impact on organization’s processes. Furthermore, organizational cultures influence how creativity and innovation are stimulated in an organization (Martins & Terblanche, 2003).
Avison and Myers (1995) suggest that IS research can benefit from a more current approach on organizational culture, allowing to foresee linkages between new information technologies, particularly adoption and use of IT, and organizational cultures.
19
Jackson (2011, p. 58) emphasizes that “culture is becoming increasingly important given the adoption of groupware applications, enterprise resource planning systems and other internet based systems by organizations, which support cross collaboration and require greater user participation at all levels”.
Being organizational culture such a complex matter that comprises so many different factors, it is useful to have a framework that uses the most important dimensions to focus on, tough the loss of detailed information.
2.3.3. Dimensions of organizational culture
Cameron and Quinn (2006) developed an organizational culture assessment instrument (OCAI) to diagnose organizational culture. It is supported on four culture styles, adhocracy, market, hierarchy and clan, being the core values which evaluations on organizations are made, and in 2 x 2 competing values, Flexibility and discretion opposing Stability and control and internal focus and integration versus external focus and differentiation, illustrated on Figure 6. Jones, Cline and Ryan (2006) stated that internal versus external focus separates the organizational improvements driven by mostly internal business processes and people caring from the ones caused by external stakeholders wishes. Stability versus flexibility distinguishes between organizations that are more stable and organizations that promote innovation, personal growth, continuous organization improvement and change.
Figure 6 - Organizational culture framework, adapted from Cameron and Quinn (2006b)
The culture styles define major characteristics and core values of an organization or parts of an organization in a given moment of time.
Adhocracy style is characterized by innovative approaches to do business or to design new products, where teams are encouraged to bring up new ideas and organized according to each innovative axe undertaken by the organization, involving risk taking. Success is to offer new, innovative products or services and stand out as leader.
Market style is an analogy of the organization itself as the market; it is focused on results, where people are goal-oriented in an atmosphere of competition. Winning is key-word across organization. Success means market share and penetration.
Hierarchy style lays on strict rules and procedures, achieving smooth operations in a very controlled environment. Managers are good organizers and keep processes running by the organization standards. Employees are managed upon the premise of secure employment and predictability.
Clan style focuses strongly on human resources, which are considered an important asset of the organization. Team-building, mentoring and commitment are important drivers. Tradition and loyalty are implicit values. Success is measured in terms of sensitivity to customers and concern for people.
21
practitioners and researchers. The OCAI questionnaire design allows diagnosing an organization culture, or groups of organizations, as well as the determination of prevailing culture upon different dimensions.
2.3.4. Culture changes and organizational impacts
Detert (2000) asserts that there is a lack of useful information on organization culture dimensions and how these dimensions relate to change programs and organizational improvements.
Shan and Yeoh (2009) conclude that managers, when selecting a particular IS, should promote a proper culture aligned with the characteristics of the implemented IS.
Leadership has been recognized has having a relevant role on organizational culture. Alavi et al. (2005) conclude that KM leaders should focus on valuing expertise and collaboration. They demonstrate that KM leadership has a greater impact on KM use than a system of bonuses and incentives that rewards potential users.
Eng Huang Chua, Lim, Soh, and Kien Sia (2012, p. 596) studying how clan control can be enacted in a complex IT projects, conclude that clan control requires both the building up and control of the clan to succeed. Moreover, “controllers play an instrumental role in employing significant resources and authority to influence the building and leveraging of the clan”. These leaders (“controllers”) access a large amount of resources that are used to guide others for project outcomes, but also promote the build-up of shared structures, cognition, and relationships that smooth the development of clan control that strengthen or inhibit clan norms.
necessarily implies a communicative relation between the transmitter and the receiver, the informer and the informed”.
Claver, et al. (2001) state that IQ and quantity, IS supported by a good data system are key factors for a culture embrace IS supported by a good data system initiatives and usage. They propose a progressive implementation with pilot-use, which spreads to all organization over time, giving the time to culture to grow and absorb IS. Regarding BIS implementation, Glaser and Stone (2008) share this approach.
Alavi et al. (2005) studying knowledge management tools for collaborative work and organizational culture, suggests the need to develop a proper social context to achieve positive KM behaviors. Brown, Dennis, and Venkatesh (2010) studying knowledge management tools for collaborative work and organizational culture, suggests that collaborative technology enables users to adopt and use the technology. Some authors like Rud (2009), suggest that collaborative leadership teams are essential for commitment to strategic use of information, at different organizational levels, in order to reinforce knowledge process.
23
3.
METHODOLOGY
3.1.Data Collection
A structured questionnaire was designed, which content was validated by two academics interested in the theme. The structured questionnaire has seven-point Likert scales for the IQ items and a combination of point Likert scales and seven-point semantic differentials for those items measuring BIS. A scale with more than five-points presents generally stronger convergent and discriminant validity and greater explanatory power, when compared to five-point scale (Coelho & Esteves, 2007).
The target is final users of BIS. A presentation letter accompanied the request for answering the questionnaire, explaining what is under study and assuring confidentiality. Questionnaires were submitted first by postal address then by web address to 2915 medium and large scale organizations operating in Portugal, from April to May 2012. Follow up involved resending the questionnaire to non-responders, which are internally identified by a unique code. 127 organizations have replied to the questionnaire with 146 responses, thus a response rate of 4,35% of organizations responding. Although the low rate of responds, data analysis can still be performed and information can be produced concerning the universe under account. Quantitative analyze by sectors of activity won’t be performed once low level of responses could lead to bias effect.
3.2.Data analysis
In order to analyze data, both qualitative and quantitative analysis were performed.
To assess organizational culture, OCAI was used, with Microsoft EXCEL support. This methodology comprehends both qualitative and quantitative analysis.
To study potential relationships between the use of BIS and IQ under a particular prevailing culture style, descriptive statistics were performed using SPSS. A multiple linear regression model was set up to analyze the relative contributions of IQ on the use of BIS, the dependent variable, under a particular prevailing culture style.
To perform this analysis, and considering use of BIS the dependent variable, it was used a mean of variables AIII1-AIII3, that represent use of BIS in the survey, assessing intentionality to use BIS, being the constructs equivalent, once regression only supports a unique dependent variable. The methodology used provided different models according to prevailing cultural styles.
A stepwise regression procedure was carried out in order to identify as few variables as possible in well predicting the BIS use. In this case, those variables that made it to the model would be considered to be the critical IQ dimensions, as they alone could account for the outcome of the dependent variable.
Regarding the Adhocracy style as prevailing culture, the number of observations was smaller than the independent variables (IQ), so the stepwise regression analysis
was only performed among the variables with significant Pearson’s correlation
coefficients (p<0,05). Statistical analysis was carried out with SPSS 19 (SPSS Corp., Chicago, IL, USA) and SigmaPlot 11.0 (Systat Software Inc., California, USA). The normality of the dependent variable and homoscedasticity were checked to meet the assumptions of multiple linear regressions. All statistical relationships were considered significant at p<0.05.
According to Johnson and LeBreton (2004, p. 238) multiple regression analysis can be applied both to prediction and explanation. He asserts that “When multiple regression is used for a purely predictive purpose, a regression equation is derived within a sample to predict scores on a criterion variable from scores on a set of predictor variables. This equation can be applied to predictor scores within a similar sample to make predictions of the unknown criterion scores in that sample. The elements of the equation are regression coefficients, which indicate the amount by which the criterion score would be expected to increase as the result of a unit increase in a given predictor score, with no change in any of the other predictor scores”.
25
4.
RESULTS AND DISCUSSION
Here are presented descriptive statistics concerning use of BIS and assessment of organizational culture. OCAI analysis concerning data related to organizational culture in a global approach is also presented.
4.1.Descriptive statistics and stepwise regression
The universe of variables is considerable, corresponding to particular questions of the questionnaire, so here results are presented in variables grouped by its meaning. Description of variables under scope is provided in annex 8.1.
4.1.1. Descriptive Statistics Results for Organizational Culture
Using SPSS, descriptive statistics were performed and results are presented.
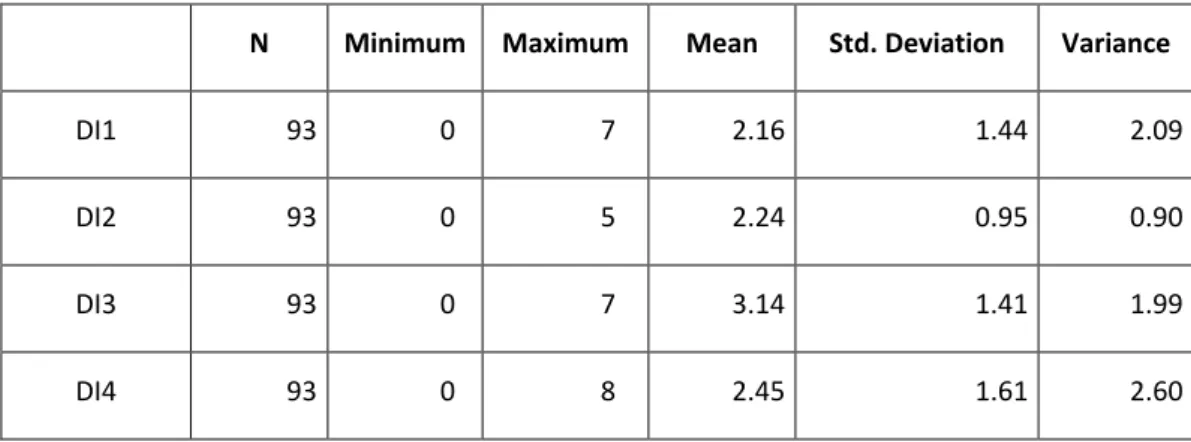
Dominant characteristics results are presented on Table 1. Market culture presents the higher mean (3.14), indicating that this might be the culture style that most influences organizations. Lower values for measures of dispersion were found in adhocracy culture style (variance – 0.90 and standard deviation – 0.95), which means that all organizations share evenly the relative weight of this culture style into their own cultures.
Organizational leadership results figure on Table 2. As verified for previous dimension, Market culture presents the higher mean (3.23), indicating that this might be the culture style that most influences organizations. Lower values for measures of dispersion were found in clan culture style (variance – 0.78 and standard deviation – 0.88), which means that all organizations share evenly the relative weight of this culture style into their own cultures.
27
standard deviation – 0.91), which means that all organizations share evenly the relative weight of this culture style into their own cultures.
Organizational glue results figure on Table 4. Analyzing results for this
dimension, all culture styles have very similar means, tough market culture style exhibits a higher mean (2.90). Measures of dispersion are lower in adhocracy culture style (variance – 1.18 and standard deviation – 1.08), however more significant than as verified in previous dimensions.
Strategic emphasis results are showed on Table 5. Means are very close one to the others however hierarchy culture style presents a higher mean (2.96). Measures of dispersion are lower in adhocracy culture style (variance –1.03 and standard deviation
– 1.02), however more significant as verified in previous dimension, organizational glue.
Criteria of success results are presented on Table 6. Means are very close one to the others however market culture style presents a higher mean (2.78). Measures of dispersion are lower in adhocracy culture style, as verified in every other dimension (variance – 1.34 and standard deviation – 1.16).
Organizational culture
Table 1 - Results for dominant characteristics
N Minimum Maximum Mean Std. Deviation Variance
DI1 93 0 7 2.16 1.44 2.09
DI2 93 0 5 2.24 0.95 0.90
DI3 93 0 7 3.14 1.41 1.99
Table 2 - Results for organizational leadership
N Minimum Maximum Mean Std. Deviation Variance
DII1 93 0 4 1.68 0.88 0.78
DII2 93 0 4 1.90 0.91 0.83
DII3 93 0 8 3.23 1.34 1.80
DII4 93 0 8 3.19 1.31 1.72
Table 3 - Results for management of employees
N Minimum Maximum Mean Std. Deviation Variance
DIII1 93 0,6 7 3.09 1.40 1.95
DIII2 93 0 4 1.68 0.91 0.83
DIII3 93 0 7 2.49 1.23 1.51
DIII4 93 0 7 2.74 1.51 2.29
Table 4 - Results for organizational glue
N Minimum Maximum Mean Std. Deviation Variance
DIV1 93 0 7 2.64 1.42 2.01
DIV2 93 0 5 2.05 1.08 1.18
DIV3 93 0 5 2.91 1.14 1.29
29 Table 5 - Results for strategic emphasis
N Minimum Maximum Mean Std. Deviation Variance
DV1 93 1 7 2.44 1.29 1.66
DV2 93 0 5 2.06 1.02 1.03
DV3 93 0 6 2.54 1.14 1.30
DV4 93 0 7 2.96 1.49 2.23
Table 6 - Results of criteria of success
N Minimum Maximum Mean Std. Deviation Variance
DVI1 93 0 6 2.56 1.37 1.89
DVI2 93 0 6 2.01 1.16 1.34
DVI3 93 0 10 2.78 1.63 2.67
DVI4 93 0 6,4 2.66 1.44 2.08
4.1.2. Stepwise regression analysis
The methodology used provided different models according to prevailing cultural styles. In all models, the dependent variable Y represents the use of BIS.
4.1.2.1. Clan style
The resultant model is:
Variables in Model: N - 20
Group Coef. Std. Coeff. Std. Error F-to-Remove P
Constant 0.511 0.704
BI4 0.452 0.515 0.135 11.180 0.004
BI14 0.469 0.449 0.161 8.496 0.010
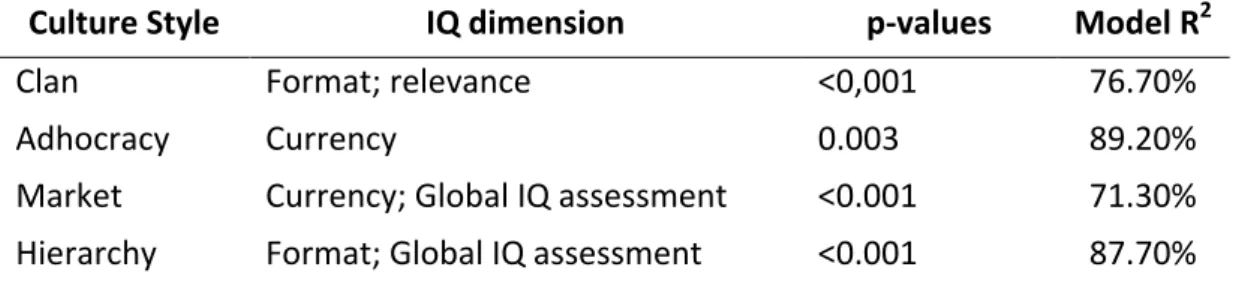
Under Clan style, 76.70% of the variability of use of BIS is explained by variables BI4, associated with format of information and BI14, associated with relevance, which is considered a good power of explanation.
4.1.2.2. Market style
The resultant model is:
Y = 0.898 + 0.597BI11 + 0.292 BI16 R2 = 0.713
Variables in Model: N - 40
Group Coef. Std. Coeff. Std. Error F-to-Remove P
Constant 0.898 0.535
BI11 0.597 0.576 0.115 27.004 <0.001
BI16 0.292 0.360 0.0897 10.585 0.002
Under Market style, 71.30% of the variability of use of BIS is explained by variables BI11, associated with currency of information and BI14, associated with global assessment of IQ, which is considered a good power of explanation.
4.1.2.3. Hierarchy style
The resultant model is:
31
Variables in Model: N - 25
Group Coef. Std. Coeff. Std. Error F-to-Remove P
Constant 0.309 0.438
IQI4 0.623 0.570 0.132 22.446 <0.001
IQI18 0.427 0.421 0.122 12.223 0.002
Under Hierarchy style, 87.70% of the variability of use of BIS is explained by variables BI4, associated with format of information and BI18, associated with global assessment of IQ, which is considered a good power of explanation.
4.1.2.4. Adhocracy style
The resultant model is: Y = -1.202 + 1.226BI10 R2 = 0.892
Variables in Model: N - 8
Group Coef. Std. Coeff.
Std.
Error
F-to-Remove P
Constant -1.202 1.432
BI10 1.226 0,892 0.253 23.471 0.003
4.1.3. Discussion of the results
The culture under which the best model was developed is hierarchy, where IQ dimension format, was very significant to explain the use of BIS. Under such culture style, where there is a major concern on rules and procedures, error detection, measurements and control, information format appears to rise as a critical factor on use of BIS. Overall assessment of IQ was also significant to explain use of BIS, which is desirable under a culture that targets smooth-running operations.
Under clan culture, use of BIS is much related to format and relevance. These results suggest that in a collaborative work environment, with employees highly committed, information format (p=0.004) and relevance (p=0.01) might be the information dimension more important to users in what regards BIS use.
Market results suggest that in a competitive environment, focused on productivity improvement, current information appears to rise as a critical factor on use of BIS. Highly rating BIS in what relates with the quality of information it provides, seems to explain as well the use of BIS.
Adhocracy results suggest that in an innovative environment, focused on continuous improvement and anticipating needs, information currency appears to rise as a critical factor on use of BIS, although these results are presented as an indication or possible trend to further explore, once the sample was very small.
A resume of all models generated under the four different culture styles, are presented on Table 7.
Table 7 - Summary of the regression models
Culture Style IQ dimension p-values Model R2
Clan Format; relevance <0,001 76.70%
Adhocracy Currency 0.003 89.20%
33
4.2.OCAI analysis to medium and large organizations operating in Portugal
In order to assess organizational culture on the universe under study, Organizational Culture Assessment Instrument (OCAI) has been used (Cameron & Quinn, 2006b; Tharp, 2009). On a global point of view, we can observe the results obtained on the six dimensions of organization culture, according to Tharp (2009). The distribution of responses by sector of activity is resumed on Table 8, so different sectors of activity have actually different impacts on global results. Manufacturing with 23.97% of responses has more influence on the global results then Information and Communication does (0.68%).
Table 8 - Percentage of responses by sector of activity
Sector % Responses
C - Manufacturing 23.97%
G - Wholesale and retail trade; repair of motor vehicles and motorcycles 16.44%
S – Other service activities 13.01%
Q - Human health and social work activities 8.90%
F - Construction 7.53%
H - Transportation and storage 6.16%
I - Accommodation and food service activities 6.16%
E - Water supply, sewerage, waste management and remediation activities 4.79%
M - Professional, scientific and technical activities 2.74%
D - Electricity, gas, steam and air conditioning supply 2.74%
N - Administrative and support service activities 2.05%
O - Public administration and defense; compulsory social security 1.37%
K - Financial and insurance activities 1.37%
R - Arts, entertainment and recreation 0.68%
A - Agriculture, forestry and fishing 0.68%
J – Information and communication 0.68%
Unknown 0.68%
to design new strategies, using their strengths more efficiently and perform risk assessment to their weaknesses and opportunities.
To my best knowledge, this is the first survey submitted to Portuguese medium and large organizations to assess organizational culture, so no future desired culture is tackled. Further studies can use this data to evaluate preferences and foresee future scenarios.
4.2.1. Dominant culture
Dominant culture (Figure 7) results shows that medium and large organizations in Portugal, covering different sectors of activity, are very balanced in what concerns the four culture-types, being hierarchy culture more relevant than clan and adhocracy cultures, although market has a stronger influence on global culture (Figure 7). Stability and control are the dominant values. Another important indicator on Portuguese business environment might be the ability to adapt to changes, given the balance found on global culture assessment results.
Figure 7 – Dominant culture
4.2.2. Dominant Characteristics
The results obtained to the total of responses including all sectors of activity, are represented on the graph below (Figure 8).
13,45 17,30 14,41 24,76 17,15 23,75 15,81 21,11 0,00 5,00 10,00 15,00 20,00 25,00 Flexibility and discrition Adhocracy
External Focus and differentiation
Market
Stability and Control Hirarchy
Internal Focus and Integration
35
The analysis of results gives us some important information. There is a clear trend, previously shown on dominant culture that matches dominant characteristics, as expected, though the values vary. Market culture presents a higher score (27.33), meaning that in a global way organizations are very competitive and goal-oriented, where market share and penetration are major concerns. The other cultural types with lower scores are, hierarchy (21.31), emphasising stability and control values, adhocracy (19.46) which means that creativity and innovation are not the primary objectives, and clan (18.82), the least scored, shows that human resources and team building as an organizational resource represent the values organizations care less.
13,53 19,46
16,07
27,33 16,93
21,31 14,13
18,82
0,00 5,00 10,00 15,00 20,00 25,00 30,00
Flexibility and discrition
Adhocracy
External Focus and differentiation
Market
Stability and Control Hirarchy
Internal Focus and Integration
Clan
4.2.3. Organizational leadership
Figure 9 – Organizational leadership
In what regards organizational leadership (Figure 9), stability and control have stronger global influence as happened with dominant characteristics previously. Leadership is more focused on market and its clients and hierarchy culture (27.72), where leaders are typically good coordinators and organizers. The higher score is registered on market culture, meaning that leadership will encourage goal achievement and profitability. The other cultural types with lower scores are adhocracy (16.55) and clan (14.59). Leadership promotes essentially stability and control values to enhance competitiveness, creating partnerships and improving productivity.
10,96 16,55
14,72
28,06 19,72
27,72 13,52
14,59
0,00 5,00 10,00 15,00 20,00 25,00 30,00
Flexibility and discrition
Adhocracy
External Focus and differentiation
Market
Stability and Control Hirarchy
Internal Focus and Integration
37
4.2.4. Management of employees
Figure 10 - Management of employees
Management of employees is typically characterized by clan culture, with a score of 26.83, as Figure 10 - Management of employeesshows. This kind of environment is characterized by a pleasant place to work, mentoring by leaders and strong team capabilities. Internal focus and integration are major values in what regards management of employees, were hierarchy culture, with a score of 23.84 expose the importance of formal rules and procedures. Market culture has also a strong influence on management of employees (21.61) and indicator that employees are driven to pursuit profitability. The lower score is verified to adhocracy (14.64), where innovative and creative processes are not engaged.
13,39 14,64 12,34 21,61 16,03 23,84 17,85 26,83 0,00 5,00 10,00 15,00 20,00 25,00 30,00 Flexibility and discrition Adhocracy
External Focus and differentiation
Market
Stability and Control Hirarchy
Internal Focus and Integration
Clan
4.2.5. Organizational Glue
Figure 11- Organizational glue
The dominant culture on organization glue is, as presented on Figure 11, market culture (25.29), as verified on organizational leadership and dominant characteristics and criteria of success. Clan (22.99) and hierarchy (20.81) also present relevant scores. What stick people and organizational identity is customer focus, employee involvement and formal guidelines. Adhocracy obtained the lower score with 17.83, meaning cohesion is not acquired through innovative processes.
14,20
17,83
14,79
25,29 16,14
20,81 15,45
22,99
0,00 5,00 10,00 15,00 20,00 25,00 30,00
Flexibility and discrition
Adhocracy
External Focus and differentiation
Market
Stability and Control Hirarchy
Internal Focus and Integration
39
4.2.6. Strategic Emphasis
Figure 12 - Strategic emphasis
Figure 12 shows that Strategic emphasis are more influenced by hierarchy culture (25.75), meaning that the major strength comes from efficient smooth running operations and stability. The lower scores are observed in market (22.08), clan (21.21) and adhocracy (17.87). Stability and control are important values, more relevant than promoting innovation or reinforcing human capital.
13,72
17,87
13,97
22,08
16,81 25,75
16,45 21,21
0,00 5,00 10,00 15,00 20,00 25,00 30,00
Flexibility and discrition
Adhocracy
External Focus and differentiation
Market
Stability and Control Hirarchy
Internal Focus and Integration
4.2.7. Criteria of Success
Figure 13 - Criteria of success
Market culture stands out in criteria of success dimension (24.21), meaning that success is measured by market share and penetration, with competitive pricing and market leadership (see Figure 13). Once hierarchy appears with a high score too (23.09), success may be seen also as a result of well-established rules and procedures. Clan (22.24) and adhocracy (17.48) obtained lower scores, showing that stability and control are values to pursuit, rather than flexibility and discretion.
Table 9 resumes the prevailing cultures for all dimension of organization culture that have been studied.
Table 9 - Resume of culture dimensions results
Culture Dimension Prevailing Culture
Dominant characteristics Market Organizational Leadership Market Management of employees Clan Organizational glue Market Strategic Emphasis Hierarchy Criteria of Success Market
13,84 17,48 14,35 24,21 16,71 23,09 16,02 22,24 0,00 5,00 10,00 15,00 20,00 25,00 Flexibility and discrition Adhocracy
External Focus and differentiation
Market
Stability and Control Hirarchy
Internal Focus and Integration
41
4.3. Interpretation of OCAI Results
The Type of culture that prevails among medium to large organizations in Portugal is Market Culture, where organizations are focused on the external positioning, needing stability and control. These are result-oriented organizations, with competitive and goal-oriented people and strong and demanding leaders. Winning is what promotes organizational cohesion. Common concerns are reputation and success. Long-term strategies focus competitive actions and achievement of measurable goals and targets. Success is measured in terms of market share and penetration. The organizational style can be defined as hard-driving competitiveness.
The Strength of a specific culture is deeply associated to business environment where they act. In a highly competitive business environment, market dominant culture with strong representation can constitute in fact an advantage. What is observable in medium to large scale organizations operating in Portugal is that market is the dominant culture, yet scores for hierarchy and clan culture are not very distant from the market ones. So it cannot be said that culture is strong, because none of the culture styles stands out expressively, being more a mix of different culture types. This might allow adaptability, but little differentiation.
Culture Congruence is higher when different culture dimensions are aligned and plots of different dimensions are similar. In this particular case, we have similar plots, namely for dominant culture, dominant characteristics, organizational leadership and criteria of success. Yet management of employees and strategic emphasis present dissimilar plots and profiles. This means that congruence is not fulfilled in every dimension of organizations or that exist relevant culture differences among organizations under scope that are contributing to this effect. Being high performance more frequent among congruent organizations, they should then analyze their own culture congruence and its possible impacts, being aware that incongruences might lead to differences in perspectives and goals, and differences in strategies within organization.
Cameron and Quinn (2006) observed a large number of organizations and trends