Structural variation and content of aboveground living biomass in an
area of Atlantic Forest in the State of São Paulo, Brazil¹
Maria Cláudia Melo Pacheco de Medeiros2,4 and Marcos Pereira Marinho Aidar3
Received: 2.03.2011; accepted: 18.08.2011
ABSTRACT - (Structural variation and content of aboveground living biomass in an area of Atlantic Forest in the State of São Paulo, Brazil). Knowledge of the vegetation structure in the Atlantic Forest is essential to support studies about its functioning, in view of broad interest issues such as global carbon balance. This study aimed to describe the structural variation in a heterogeneous area at Núcleo Santa Virgínia, Parque Estadual da Serra do Mar and how the aboveground living biomass is distributed in its phytophysiognomies. In each physiognomy studied, blocks of 10 × 10 m plots were allocated, totaling 0.6 ha of sampling. From the 1,046 individuals with PBH ≥ 15 cm sampled, 443 were in riparian forest (RF), 272 in valley forest (VF) and 331 in hill forest (HF), with a total of 119 species. Shannon index was 3.63 and Pielou equability 0.76. Biomass estimated corresponds to 225.45 mg ha-1 (total), 193.6 mg ha-1 (RF), 299.85 mg ha-1 (VF) and 182.9 mg ha-1 (HF). The forest presents similar features to other fragments previously analyzed.
Key words: carbon stocks, phytosociology, successional stage, tropical montane forest
RESUMO - (Variação estrutural e conteúdo de biomassa viva aérea numa área de Mata Atlântica do Estado de São Paulo, Brasil). O conhecimento estrutural da Mata Atlântica é essencial como subsídio a estudos sobre seu funcionamento, em vista de questões de amplo interesse, como balanço de carbono global. Este estudo objetivou descrever a variação estrutural de uma área heterogênea no Núcleo Santa Virgínia, Parque Estadual da Serra do Mar e como a biomassa viva aérea se distribui em suas fisionomias. Em cada fisionomia estudada, blocos de parcelas de 10 × 10 m foram alocados, totalizando 0,6 ha. Dos 1.046 indivíduos com CAP ≥ 15 cm amostrados, 443 estavam na floresta ripária (RF), 272 na floresta de vale (VF) e 331 na floresta de encosta (HF), totalizando 119 espécies. O índice de Shannon foi 3,63 e a equabilidade de Pielou 0,76. A biomassa estimada corresponde a 225,45 mg ha-1 (total), 193,6 mg ha-1 (RF), 299,85 mg ha-1 (VF) e 182,9 mg ha-1 (HF). A floresta apresenta características similares a outros fragmentos previamente analisados.
Palavras-chave: estágio sucessional, estoques de carbono, fitossociologia, floresta tropical montana
1. Part of the first author’s Master’s Degree Dissertation by Program of Post graduation in Biodiversidade Vegetal e Meio Ambiente, Instituto de Botânica, São Paulo, SP, Brazil
2. Universidade de São Paulo, Program of Post graduation in Ciências (Botânica), P.O. Box 11461, 05422-970 São Paulo, SP, Brazil 3. Instituto de Botânica, Núcleo de Pesquisa em Fisiologia e Bioquímica, P.O. Box 68041, 04045-972 São Paulo, SP, Brazil 4. Corresponding author: [email protected]
Introduction
Atlantic Domain has its largest remaining areas in the South and Southeast regions of Brazil. The State of São Paulo is the second in ranking of sites with the largest areas of this forest, comprising about 20,000 km2 of a total of approximately 98,000 km2 remaining (Fundação SOS Mata Atlântica & INPE 2008). Forest fragments in that State have variable sizes, successional stages and conservation status (Sanqueta 2008) and occur in a wide range of climatic, topographical and soil conditions. About half of the largest remaining fragments are protected in
Conservation Units (Galindo & Câmara 2005), mostly located in mountainous areas.
According to the physiognomic ecological system of Veloso et al. (1991), the vegetation that
predominantly occurs in that region is classified as
Ombrophilous Dense Forest and it is subdivided into altitudinal facies. Between 16º and 24º South parallels, in altimetric tracks ranging from 500 to 1,500 m, there are montane formations, which cover Serra do Mar and portions of the Atlantic Plateau.
floristic and structural characterization in areas with
this type of formation (França & Stehmann 2004). Within the last years, studies performed in areas of Montane Ombrophilous Dense Forest in the State of São Paulo focused on ecological succession (Tabarelli & Mantovani 1999, Aidar et al. 2001), on phytosociological structure of tree component (Gomes et al. 2005, Ogata & Gomes 2006) and on
the floristic composition of that same component
(Catharino et al. 2006).
Knowing the structure of areas of Atlantic Forest is extremely important to support studies focusing on understanding how the vegetation is functioning in that domain (Vieira et al. 2008), especially in view of current broad interest issues such as global carbon balance. Tropical forests are, in general, large reservoirs of carbon due to their size and productivity (Malhi & Grace 2000, Houghton et al. 2001). The estimate of carbon stocks in a forest depends on the knowledge of parameters such as its biomass, which can be obtained from data of the vegetation structure using allometric equations (King 1996, Chave et al. 2005). Currently, only few allometric models are available to estimate the biomass of tropical forests (Cole & Ewel 2006). In Brazil, most of the studies using these equations were developed in the Amazon Forest (Araújo et al. 1999, Keller et al. 2001, Vieira et al. 2004). Very few studies have been conducted in other regions such as Pantanal (Salis et al. 2006) and the Atlantic Forest (Tiepolo et al. 2002, Dias et al. 2006, Vieira et al. 2008, Alves et al. 2010).
Thus, this study aimed to characterize the structure of tree component in three different physiognomies of a Montane Ombrophilous Dense Forest area at Parque Estadual da Serra do Mar, in the State of São Paulo, and to estimate their aboveground living biomass by using allometric equations, and thus answering the following questions: 1) How is the structural variation in the forest of study? and 2) How is the aboveground living biomass distributed in that forest?
Material and methods
Study area - Núcleo Santa Virgínia (coordinates between 23°17'-23°24'S and 45°03'-45°11'W) at Parque Estadual da Serra do Mar has approximately 16,000 ha. It is inserted in a narrow strip of Atlantic Plateau between the coastal region and Paraíba Valley, covering the municipalities of São Luiz do Paraitinga and Natividade da Serra (Instituto Florestal 2006). The altitudes range from 860 m to 1,500 m and the
topography appears to be very steep, with straight slopes and valleys (Villani 1998). The predominant types of soil in the region are Red-Yellow Latosol, Cambisol and Litolic (Radambrasil 1983).
The regional climate can be classified as
Cwa, according to Köeppen climatic classification
(Setzer 1966), and the mean annual precipitation is 2,180 mm. December, January and February are the most humid months of the year while June, July and August present the lowest precipitation volume. The average precipitation for each month exceeds 60 mm (São Paulo 1972).
The vegetation of the area is predominantly characterized by Montane Ombrophilous Dense Forest (Veloso et al. 1991). Regarding the history of vegetation in Núcleo Santa Virgínia, Tabarelli & Mantovani (1999) reported that part of that forest was clear cut and burned in the 1960s, and it is currently a mosaic formed by mature forest areas, grassland, plantations of Eucalyptus spp. and secondary forest at different ages of regeneration.
This study is a result of a partnership between two Brazilian research projects (see Acknowledgments for more information) and the necessity for its implementation arose due to the installation of a micrometeorological tower in Núcleo Santa Virgínia, in the basin of Casa de Pedra streamlet, as predicted in the projects mentioned above. The tower provides the structure for equipments that measure
atmospheric flow of energy, H2O and CO2 in order to estimate balance of energy, water and carbon in the surrounding areas. Thus, it became necessary to
characterize the vegetation in the area of influence of
the micrometeorological tower.
Ve g e t a t i o n s a m p l i n g - T h e r e c o g n i t i o n o f phytophysiognomies was performed during the mapping of the vegetation of Casa de Pedra streamlet's basin area through photointerpretation of aerial photos
from 2001 (scale of 1: 35,000), followed by a field verification (Medeiros et al. in prep.). Three areas were selected for sampling due to their representativity and accessibility. They are named throughout this study as hill forest (HF), valley forest (VF) and riparian forest (RF), according to their position in the basin. Samplings were conducted at approximately 970 m, 1,000 m and 960 m of altitude, respectively.
(0.2 ha) were installed in each phytophysiognomy, totaling 0.6 ha of sample area.
In each plot, all trees with stem perimeter at 1.30 m above the ground (or perimeter at breast
height, PBH) ≥ 15 cm, which is equivalent to diameter (DBH) ≥ 4.8 cm were sampled and measured. For
stems branched below 1.30 m, individuals which possessed at least one of its branches in the criterion for inclusion were sampled. Tree heights were estimated visually by comparison with a stick of known height. Standing dead individuals were included in sampling. Data analysis - From the data collected in the
field, species phytosociological parameters such as
frequency, density, dominance and value of importance were determined both for the total sampling and for each physiognomy. They were calculated using FITOPAC 2.0 (available at http:// www.taxondata.org/ forum/index.php). Other general structural parameters such as density, basal area and mean diameter were also computed for each area. These attributes were
tested in order to detect significant variation among
physiognomies using Kruskal-Wallis tests, followed, when necessary, by Dunn tests. This approach is applied when data does not follow normality and homocedasticity conditions necessary to perform an Anova analysis (Callegari-Jacques 2003). These tests were conducted with the software BioEstat 5.0 (Ayres et al. 2007).
A list of species was elaborated according to
APG III (2009). All species found were classified
regarding the successional group as pioneer, early
secondary or late secondary (Gandolfi et al. 1995).
This classification aimed to analyze successional
stage in the study area in general and in each physiognomy. It was conducted based on the studies of Ivanauskas et al. (1999), Scudeller et al. (2001), Alves & Metzger (2006) and Catharino et al. (2006). Field observations on localities of occurrence of species and their life habits were also considered.
For those identified to the level of genus or family or which lacked sufficient literature information or field
observations, the term “not characterized” was applied. The proportions of individuals per successional group for each physiognomy were compared applying the qui-square test (Callegari-Jacques 2003) with the
purpose to detect possible significant differences. The
tests were conducted with the software BioEstat 5.0 (Ayres et al. 2007).
In order to compare species richness among physiognomies, sample-based rarefaction curves for
each area were obtained (Gotelli & Colwell 2001) using Estimates 8.2 (Collwell 2009). The Shannon diversity index (H') and the Pielou equability (J) (Pielou 1975) were also calculated.
Histograms of diameter and height distribution were created for the individuals combined and for each physiognomy. Ten classes of diameter interval and 15 classes of height interval were established for analysis.
Complementing structural comparison and characterization of the physiognomies studied, estimates of aboveground living biomass were performed. For that purpose, a pan-tropical allometric equation described by Chave et al. (2005, model b) was applied for the living trees sampled which were not palms or ferns. This equation is based on values of diameter at breast height (DBH, in centimeters),
total height (H, in meters) and specific wood density (ρ, in g cm-3). It is expressed as:
Biomass = exp [-2.977 + ln (ρ × DBH2 × H)]
Values of species wood density were obtained from previous studies conducted by Chave et al. (2006) and from a previous database produced by Brazilian researchers (Alves, personal communication).
To estimate the biomass of palm trees, the allometric model proposed by Nascimento & Laurance (2002) was applied:
Biomass = {exp [0.9285 × ln (DBH2) + 5.7236] × 1.05001} / 103
On the other hand, the biomass of tree ferns was calculated using the equation proposed by Tiepolo et al. (2002):
Biomass = -4,266,348 / 1-[2,792,284 × exp (-0.313677 × H)]
Results and Discussion
in a stretch with 18 years, 2.735 ind ha-1 in a stretch with 40 years and 2.335 ind ha-1 in a stretch of mature forest. Basal area values were, respectively, 5 m2 ha-1, 23.4 m2 ha-1, 33.4 m2 ha-1 and 38.6 m2 ha-1. Comparing the average of the results found by those authors (2.418 ind ha-1 for density and 25.1 m2 ha-1 for basal area), to the ones obtained in the present study, it is noteworthy that the tree density of the latter is relatively low. However, it is worth emphasizing that this is attributed to the criterion for inclusion used by
those authors, PBH ≥ 10 cm or DBH ≥ 3.2 cm, which
is lower than the values used in this study.
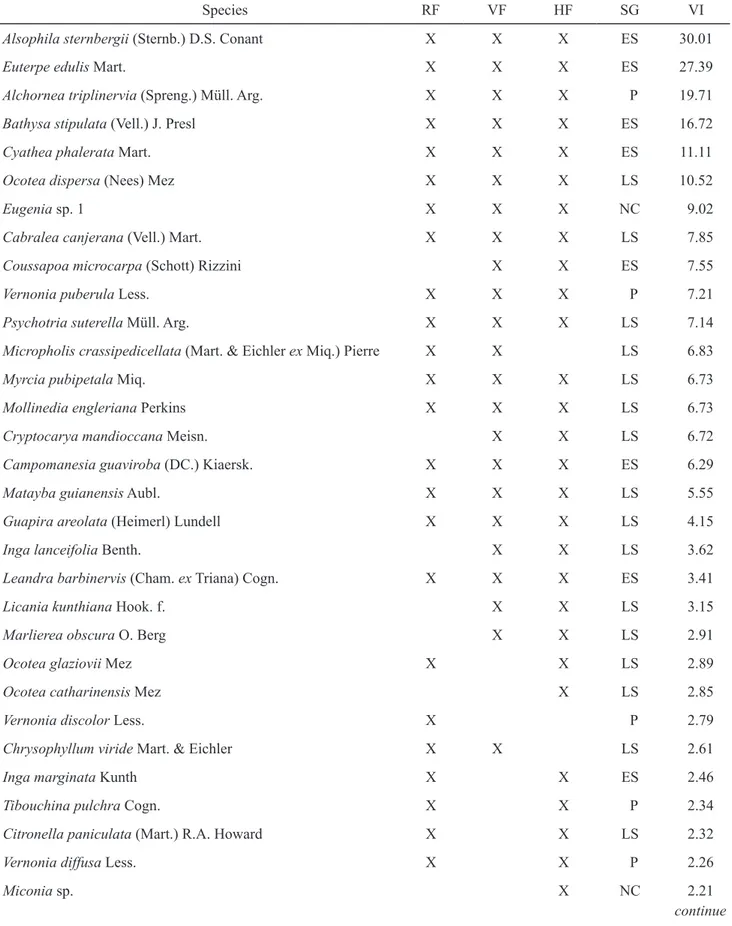
The ten species of highest value of importance (VI) of total sampling represented 49% of total VI (table 1). From those, Alsophila sternbergii, Euterpe
edulis, Bathysa stipulata, Cyathea phalerata and
Eugenia sp.1 were distinguished by their high density.
These species comprised 43.4% of the individuals sampled and 31.4% of total VI. Vernonia puberula
stood out by frequency parameter and combined 2.4% of total VI. In turn, Alchornea triplinervia,
Ocotea dispersa, Cabralea canjerana and Coussapoa
microcarpa stood out among species of highest value
of importance (15.2% of it) in total sampling by their high dominance. Among all species, 48 (40%) were represented by only one individual, summing 6.8% of total VI.
Alsophila sternbergii and Cyathea phalerata
presented, respectively, the first and fifth greatest VI
of total sampling. Pteridophytes are represented in the Southeast/South regions of Brazil by about 600 species, most of them located in Serra do Mar (Tryon & Tryon 1982). According to these authors, tree ferns of Cyatheaceae often form dense populations in mountainous regions, where they are dominant in vegetation. The two mentioned species represented together 13.7% of total VI and 21.4% of all living individuals sampled.
Euterpe edulis ("jussara palm") showed the
second highest VI of total sampling. This species has been cited as having structural importance in other studies in Atlantic Forest areas from São Paulo, mainly due to its density (Sanchez et al. 1999, Sztutman & Rodrigues 2002, Guilherme et al. 2004, Gomes et al. 2005). Euterpe edulis is one of the most abundant and widely distributed palms in Atlantic Forest, in general, which may be associated with the high reproductive success of this species.
It produces a significant amount of fruit each year
(Reis & Kageyama 2000).
Alchornea triplinervia, the third largest VI, was
represented mostly by large-sized trees. The mean diameter of its individuals in the sample was 30.2 cm and the mean height was 12.9 m. This species was also important for the structure of communities studied by Sztutman & Rodrigues (2002), in peat forest at Parque Estadual da Campina do Encantado and Guilherme et al. (2004), in Lowland Ombrophilous Dense forest at Parque Estadual Intervales, both in São Paulo.
Among the most important species in structure of total sampling, Coussapoa microcarpa is noted for showing the ninth highest value of importance. This species is hemiepiphyte, higrophylous (Martins et al. 2008), popularly known as "strangler tree", commonly represented by robust individuals that grow especially in the upper stem portion of its host (Gonçalves & Waechter 2003). The mean diameter found for the four representatives of this species in this study was 67.9 cm, and the mean height was 16.7 m. It is important to highlight that the value of importance of this species might have been overestimated, since measures of host species and hemiepiphytes were taking into account while performing its calculation.
This is due to the fact that it is very difficult to measure them separately while collecting field data.
Shannon diversity index (H') was 3.63 nats ind-1 and Pielou equability (J) was 0.76. These values are close to those found by other authors in other Atlantic forest areas: Melo & Mantovani (1994) found H' = 3.64 nats ind-1 and J = 0.72, Sanchez et al. (1999) found H' = 4.07 nats ind-1 while Tabarelli & Mantovani (1999) found the mean value of H' = 3.68 nats ind-1.
Analyzing structure of physiognomies RF, VF and HF separately in order to identify differences among them, 443, 272 and 331 individuals were obtained, respectively. Thus, density values were 2.215 ind ha-1 for RF, 1.360 ind ha-1 for VF and 1.655 ind ha-1 for HF. Kruskal-Wallis test showed a significant difference for this parameter among physiognomies
(H = 11.84, g.l. = 2, α = 5%). When proceeding with
the Dunn test (z0.05), the results showed that there was considerable variation among the density presented by RF and VF. In fact, density was the main feature in initial distinction among the three physiognomies, by photointerpretation, when it was noted that VF had a more uniform canopy compared to the other two physiognomies, and that RF had a greater density of crown canopy. These observations were in fact
Table 1. List of species sampled in a Montane Ombrophilous Dense forest area at Núcleo Santa Virgínia, Parque Estadual da Serra do Mar, São Paulo, Brazil. RF: Riparian forest; VF: Valley forest; HF: Hill forest; SG: Successional Group; P: Pioneer; ES: Early secondary; LS: Late secondary; NC: Not characterized; VI: Value of importance.
Species RF VF HF SG VI
Alsophila sternbergii (Sternb.) D.S. Conant X X X ES 30.01
Euterpe edulis Mart. X X X ES 27.39
Alchornea triplinervia (Spreng.) Müll. Arg. X X X P 19.71
Bathysa stipulata (Vell.) J. Presl X X X ES 16.72
Cyathea phalerata Mart. X X X ES 11.11
Ocotea dispersa (Nees) Mez X X X LS 10.52
Eugenia sp. 1 X X X NC 9.02
Cabralea canjerana (Vell.) Mart. X X X LS 7.85
Coussapoa microcarpa (Schott) Rizzini X X ES 7.55
Vernonia puberula Less. X X X P 7.21
Psychotria suterella Müll. Arg. X X X LS 7.14
Micropholis crassipedicellata (Mart. & Eichler ex Miq.) Pierre X X LS 6.83
Myrcia pubipetala Miq. X X X LS 6.73
Mollinedia engleriana Perkins X X X LS 6.73
Cryptocarya mandioccana Meisn. X X LS 6.72
Campomanesia guaviroba (DC.) Kiaersk. X X X ES 6.29
Matayba guianensis Aubl. X X X LS 5.55
Guapira areolata (Heimerl) Lundell X X X LS 4.15
Inga lanceifolia Benth. X X LS 3.62
Leandra barbinervis (Cham. ex Triana) Cogn. X X X ES 3.41
Licania kunthiana Hook. f. X X LS 3.15
Marlierea obscura O. Berg X X LS 2.91
Ocotea glaziovii Mez X X LS 2.89
Ocotea catharinensis Mez X LS 2.85
Vernonia discolor Less. X P 2.79
Chrysophyllum viride Mart. & Eichler X X LS 2.61
Inga marginata Kunth X X ES 2.46
Tibouchina pulchra Cogn. X X P 2.34
Citronella paniculata (Mart.) R.A. Howard X X LS 2.32
Vernonia diffusa Less. X X P 2.26
Miconia sp. X NC 2.21
Species RF VF HF SG VI
Schefflera calva (Cham.) Frodin & Fiaschi X LS 2.06
Guarea macrophylla Vahl X X LS 2.03
Trichilia pallens C.DC. X X LS 2
Myrcia splendens (Sw.) DC. X X LS 1.84
Myrtaceae sp. X X NC 1.77
Myrciaria floribunda (H. West ex Willd.) O. Berg X X X LS 1.75
Cedrela fissilis Vell. X X ES 1.71
Myrceugenia myrcioides (Cambess.) O. Berg X X LS 1.66
Calyptranthes lucida Mart. ex DC. X X LS 1.64
Cyathea delgadii Sternb. X X LS 1.60
Psychotria nemorosa Gardner X ES 1.53
Mollinedia argyrogyna Perkins X X ES 1.5
Guatteria sp. X X NC 1.48
Alseis floribunda Schott X X X ES 1.48
Marlierea sylvatica (Gardner) Kiaersk. X X LS 1.47
Inga cf. arenicola T.D. Penn. X ES 1.44
Myrcia spectabilis DC. X LS 1.43
Tetrorchidium rubrivenium Poepp. X X ES 1.41
Cordia trichoclada DC. X X P 1.33
Eugenia ternatifolia Cambess. X X X LS 1.27
Allophylus edulis (A. St.-Hil., Cambess. & A. Juss.) Radlk. X P 1.24
Nectandra puberula (Schott) Nees X LS 1.21
Marlierea suaveolens Cambess. X LS 1.18
Daphnopsis schwackeana Taub. X X LS 1.13
Schefflera angustissima (Marchal) Frodin X ES 1.12
Pouteria caimito (Ruiz & Pav.) Radlk. X X LS 0.98
Rollinia dolabripetala (Raddi) R.E.Fr. X X ES 0.96
Hyeronima alchorneoides Allemão X ES 0.87
Solanum cf. gemellum Mart. ex Sendtn. X ES 0.85
Casearia sylvestris Sw. X X ES 0.80
Syagrus romanzoffiana (Cham.) Glassman X ES 0.79
Rapanea gardneriana (A. DC.) Mez X X ES 0.78
Table 1 (continuation)
Table 1 (continuation)
Species RF VF HF SG VI
Pterocarpus rohrii Vahl X X LS 0.74
Eugenia sp. 2 X NC 0.70
Mollinedia schottiana (Spreng.) Perkins X LS 0.67
Sorocea bonplandii (Baill.) W.C.Burger, Lanj. & Boer X ES 0.67
Inga sessilis (Vell.) Mart. X ES 0.66
Cryptocarya moschata Nees & Mart. X LS 0.65
Pouteria psammophila (Mart.) Radlk. X LS 0.64
Casearia obliqua Spreng. X LS 0.64
Nectandra membranacea (Sw.) Griseb. X LS 0.60
Cupania sp. X X NC 0.59
Myrcia sp. X X NC 0.58
Sloanea monosperma Vell. X X LS 0.57
Eugenia platysema O. Berg X LS 0.57
Myrcia tijucensis Kiaersk. X X LS 0.57
Calyptranthes strigipes O. Berg X LS 0.57
Mollinedia blumenaviana Perkins X X ES 0.56
Cupania vernalis Cambess. X X ES 0.56
Maytenus sp. 2 X NC 0.47
Piptocarpha macropoda (DC.) Baker X P 0.46
Myrceugenia seriatoramosa (Kiaersk.) D. Legrand & Kausel X LS 0.38
Maytenus sp. 1 X NC 0.38
Miconia cabussu Hoehne X ES 0.36
Eugenia prasina O. Berg X LS 0.36
Asteraceae sp. X NC 0.36
Inga aff. lanceifolia Benth. X NC 0.34
Guapira opposita (Vell.) Reitz X LS 0.32
Myrcia tenuivenosa Kiaersk. X LS 0.31
Bathysa australis (A. St.-Hil.) Benth. & Hook. f. X LS 0.30
Myrceugenia glaucescens (Cambess.) D. Legrand & Kausel X LS 0.30
Posoqueria latifolia (Rudge) Roem. & Schult. X ES 0.30
Myrciaria sp. X NC 0.30
Byrsonima sp. X NC 0.30
Species RF VF HF SG VI
Marlierea sp. X NC 0.30
Ilex paraguariensis A. St.-Hil. X LS 0.29
Cupania oblongifolia Mart. X ES 0.29
Rudgea sp. X NC 0.29
Myrcia amazonica DC. X LC 0.29
Cryptocarya saligna Mez X LS 0.29
Schoepfia brasiliensis A.DC. X LS 0.29
Rapanea hermogenesii Jung-Mend. & Bernacci X ES 0.29
Cestrum schlechtendalii G. Don X LS 0.29
Magnolia ovata A. St.-Hil. X ES 0.28
Myrcia cf. guianensis (Aubl.) DC. X LS 0.28
Eugenia cf. cerasiflora Miq. X LS 0.28
Blepharocalyx salicifolius (Kunth) O. Berg X LS 0.28
Marlierea cf. racemosa (Vell.) Kiaersk. X LS 0.28
Heisteria silvianii Schwacke X LS 0.28
Casearia decandra Jacq. X LS 0.28
Siparuna brasiliensis A. DC. X ES 0.28
Eugenia oblongata Mattos & D. Legrand X LS 0.28
Psychotria vellosiana Benth. X LS 0.28
Rhodostemonodaphne macrocalyx ( Meisn. ) Rohwer ex Madriñán X LS 0.28
Ocotea daphnifolia (Meisn.) Mez X LS 0.28
Rubiaceae sp. X NC 0.28
Marlierea cf. excoriata Mart. X LS 0.28
Garcinia gardneriana (Planch. & Triana) Zappi X LS 0.28
Table 1 (continuation)
data obtained. Dead individuals represented 4.4% in RF, 4% in VF and 4.5% in HF, respectively.
Basal area values found were 10.27 m2 ha-1 (RF), 9.93 m2 ha-1 (VF) and 8.33 m2 ha-1 (HF). These values
were not significantly different, according to the result of Kruskal-Wallis test (H = 0.35, g.l. = 2, α = 5%).
VF, as described in the following topic, presented the largest individuals among the studied areas. However, this physiognomy presented an intermediate value of basal area, which is related to its fairly small density. On the other hand, RF showed the highest basal area, since the largest number of individuals was sampled
from that area. Finally, although HF presented an intermediate density, the majority of its representatives were of a small size and thus this forest showed the lowest value of basal area.
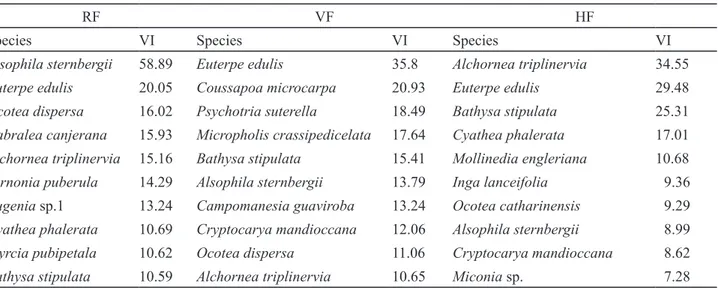
Comparing species of greatest importance in each physiognomy (table 2), except for Alsophila
sternbergii, Euterpe edulis, Alchornea triplinervia
and Bathysa stipulata which are important in all
physiognomies and thus throughout the study area, as previously discussed, some differences were found among the sampled areas.
Table 2. Species with the highest values of importance (VI) in three sampled physiognomies in a Montane Ombrophilous Dense forest area in Núcleo Santa Virgínia, Parque Estadual da Serra do Mar, São Paulo, Brazil. RF: Riparian forest; VF: Valley forest; HF: Hill forest.
RF VF HF
Species VI Species VI Species VI
Alsophila sternbergii 58.89 Euterpe edulis 35.8 Alchornea triplinervia 34.55
Euterpe edulis 20.05 Coussapoa microcarpa 20.93 Euterpe edulis 29.48
Ocotea dispersa 16.02 Psychotria suterella 18.49 Bathysa stipulata 25.31
Cabralea canjerana 15.93 Micropholis crassipedicelata 17.64 Cyathea phalerata 17.01
Alchornea triplinervia 15.16 Bathysa stipulata 15.41 Mollinedia engleriana 10.68
Vernonia puberula 14.29 Alsophila sternbergii 13.79 Inga lanceifolia 9.36
Eugenia sp.1 13.24 Campomanesia guaviroba 13.24 Ocotea catharinensis 9.29
Cyathea phalerata 10.69 Cryptocarya mandioccana 12.06 Alsophila sternbergii 8.99
Myrcia pubipetala 10.62 Ocotea dispersa 11.06 Cryptocarya mandioccana 8.62
Bathysa stipulata 10.59 Alchornea triplinervia 10.65 Miconia sp. 7.28
Eugenia sp.1 and Myrcia pubipetala are among the
species structurally most important just in RF, although they were present in the other two physiognomies.
C. canjerana stands out for its high dominance,
V. puberula and M. pubipetala were noted for the high
frequency and Eugenia sp.1 by its elevated density. In VF, Coussapoa microcarpa, Psychotria suterella,
Micropholis crassipedicelata and Campomanesia
guaviroba are the species that contribute to the
structural differences between this and the other physiognomies. P. suterella is distinguished by its high density and the other two by their dominance.
P. suterella and C. guaviroba also occur in the other
two areas, but they do not appear among the species with the highest values of VI. Finally, among the most important species in structure of HF that are not included in the species with the greatest VI in other areas, Mollinedia engleriana, Inga lanceifolia, Ocotea
catharinensis and Miconia sp. can be mentioned.
Among these, O. catharinensis and Miconia sp. are exclusive to the HF physiognomy. M. engleriana stood out in that area by the high density, I. lanceifolia by the frequency and O. catharinensis and Miconia sp. were distinguished by their elevated dominance.
Rarefaction curves for physiognomies did not show striking differences in the species richness among physiognomies. However, in general, species number expected was highest for HF, intermediate
for VF and smallest for RF (figure 1). Similarly, H'
values decreased in the same way (3.54 nats ind-1 in HF, 3.42 nats ind-1 in VF and 3.0 nats ind-1 in
RF). J values indicate similar equability in species distribution in VF (0.82) and HF (0.81) and lower equability in RF (0.74). Less diversity indicated by the results found for RF must be in part due to the abundance of representatives of Cyatheaceae in this physiognomy, especially Alsophila sternbergii, the species with the highest VI and whose representatives occur most frequently in large clumps.
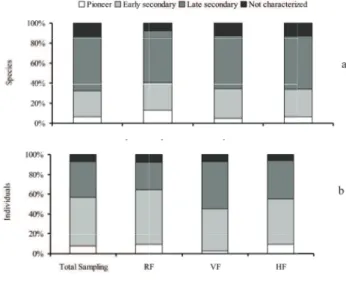
The classification of species in the study area
in successional groups showed the presence of eight pioneer species, 31 early secondary species, 64 late secondary species and 16 species not characterized
(figure 2a) for the total sampling. When considering
the number of individuals per successional group, however, proportions are different, with the majority
of living individuals being classified as early secondary (figure 2b). A similar situation is observed regarding
physiognomies RF and HF. VF, in turn, was the only
area in which the number of individuals classified as
late secondary was higher than that of individuals of initial secondary species.
In fact, proportions of individuals per group
found in physiognomies were significantly different
(X2 = 35.8, g.l. = 6, α = 1%). Residual analyses (z 0.01) revealed that in RF, the number of early secondary
trees was significantly higher than expected while the
number of species in the late secondary category was lower than expected. In VF, on the other hand, late secondary trees were more abundant than expected while there were fewer pioneers than expected.
there are many controversies in literature regarding the
classifi cation of many species (Catharino et al. 2006). Thus, it could lead to incorrect conclusions about successional stage in a given area. Given the large number of late secondary species in total sampling, it could be deduced that Casa de Pedra streamlet's basin forest is in an advanced stage of succession. However, considering the large number of individuals in the group of early secondary trees, together with the presence of species considered typical of highly disturbed environments, such as Vernonia discolor,
Alchornea triplinervia, Casearia decandra and
Hyeronima alchorneoides (Lorenzi 2002a, b), it could
be suggested that the area is in an initial stage in succession. More studies with different populations in the area are necessary and would allow more precise conclusions about successional category of species and successional stage of the forest.
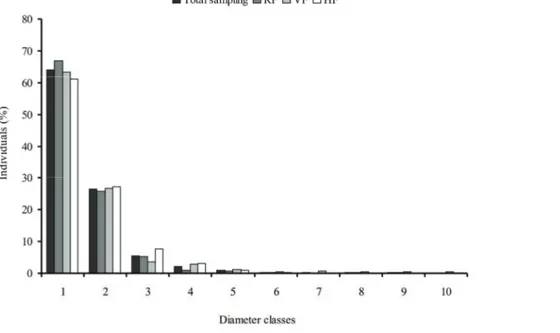
Diameter and height distribution - The distribution of individuals' frequency per class of diameter presented, both for the total sampling and each area of study, a pattern similar to that called "inverted J", i.e. high concentration of individuals in lower classes and a
marked reduction towards the higher classes (fi gure 3).
The first and smallest class (DBH up to 13 cm) comprises about 64% of the total individuals sampled. This value is similar to those found for physiognomies RF, VF and HF, which totalized, respectively, 66%, 63% and 61% of the individuals. The second class of diameter, in turn, comprised 26% of all individuals sampled, 25% of RF individuals, 26% of VF and 27% of HF. The other classes include the remaining 10% of all individuals, 9% of RF, 11% of VF and 12% of HF.
Mean diameter found for total sampling was Figure 1. Sample-based rarefaction curves for physiognomies studied at Núcleo Santa Virgínia, Parque Estadual da Serra do Mar, São Paulo, Brazil.
Figure 2. Proportion (%) of species (a) and individuals (b) in different successional groups in total sampling and in each physiognomy studied at Núcleo Santa Virgínia, Parque Estadual da Serra do Mar, São Paulo, Brazil.
large number of early secondary species such as
Alsophila sternbergii, Euterpe edulis and Bathysa
stipulata. Moreover, in that physiognomy, many
late secondary species are represented by only one or few individuals, leading to an elevated number of species falling into this category, but to a low number of individuals. On the other hand, the results found for VF could be explained by the presence of a large number of late secondary species, some with numerous trees in the area, such as Ocotea dispersa, for example.
14.2 cm, and the highest values were from individuals
of Campomanesia guaviroba, Coussapoa microcarpa,
Ocotea dispersa, Micropholis crassipedicelata,
Vernonia discolor and Cryptocarya mandioccana,
in this order, all with DBH > 90 cm. When analyzed individually, the mean diameter of each physiognomy was also similar to that found for total sampling: 13.6 cm in RF, 14.8 cm in VF and 14.4 cm in HF. These
values were not signifi cantly different (Kruskal-Wallis test, H = 0.46, g.l. = 2, α = 5%). In RF, the tree with
the largest diameter was an Ocotea dispersa, in FV
a Campomanesia guaviroba and in HF an Alchornea
triplinervia was the largest tree.
Most inventories of communities of trees and shrubs in tropical forests with variable age and species composition show the distribution of diameter similar to the one presented in this study, following inverted J model. This could be interpreted as a situation of stability and auto regeneration (Scolforo et al. 1998).
The large number of individuals in the fi rst diameter
class indicates a community stock, a recruitment of individuals in forest. This interpretation is based on the idea that trees grow with age (Oliver & Larson 1996), and diameter distribution is the age distribution of a community. Indeed, histograms give a very good general idea about the state of regeneration in a given forest. However, to make a more precise and detailed assessment of the regenerative capacity of a community, studies of populations are necessary, since
thin trees are not necessarily younger than the more
robust ones in multispecifi c forests. In the present
study, another possible reason for the pattern found could be the criterion for inclusion applied, which allowed sampling a large number of small individuals.
Distribution of individuals by height classes
(fi gure 4) revealed a low overall height for all sampled
physiognomies and a poorly developed vertical structure. Ogata & Gomes (2006) also observed these characteristics in a forest in the city of Cotia, in São Paulo, and emphasized that the short stature of individuals had also been addressed in other studies in forests of the Atlantic Plateau.
The classes of height 3 to 6 (4 to 11.9 m) comprised 70% of individuals in total sampling and corresponded to medium stratum. Approximately 22% of all individuals of the study area fell into the class 4 of height (6 to 7.9 m). This class also presented the majority of trees in RF (25% of the individuals sampled in this area) and in VF (23% of the individuals). HF, in turn, presented a larger number of trees (about 24%) in class 3 (4 to 5.9 m). The mean height of all physiognomies was around 8.1 m.
Ten out of the 13 most abundant species of the total sampling (20 individuals or more) presented less
than 10 m of mean height (fi gure 5), confi rming the
short stature found in the tree component studied. The highest individuals in total sampling were of Ocotea
glaziovii, Ocotea dispersa, Cabralea canjerana,
Eugenia sp. 1, Tibouchina pulchra, Cryptocarya
moschata and Pterocarpus rohrii, in this order, all
over 18 m (10 to 15 classes). The highest individual found in RF was a tree of Ocotea glaziovii (28 m), in VF a Coussapoa microcarpa (22 m) and in HF a
Myrcia pubipetala (20 m).
Among the small proportion of individuals sampled in the classes of greatest heights, some species were distinguished: all the representatives of
Cryptocarya mandioccana (seven individuals) and
Coussapoa microcarpa (four individuals) showed
height between 14 and 20 m; all the representatives
of Ocotea catharinensis (six individuals) and
Cedrela fissilis (four individuals) also showed
elevated height, ranging between 10 and 20 m. These species can be considered as components of the canopy of the studied area, with some emerging individuals. Moreover, species like Cyathea delgadii
(seven individuals) and Psychotria nemorosa (fi ve
individuals) appear to be typical of sub grove of the area, as all of them showed trees of 2 to 5.5 m of height. These observations, along with the results found for the distribution of diameter, should be considered with caution as studies at population level are required to achieve more precise and detailed conclusions about the stratification of the area. Biomass - Aboveground living biomass found for total sampling was 135.27 mg, equivalent to 225.45 mg ha-1. Figure 5. Maximum, minimum and mean heights observed for the most abundant species (n ≥ 20 individuals) in total area studied at Núcleo Santa Virgínia, Parque Estadual da Serra do Mar, São Paulo, Brazil.
The main component of the value obtained came from the trees, which accounted for 93.8%, followed
by palms, accounting for 4% and finally the ferns,
responsible for 2.2% of the total (table 3). Regarding the contribution of physiognomies, VF was the main contributor with about 44.3% of the total, followed by RF, which accounted for 28.6%. At last, HF contributed with the remaining 27.1%. The high value found for VF is the result of the presence of very large sized trees in this area. The largest individual of the sampling was located on a plot from VF, a
Campomanesia guaviroba tree with dimensions DBH
117.8 cm and height estimated at 20 m. These large dimensions associated to the high wood density of that species (0.83 g cm-3, approximately) resulted in a large individual biomass (12.39 mg), which corresponded to 20.6% of the total found for the physiognomy.
Trees were also the main component accounting for biomass values in the three areas studied. In VF and HF, palms showed the second greatest contribution, while in RF there were ferns (table 3). This difference in the contribution of pteridophytes to biomass content in physiognomies is due to the high density of that group in RF (36.8% of living individuals found there).
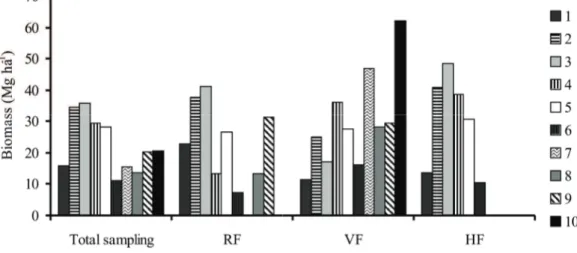
Biomass distribution in diameter classes established previously for total sampling and
physiognomies (figure 6) showed that individuals of
large size, with DBH more than 50 cm (classes 5 to 10), make together 48.7% of total biomass calculated for total sampling, in spite of being just 2% of the total number of living individuals. In RF, VF and HF the percentages for these classes totalized 40.5%, 70.1% and 22.4% respectively. In contrast, even though the
first diameter class (DBH up to 13 cm), comprised
over 60% of the individuals of both total sampling and physiognomies, it accounted for just 7.1% of the total sampling biomass, 11.8% of RF, 3.8% of VF and 7.4% of HF. A similar observation was stated by Vieira et al. (2004), who found that trees with diameter between 10 and 29.9 cm corresponded to approximately 80% of individuals sampled in three forest areas in Central Amazonia, but contributed with just 26.4% to 32.9% of total biomass estimate.
The species that showed the highest biomass values throughout the total sampling were Alchornea
triplinervia (24.1 mg ha-1), Campomanesia
guaviroba (21.9 mg ha-1) and Coussapoa microcarpa
(20.5 mg ha-1). Regarding the physiognomies individually, the species with larger biomass were
Ocotea dispersa (34 mg ha-1), Cabralea canjerana
(21.8 mg ha-1) and Alchornea triplinervia (18.2 mg ha-1) in RF, Campomanesia guaviroba (62 mg ha-1),
Coussapoa microcarpa (60.5 mg ha-1) and Micropholis
crassipedicelata (51 mg ha-1) in VF, and Alchornea
triplinervia (37 mg ha-1), Miconia sp. (15 mg ha-1) and Myrtaceae sp. (14.5 mg ha-1) in HF. All these species have large-sized individuals, crucial factor in their highlight. It is worth noting that height estimates used for calculating the biomass of individuals were obtained by visual method. These estimates were very close to real for individuals of smaller stature. But for large individuals, the probability of errors increases. This may have caused deviations in values reported for biomass of species that showed very large individuals.
Biomass values estimates for the studied forest is close to values obtained in other studies conducted in Atlantic forest areas. Tiepolo et al. (2002) calculated 271.78 mg ha-1 of biomass in a submontane forest in Paraná. Burger (2005) calculated 245 mg ha-1 in the same forest type in a fragment located near the city of Santos, São Paulo, and Alves et al. (2010) found a total of 283.2 mg ha-1 in an area close to the one of the present study, but in an analysis of broader geographic scale. Considering that approximately 50% of biomass corresponds to the amount of carbon (Nascimento & Laurance 2002), the stocks found in the present and in the studies mentioned above are approximately 112.7 mg ha-1, 135.89 mg ha-1, 122.5 mg ha-1 and 141.6 mg ha-1, respectively.
Estimated aboveground living biomass in the present work concerns only the tree component of the study area. However, other components such as lianas,
epiphytes, and bamboo can contribute significantly to
total value of a forest (Alves et al. 2010). These life forms, along with palms and ferns, can account for 10% of Atlantic forests biomass (Vieira et al. 2008). Nevertheless, the biomass distribution among its different components in tropical forests is still poorly understood (Sarmiento et al. 2005) and allometric models are scarce, especially with regarding the “non-tree” components. To assess total biomass content of a given forest, we must also take into account the dead individuals and underground biomass.
However, it is good to emphasize the importance of working with other new approaches to get a deeper comprehension of structure and functioning of endangered vegetation such as the Atlantic forest.
Acknowledgements
The authors would like to acknowledge the
Conselho Nacional de Desenvolvimento Científi co e
Tecnológico (CNPq) for the master degree scholarship
awarded to fi rst author; the Fundação de Amparo
à Pesquisa do Estado de São Paulo (FAPESP) for
the funding for the projects "Composição fl orística,
estrutura e funcionamento da Floresta Ombrófila Densa dos Núcleos Picinguaba e Santa Virgínia do Parque Estadual da Serra do Mar" (Process number 03/12595-7), under coordination of Dr. Carlos Alfredo Joly (IB / UNICAMP) and "O balanço de carbono sobre uma fl oresta de Mata Atlântica com medidas
micrometeorológicas e biométricas" (07/57465-4), under the coordination of Dr. Humberto Ribeiro da Rocha (IAG / USP); all colleagues who helped
in fi eld work and to Dr. Simone Aparecida Vieira
(CENA / USP) for assistance with data spreadsheets and biomass calculation.
Literature cited
Aidar, M.P.M., Godoy, J.R.L., Bergmann, J. & Joly, C.A.
2001. Atlantic forest succession over calcareous soil, Parque Estadual Turístico do Alto Ribeira – PETAR, SP. Revista Brasileira de Botânica 24: 455-469.
Alves, L.F. & Metzger, J.P. 2006. A regeneração fl orestal
em áreas de fl oresta secundária na Reserva Florestal do Morro Grande, Cotia, SP. Biota Neotropica 6. Available at http://www.biotaneotropica.org. b r / v 6 n 2 / p t / a b s t r a c t ? a r t i c l e + b n 0 0 4 0 6 0 2 2 0 0 6 . (access in 01.11.2008)
Table 3. Density and biomass of trees, palms and tree ferns in each of three studied physiognomies and in total sampling realized at Núcleo Santa Virgínia, Parque Estadual da Serra do Mar, São Paulo, Brazil. RF: Riparian forest; VF: Valley forest; HF: Hill forest.
Density (ind ha-1) Biomass (mg ha-1) / (%)
Area Trees Palms Ferns Trees Palms Ferns Total
RF 1185 150 785 174.35 90 6.55 3.5 12.7 6.5 193.6
VF 970 235 100 288.5 96.2 10.45 3.5 0.9 0.3 299.85
HF 1115 245 220 171.45 93.7 10.1 5.6 1.35 0.7 182.9
Total sampling 1091 208 368 211.4 93.8 9.03 4 4.98 2.2 225.45
Alves, L.F., Vieira, S.A., Scaranello, M.A., Camargo, P.B., Santos, F.A.M., Joly, C.A. & Martinelli, L.A.
2010. Forest structure and live aboveground biomass variation along an elevational gradient of tropical Atlantic moist forest (Brazil). Forest Ecology and Management 260: 679-691.
APG III. 2009. An update of the Angiosperm Phylogeny Group classification for the orders and families of flowering plants: APG III. Botanical Journal of the Linnean Society 161: 105–121.
Araújo, T.M., Higuchi, N. & Carvalho Junior, J.A.
1999. Comparison of formulae for biomass content determination in a tropical rain forest site in the State of Pará, Brazil. Forest Ecology and Management 117: 43-52.
Ayres, M., Ayres, J.R.M. & Ayres, D.L. 2007. BioEstat 5.0: aplicações estatísticas nas áreas das ciências biológicas e médicas. Sociedade Civil Mamirauá, Belém.
Burger, D.M. 2005. Modelos alométricos para a estimativa da fitomassa de Mata Atlântica na Serra do Mar, SP. Ph.D. thesis, Universidade de São Paulo, São Paulo.
Callegari-Jacques, S.M. 2003. Bioestatística: princípios e aplicações. Artmed, Porto Alegre.
Catharino, E.L., Bernacci, L.C., Franco, G.A.D.C., Durigan, G. & Metzger, J.P. 2006. Aspectos da composição e diversidade do componente arbóreo das florestas da Reserva Florestal do Morro Grande, Cotia, SP. Biota Neotropica 6. Available at http://www.biotaneotropica.org.br/v6n2/pt/ abstract?article+bn00306022006. (access in 01.11.2008)
Chave, J., Andalo, C., Brown, S., Cairns, M., Chambers, J.C., Eamus, D., Fölster, H., Fromard, F., Higuchi, N., Kira, T., Lescure, J., Nelson, B.W., Ogawa, H., Puig, H., Riéra, B. & Yamakura, T. 2005. Tree allometry and improved estimation of carbon stocks and balance in tropical forests. Oecologia 145: 87-99.
Chave, J., Muller-Landau, H.C., Baker, T.R., Easdale, T.A., Ter Steege, H. & Webb, C.O. 2006. Regional and phylogenetic variation of wood density across 2456 neotropical tree species. Ecological Applications 16: 2356-2367.
Cole, T.C. & Ewel, J.J. 2006. Allometric equations for four valuable tropical tree species. Forest Ecology and Management 229: 351-360.
Colwell, R.K. 2009. EstimateS: Statistical estimation of species richness and shared species from samples. Version 8.2. Available at http://purl.oclc.org/estimates.
Dias, A.T.C., Mattos, E.A., Vieira, S.A., Azeredo, J.V. & Scarano, F.R. 2006. Aboveground biomass stock of native woodland on a Brazilian sandy coastal plain: Estimates based on the dominant tree species. Forest Ecology and Management 226: 364-367.
França, G.S. & Stehmann, J.R. 2004. Composição florística e estrutura do componente arbóreo de uma floresta altimontana no município de Camanducaia, Minas Gerais, Brasil. Revista Brasileira de Botânica 27: 19-30.
Fundação S.O.S. Mata Atlântica & INPE. 2008. Atlas dos remanescentes florestais da Mata Atlântica. Período 2000 a 2005. Fundação S.O.S. Mata Atlântica e Instituto Nacional de Pesquisas Espaciais, São Paulo.
Galindo, L. & Câmara, I.G. 2005. Mata Atlântica: Biodiversidade, Ameaças e Perspectivas. Fundação S.O.S. Mata Atlântica e Conservation International, São Paulo.
Gandolfi, S., Leitão Filho, H. & Bezerra, C.L.F. 1995.
Levantamento Florístico e caráter sucessional das espécies arbustivo-arbóreas de uma Floresta Mesófila Semidecídua no município de Guarulhos, SP. Revista Brasileira de Biologia 55: 753-767.
Gentry, A.H. 1995. Patterns of diversity and floristic
composition in neotropical montane forests. In: S.P. Churchill, H. Balslev, E. Forero & J.L. Luteyn (eds.). Biodiversity and conservation of Neotropical montane forests. The New York Botanical Garden, New York.
Gomes, E.P.C., Fish, S.T. & Mantovani, W. 2005. Estrutura e composição do componente arbóreo na Reserva Ecológica do Trabiju, Pindamonhangaba, SP, Brasil. Acta Botanica Brasilica 19: 451-464.
Gonçalves, C.N. & Waechter, J.L. 2003. Aspectos florísticos e ecológicos de epífitos vasculares sobre figueiras isoladas no norte da planície costeira do Rio Grande do Sul. Acta Botanica Brasilica 17: 89-100.
Gotelli, N. & Colwell, R.K. 2001. Quantifying biodiversity: Procedures and pitfalls in the measurement and comparison of species richness. Ecology Letters 4: 379-91.
Guilherme, F.A.G., Morellato, L.P.C. & Assis, M.A.
2004. Horizontal and vertical tree community structure in a lowland Atlantic Rain Forest, Southeastern Brazil. Revista Brasileira de Botânica 27: 725-737.
Houghton, R.A., Lawrence, K.L., Hackler, J.L. & Brown, S. 2001. The spatial distribution of forest biomass in the Brazilian Amazon: a comparison of estimates. Global Change Biology 7: 731-746.
Instituto Florestal do Estado de São Paulo. 2006. Plano de manejo do Parque Estadual da Serra do Mar. Available at http://www.iflorestal.sp.gov.br/Plano_de_manejo/ PE_SERRA_MAR/ index.asp. (access in 01.11.2008)
Ivanauskas, N.M., Rodrigues, R.R. & Nave, A.G.
1999. Fitossociologia de um trecho de Floresta Estacional Semidecidual em Itatinga, São Paulo, Brasil. Scientia Florestalis 56: 83-99.
Keller, M., Pallace, M. & Hurtt, G. 2001. Biomass estimation in the Tapajos National Forest, Brazil: examination of sampling and allometric uncertainties. Forest Ecology and Management 154: 371-382.
Lorenzi, H. 2002a. Árvores brasileiras: manual de identificação e cultivo de plantas arbóreas nativas do Brasil. v.1. Instituto Plantarum, Nova Odessa.
Lorenzi, H. 2002b. Árvores brasileiras: manual de identificação e cultivo de plantas arbóreas nativas do Brasil. v.2. Instituto Plantarum, Nova Odessa.
Malhi, Y. & Grace, J. 2000. Tropical forests and atmospheric carbon dioxide. Trends in Ecology & Evolution 15: 332-337.
Martins, S.E., Rossi, L., Sampaio, P.S.P. & Magenta, M.A.G. 2008. Caracterização florística de comunidades
vegetais de restinga em Bertioga, SP, Brasil. Acta Botanica Brasilica 22: 249-274.
Melo, M.M.R.F. & Mantovani, W. 1994. Composição florística e estrutura de trecho de Mata Atlântica de encosta, na Ilha do Cardoso (Cananéia, SP, Brasil). Boletim do Instituto de Botânica 9: 107-158.
Mueller-Dombois, D. & Ellenberg, H. 1974. Aims and methods of vegetation ecology. John Wiley & Sons, New York.
Nascimento, H.E.M. & Laurence, W.F. 2002. Total aboveground biomass in central Amazonian rainforests: a landscape-scale study. Forest Ecology and Management 168: 311-321.
Oliver, C.D. & Larson, B.C. 1996. Forest stand dynamics. John Wiley & Sons, New York.
Ogata, H. & Gomes, E.P.C. 2006. Estrutura e composição da vegetação no Parque CEMUCAM, Cotia, SP. Hoehnea 33: 371-384.
Pielou, E.C. 1975. Ecological diversity. John Wiley & Sons, New York.
Radambrasil. 1983. Projeto Radambrasil: levantamento de recursos naturais. Instituto Brasileiro de Geografia e Estatística, Rio de Janeiro.
Reis, A. & Kageyama, P.Y. 2000. Dispersão de sementes do palmiteiro (Euterpe edulis Martius – Palmae). In: M.S. Reis & A. Reis (eds.). Euterpe edulis Martius – palmiteiro: biologia, conservação e manejo. Herbário Barbosa Rodrigues, Itajaí.
Salis, S.M., Assis, M.A., Mattos, P.P. & Pião, A.C.S. 2006. Estimating the aboveground biomass and wood volume of savanna woodlands in Brazil's Pantanal wetlands based on allometric correlations. Forest Ecology and Management 228: 61-68.
Sanchez, M., Pedroni, F., Leitão Filho, H.F. & César, O. 1999. Composição florística de um trecho
de floresta ripária na Mata Atlântica em Picinguaba, Ubatuba, SP. Revista Brasileira de Botânica 22: 31-42.
Sanqueta, C.R. (org.) 2008. Experiências de monitoramento no Bioma Mata Atlântica com uso de parcelas permanentes. Rede de Parcelas Permanentes dos Biomas Mata Atlântica e Pampa, Curitiba.
São Paulo. 1972. Atlas pluviométrico do Estado de São Paulo. Secretaria de Serviços e Obras Públicas, São Paulo.
Sarmiento, G., Pinillos, M. & Garay, I. 2005. Biomass variability in tropical American lowland rainforest. Ecotropicos 18: 1-20.
Scolforo, J.R.S., Pulz, F.A. & Melo, J.M. 1998. Modelagem da produção, idade das florestas nativas, distribuição espacial das espécies e a análise estrutural. In: J.R.S. Scolforo (org.). Manejo Florestal. Universidade Federal de Lavras, Fundação de Apoio ao Ensino, Pesquisa e Extensão, Lavras.
Scudeller, V.V., Martins, F.R. & Shepherd, G.J. 2001. Distribution and abundance of arboreal species in the atlantic ombrophilous dense forest in Southeastern Brazil. Plant Ecology 152: 185-199.
Setzer, J. 1966. Atlas climático e ecológico do Estado de São Paulo. Comissão Interestadual da Bacia Paraná-Uruguai, São Paulo.
Sztutman, M. & Rodrigues, R.R. 2002. O mosaico vegetacional numa área de floresta contínua da planície litorânea, Parque Estadual da Campina do Encantado, Pariquera-Açu, SP. Revista Brasileira de Botânica 25: 161-176.
Tabarelli, M. & Mantovani, W. 1999. A regeneração de uma floresta tropical montana após corte e queima (São Paulo-Brasil). Revista Brasileira de Biologia 59: 239-250.
Tiepolo, G., Calmon, M. & Feretti, A.R. 2002. Measuring and monitoring carbon stocks at the Guaraqueçaba climate action project, Paraná, Brazil. In: K. Lin & J. Lin (eds.) International Symposium on Forest Carbon Sequestration and Monitoring. Extension Series Taiwan Forestry Research Institute 153: 98-115.
Tryon, R.M. & Tryon, A.F. 1982. Ferns and allied plants, with special reference to tropical America. Springer Verlag, New York.
Veloso, H.P., Rangel Filho, A.L.R. & Lima, J.C. 1991. Classificação da vegetação brasileira adaptada a um sistema universal. Instituto Brasileiro de Geografia e Estatística, Rio de Janeiro.
Vieira, S., De Camargo, P.B., Selhorst, D., Da Silva, R., Hutyra, L., Chambers, J.Q., Brown, I.F., Higuchi, N., Dos Santos, J., Wofsy, S.C., Trumbore, S.E. & Martinelli, L.A. 2004. Forest structure and carbon dynamics in Amazonian tropical rain forest. Oecologia 140: 468-479.
Vieira, S.A., Alves, L.F., Aidar, M.P.M., Araújo, L.S., Baker, T., Batista, J.L.F., Campos, M.C., Camargo, P.B., Chave, J., Delitti, W.B.C., Higuchi, N., Honorio, E., Joly, C.A., Keller, M., Martinelli, L.A., Mattos, E.A., Metzker, T., Phillips, O., Santos, F.A.M., Shimabukuro, M.T., Silveira, M. & Trumbore, S.E. 2008. Estimation of biomass and carbon stocks: the case of the Atlantic Forest. Biota Neotropica 8. Available at http://www.biotaneotropica.org.br/ v8n2/en/abstract?point-of-view+bn00108022008. (access in 01.11.2008)