SPATIAL ANALYSIS OF SUICIDE ATTACK INCIDENCES IN
KABUL CITY
SPATIAL ANALYSIS OF SUICIDE ATTACK INCIDENCES IN
KABUL CITY
Dissertation
Supervised by
Prof. Dr. Edzer J. Pebesma
Institute for Geoinformatics (IFGI)
Westfälische Wilhelms-Universität
Münster – Germany
Co-supervised by
Ismael Sanz, Ph.D
Department of Mathematics
Universitat Jaime I
Castellon – Spain
Ana Cristina Marinho da Costa, Ph.D
Instituto Superior de Estatística e Gestão de Informação
Universidade Nova de Lisboa
Authors Declaration
I hereby declare that this Master thesis has been written independently by me, solely
based on the specified literature and resources. All ideas that have been adopted
directly or indirectly from other works are denoted appropriately. The thesis has not
been submitted for any other examination purposes in its present or a similar form and
was not yet published in any other way.
Signature :...
To
my uncle
Mohammad Monjurul Haque
and
ACKNOWLEDGMENTS
First of all I would like to give all credits to almighty Allah (The GOD) for allowing
me to write this paper by saving from the suicide attack that occurred on 13th March
2008 at 8.05am, near Kabul Airport, only 15meter away from my car and just
30secounds after passing that incident point. The incident wonders me always to think
why I was 30 seconds ahead of the time of that incident? I wish we could
scientifically prove “there is a special purpose of every event on earth and that
happens at a particular place on a particular time – in a 4 dimensional time-space”.
My gratitude goes to Erasmus Mundus Committee for funding my study and giving
me this opportunity to experience on European people, culture, emotions, kindness
and of course a considerable knowledge.
My special thanks for to my supervisors, who have taken special care, considered my
limitations and provided valuable guideline to do a scientific research on this sensitive
issue. Thanks to Dr. Christoph Brox for extending his soft hand to solve all the
difficulty I personally faced during my study.
David Lord, my team leader, a great friend, who was the person, sent by the GOD
with special grace to promote me in a new world, contributed to my full professional
career. Thanks to all colleagues of Kabul Urban Reconstruction Project, specially Mr.
Abdul Ahad Wahid, Mr. Ghulam Rasul Nawabi, Sayed Mahmood, Khaled Barakjai,
Rohullah, Dragica Veselinovic, Ken Jossy for their great cooperation and support for
a memorable lifetime working experience in Kabul. Gratitude goes to the drivers
Waheed, Shafiq and Munir for saving my life and helping experiencing about real
afghan lifestyle and knowing people by taking me in every corners of Kabul City in
spite of high risk and security restrictions.
Thanks to all my friends Shiuli Pervin, Anisur Rahman, Dipak Chandra Shaha, Bayes
Ahmed, Diyan, Zahid Vi, Raju vi, Shemon Vi, Malumbo, Emad and all other
co-students of this programme for their great accompany, support and suggestions.
My daughter Ridhwaana al Mahjabeen who made me understand the meaning,
purpose and value of life on earth and made me dream for her a wonderful normal
life. At last my deep condolence for all the victims of the suicide attack incidents and
ABSTRACT
In the last two decades, suicide bombings became quite common among some
communities in Iraq, Afghanistan, Pakistan, India, USA, and a few African and
European countries. The modeling of reported suicide bombings has been the subject
of a few studies, but the pattern of incidents turned out to be difficult to assess.
Nevertheless, to uncover the bombing patterns in past incident locations is of major
importance because it can improve social security and save human lives. The Capital
city of Afghanistan, Kabul, has experienced on average around one suicide attack in
every month since 2001. The overall objective of this study is to characterize the
spatial and temporal patterns of suicide attacks in Kabul City.
This research primarily used last 5 years descriptive spatial information on suicide
attacks in Kabul that brought to public by some local and international news paper to
generate geographic point data. Suicide attack location points and potential target
group establishment point’s data analyzed separately to explore inherent spatial point
pattern in terms of intensity and interaction. Finally it analyzed spatial tendency
between suicide attack location points on target group establishment locations.
It has been explored that both suicide attack locations that occurred from year 2006 to
2010 within the urban habitat of Kabul and target group’s establishment locations are
characterized by inhomogeneous intensity and clustered interaction pattern at 98%
level of significance. Moreover, there is a tendency of choosing location for suicide
attacks close to target group’s establishment location. Finally some interesting
KEYWORDS
GIS Applications
Spatial Analysis
Spatial Point Pattern
Multitype Point Pattern
Spatial Reasoning
Suicide Attack
Suicide Improvised Explosive Device
ACRONYMS
AIMS – Afghanistan Information Management Services
ANA – Afghan National Army
ANP – Afghan National Police
ANSF – Afghan National Security Forces
ANSO – Afghan NGO Safety Office
BBIED – (Suicide) Body Borne Improvised Explosive Device
CP – Checkpoint
HQ – Headquarter
IFGI – Institute for Geoinformatics
IM (F) – International Military (Force)
INGO – International Non-government organization
INKI – Insurgents Killed by the Incident
INWI – Insurgents Wounded by the Incident
ISAF – International Security Assistance Force
ISEGI – Instituto Superior de Estatística e Gestão de Informação
OPKI – Other People killed by the Incident
OPWI – Other People Wounded by the Incident
PBIED – Person Born Improvised Explosive Device
R – Software R
SALP – Suicide Attack Location Point
SPATSTAT – An R Package for Analyzing Spatial Point Patterns
TGEP – Target Group Establishment Point
TPKI – Target People Killed by the Incident
TPWI – Target People Wounded by the Incident
UJI – Universitat Jaume I
INDEX OF THE TEXT
Page.
AUTHORS DECLARATION ...III
ACKNOWLEDGMENTS ... V
ABSTRACT ... VI
KEYWORDS ...VII
ACRONYMS ... VIII
INDEX OF TABLES ... XI
INDEX OF FIGURES ... XII
CHAPTER 1: INTRODUCTION ... 1
1.1 BACKGROUND AND MOTIVATION ... 1
1.2 OBJECTIVES ... 4
1.3 RESEARCH QUESTIONS ... 4
1.4 STUDY AREA ... 5
1.4.1 Location and Extent of Kabul City ... 5
1.4.2 History and Importance ... 6
1.4.3 Physical Environment ... 6
1.4.4 Urban form and Land Use ... 8
1.4.5 Transport network ... 9
1.4.6 Socio‐economic Environment ... 10
1.4.7 Present Conflict and Threat ... 10
1.4.8 Study Window ... 12
1.5 THESIS OUTLINE ... 12
CHAPTER 2: DATA DESCRIPTION ... 13
2.1 INTRODUCTION ... 13
2.2 THE BASE MAP: BASIC GIS FEATURE CLASSES... 13
2.3 SUICIDE ATTACK LOCATION POINTS (SALP) ... 16
2.3.1 Data Sources and Formats ... 16
2.3.2 Data Categorization ... 17
2.3.3 Extraction of Spatial Information ... 18
2.3.4 Suicide Attack Database ... 19
2.4 TARGET GROUP ESTABLISHMENT POINTS (TGEP) ... 21
CHAPTER 3: METHODOLOGY ... 22
3.1 GEOCODING SUICIDE ATTACK LOCATION POINTS ... 22
3.1.1 Spatial Reasoning ... 22
3.1.2 Data Accuracy ... 23
3.2 DATA CONVERSION AND PROCESSING ... 25
3.2.1 Create Observation Window from polygon shapefile ... 25
3.2.2 Convert SALP data to SPATSTAT ... 25
3.2.3 Converting TGEP data to SPATSTAT ... 27
3.3 SPATIAL POINT PATTERN ANALYSIS ... 27
3.3.1 Estimates of Spatial Pattern ... 27
3.3.2 Analysis of Covariate Effects ... 28
3.4 JUSTIFICATION OF ACCURACY IMPACT ... 28
CHAPTER 4: RESULTS AND DISCUSSION ... 29
4.1 INTRODUCTION ... 29
4.2 ANALYSIS OF SUICIDE ATTACK LOCATION POINTS (SALP) ... 29
4.2.1 Investigation of Intensity ... 29
4.2.2 Investigation of Interaction ... 31
4.3.1 Investigation of Intensity ... 34
4.3.2 Investigation of Interaction ... 36
4.4 INVESTIGATION OF THE RELATIONSHIP BETWEEN SAP AND TGEP ... 40
4.4.1 Creating dataset and Inspecting General Pattern ... 40
4.4.2 Test of Intensity ... 40
4.4.3 Test of Interaction ... 42
4.4.4 Exploration of Correlation ... 45
4.4.5 Summary of the Point Pattern Analysis ... 46
4.5 OVERALL SUICIDE ATTACK SCENARIOS IN KABUL ... 47
4.5.1 Who are the targets ... 47
4.5.2 How many suicide attacks happen in a month or a year ... 48
4.5.3 Where the suicide attack happens ... 50
CHAPTER 5: CONCLUSION AND FUTURE WORK ... 55
5.1 CONCLUSION ... 55
5.2 RECOMMENDATION ... 56
References 57 ANNEX I 59 ANNEX II 82
INDEX OF TABLES
Table 1: List of GIS Feature Data of the Study 13
Table 2: Result of Envelop over K Function for SALP 31
Table 3: Result of Envelop over G Function 33
Table 4: Result of Envelop over K Function for TGEP 36
Table 5: Result of Envelop over G Function for TGEP data 38
INDEX OF FIGURES
Figure 1: Statistics of the declining support for suicide bombing ... 2
Figure 2: A police bus, which was completely destroyed, 35 people killed and more than 30 people injured by a suicide attack in Kabul ... 3
Figure 3: People searching victims after a suicide attack struck the heavily guarded Wazir Akbar Khan neighborhood in Kabul. ... 3
Figure 4: Location of the study area; ... 5
Figure 5: Aerial View of Kabul Topography ... 6
Figure 6: Mean monthly temperature (variation border) and precipitation in Kabul (period 1956‐ 1983) 7 Figure 7: Informal housing at mountain slopes (Left side is TV Hill and Right side in Tiger Hill) .... 9
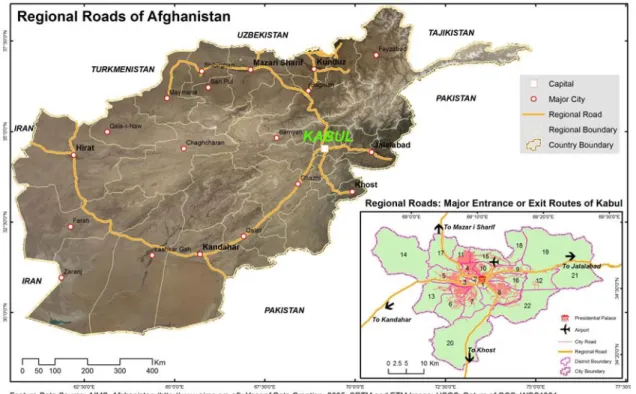
Figure 8: Four regional roads spread out from Kabul ... 10
Figure 9: Civilian casualties and kidnappings from January to November 2008 ... 11
Figure 10: Location of Government and International Establishments within Study Area Extent of Kabul City ... 15
Figure 11: Suicide Attack news published in Pajhwok Afghan News on 27.11.2008 ... 19
Figure 12: A database form showing extracted information on Suicide Attack of 27.11.2008 .... 21
Figure 13: Method of data extraction and geocoding ... 22
Figure 14: Major Suicide Attack Locations Occurred in Kabul City from 2006 to 2010. ... 24
Figure 15: Suicide Attack Location Points in the automatic data extent window ... 26
Figure 16: Suicide Attack Location Points in the City Habitat Window ... 26
Figure 17: A sample of uniform and inhomogeneous point pattern ... 27
Figure 18: A sample of different types of interaction pattern ... 28
Figure 19: Intensity of suicide attack incident by 6x x 3y quadrates of the Kabul City ... 30
Figure 20: Graduated color plot (left) and perspective view (right) of Kernel density of suicide attack location points in Kabul City with sigma = 2km ... 30
Figure 21: Envelope for pairwise distances and the K function for SALP data ... 32
Figure 22: Envelope for G function test of SALP ... 33
Figure 23: Intensity of target group establishments by 6 x 3 quadrates within the study window 35 Figure 24: Graduate color plot and perspective plot of Kernel density of Target Group Establishment Point (TGEP) in Kabul City with sigma = 2km ... 35
Figure 25: Envelope for pairwise distances and the K function for TGEP data ... 37
Figure 26: Envelope for G function test of TGEP ... 39
Figure 27: Simple plot of Suicide Attack Location Points and Target Group Establishment Point in SPATSTAT (the distance unit is Kilometer) ... 40
Figure 28: Suicide Attack locations are placed beside Government and international Target locations ... 41
Figure 29: Comparative Intensity pattern of SALP and TGEP (distance unit is kilometer) ... 42
Figure 30: G function of distances from TGEP to SALP ... 43
Figure 31: K function of distances from TGEP to SALP ... 44
Figure 32: Realization of mark correlation function between SALP and TGEP ... 46
Figure 33: Number of attack by target group ... 48
Figure 34: Monthly Distribution of Suicide Attacks of years from 2006 to 2010 ... 49
Figure 35: Daily Distribution of Suicide attacks occurred in Kabul with respect of months of years from 2006 to 2010 ... 49
CHAPTER 1: INTRODUCTION
1.1
Background and Motivation
A suicide attack is a pre-planned attempt from a suspicious person or group of people
intended to kill others (specific target) sacrificing the attacker’s own life. Example of
suicide attack attempts can be traced from more than 2000 years back in the history
and some were treated as brave attempts of a great fighter, while he knew that he
might die if he took the risk of war or attacking others, who might be stronger than
him. Still there are debates in favour of or against this cruel activity. But practically
this is always a brutal threat to all mankind, which kills or severely injures many
innocent people and children from the surroundings of the indecent.
Suicide bombings are rare yet extremely destructive events and responses to such
events are even rarer, because they require forecasting methods for effective
prevention and early detection (Brown et al. 2004). In the last two decades, this
violent tactic became quite common among some communities in Iraq, Afghanistan,
Pakistan, India, Sri Lanka, USA, and some African countries and even some
European countries faced threat for terrorist showdown. Total 472 suicide attacks
occurred in 22 countries of the world and killed more than 7000 people and wounded
tens of thousands during the years 2000 – 2004 and around 80% of all suicide attacks
occurred after September 11, 2001 since the year 1968 (Atran, 2006).
In recent years the suicide attacks are one of the most commonly reported terrorism
tactics which are very difficult in understanding and modeling for predicting
prevention. The tracking and prediction of the suicide attacks are often misled by
voluntary death of the attacker, use of very simple and cheap explosives, social
motivation/hypnotization and participation of minor people, especially sometimes
women and children (Brown et al. 2004).
For a long time, many researchers have been trying to find out the pattern of suicide
bombing throughout the world for improving social security and saving human lives
using different statistical methods. However, very little success has been achieved on
detecting potential suicide attacks prior to its incident with high accuracy due to many
(spa (200 inci Isra Suic the chil peop inno that - 87 third defe Figu Sour Glo such exp info som atial locatio 04) conside ident locati ael. cide attacks general peo ldren. Supp ple’s educa ocent peopl
t the Muslim
7% treated s
d of Pakista
end Islam an
ure 1: Stati
rce: Pew Glob
obal concern
h an inciden
erienced th
ormation, an
me foreign c
n) and at a
ered spatial
ons to dev
s are conce
ople of any
ports for su
ation and ex
le (Figure 1
ms of Pakist
such acts as
ani said sui
nd 43% said
istics of the
bal Attitudes P
n against su
nt in March
at there are
nd access to
ompanies a
particular t
choice anal
velop an em
ived as mo
y affected ci
uicide bomb
xperience re
1, Figure 2
tan expresse
“never just
icide bombi
d it was rare
e declining
Project, Septem
uicide attack
h 2008 moti
e few securi
o such infor
and upper-cl
time (Chain
lysis to unc
mpirical pre
ost devastati
ity of the w
bing are de
egarding its
2 and Figur
ed the stron
tified” in th
ing was oft
ely or never
support fo
mber 10, 2009
ks and perso
ivated the a
ity compani
rmation is v
lass people.
ney and Rat
cover the bo
ediction mo
ing activity
world and p
eclining sha
s extent of f
re 3). A rec
ngest rejecti
he year 2009
ten or some
r justified (H
or suicide b
9
onal close o
author to do
ies that coll
very expens
. But there a
cliffe, 2005
ombing patt
odel for su
y which ext
probably aff
arply proba
fatalities cau
ent public s
ion to this k
9, where in
etimes justi
Horowitz, 2
bombing
observation
o this resear
lect/generat
sive and ma
are no warn
5). Brown e
terns in the
uicide attac tremely terr fects mostly ably becaus using mostl survey reve
kind of viol
year 2002,
fied in orde
2009).
as a survivo
rch. It has b
e some secu
ay be limite
Figure 2: A police bus, which was completely destroyed, 35 people killed and more than 30 people injured by a suicide attack in Kabul
Source: BBC News, 17.06.2007
Figure 3: People searching victims after a suicide attack struck the heavily guarded Wazir Akbar Khan neighborhood in Kabul.
The derived knowledge from the incident spatial pattern analysis could be used to
plan for physical and strategic security measures to protect highly endangered Kabul
people. This may also influence general Kabul people to avoid most suicide attack
occurrence locations (high risk zone) and specific time intervals for choosing their
every day travel route throughout the city. The use of danger zone information in
daily route choice may also decrease the traffic density near the hotspots what might
be an aid in reducing the level of threat in those locations. Moreover during any
suicide attack in Kabul, a GIS based real time network analysis could be used for
efficient transport of the wounded to the nearest hospitals for saving their lives.
1.2
Objectives
Kabul, the capital of Afghanistan, has experienced on average more than one suicide
attack in every month after fall of Taliban regime in 2001. The overall objective of
this study is to focus on only spatial and temporal patterns analysis of suicide attacks
in Kabul city from a viewpoint of geographical space. The study also intends to
produce some sort of geospatial information as an aid to further modeling of suicide
attack incidences in Kabul by emphasizing general people’s safety concerns.
A number of specific objectives emerge from those general objectives:
To determine the spatial point pattern of suicide attacks locations in Kabul city
from January, 2006 to December, 2010.
To determine the spatial point pattern of Government establishments, foreign
embassies, military bases and major international offices which tend to be
attraction of suicide attacks.
To examine the spatial relationship between suicide attack locations and
locations of target groups establishments within urban habitat of Kabul city.
1.3
Research Questions
1.4
Study Area
1.4.1 Location and Extent of Kabul City
The Kabul city is the capital and the largest city of Afghanistan. The centroid of
Kabul is located at geographic coordinates of 34°31′ N, 69°11′ E (the World
Factbook, 2010), where the municipal boundary has lied within a rectangle with
geographic coordinate values of 68° 53' 57.7788" W, 69° 29' 3.0732" E, 34° 39'
20.6424" N and 34° 17' 40.1856"S. The average elevation of the city is about 1800m
above the mean sea level (Afghan Network, 2010).
Figure 4: Location of the study area;
` Source:
a. http://www.twizi.com/images/world_map_blue.png
b. http://afghanistan.usaid.gov/en/Provinces.aspx C. Kabul City: The Study Area
1.4.2 History and Importance
Kabul is over 3,500 years old settlement where many empires had long fought over
the city for its strategic location as well as for its importance as the trade routes of
South and Central Asia (Dupree and Kohzad, 1972). The past glory and beauty of this
city has been portrayed in many historic scripts, songs and poems where the great
Moghal emperor Zahirudeen Babur wished to be buried in Kabul within his immense
kingdom. Apart from its importance as an economic, administrative and cultural
centre in the current time, the close proximity to Khyber Pass which is an important
mountainous pass as a gateway between Afghanistan and Pakistan (Afghan Network,
2010) and Salong-Pass which is a major gateway through Hindu Kush mountain range
connecting northern region of Afghanistan added some extra importance to Kabul to
be an international and regional business hub of Afghanistan.
1.4.3 Physical Environment
1.4.3.1 Topography
Kabul has a vibrant and extraordinary physical environment for its location at an
elevation of 1800m from mean sea level (Afghan Network, 2010) and surrounded by
high mountains which gives an impressive lotus view from aerials. The overall
topography of the city is undulated and some small to large size hills existed within
the city area. Only mentionable stream is Kabul River, flowing through the centre of
the city from west towards east. A hilly range composed of Tiger hill, TV hill, Kartae
Parwan hill etc. divided the city into north-eastern and south-western part (Figure 5).
Tiger Hills TV Hill Karta Parwan
Hills
Kabul River
1.4.3.2 Meteorology
The climate of Kabul is semi-arid and strongly continental (Qazi, 2011a). On the basis
of meteorological records between 1956 and 1983, Kabul experienced temperatures
ranging from a mean monthly low of -7.10C in January to a mean monthly high of
32.10C in July (WMO, 2011). On the other hand most of the precipitation observed
during winter season but the highest precipitation was in April as 71.9mm and other
months remained comparatively drier. (See Figure 6).
Figure 6: Mean monthly temperature (variation border) and precipitation in Kabul (period 1956-1983)
Source: WMO, 2011
Intensive snow fall are often observed during cold winter from December to February
which can be a big factor to influence temporal pattern and strategy of suicide attack
in Kabul.
1.4.3.3 Vegetation
A very few deciduous type vegetation is found in Kabul in recent time. The people of
Kabul claim that the city was much greener before the civil war started in 1978. Long
‐10
‐5 0 5 10 15 20 25 30 35
Temperature
in
°
C
Climate
of
Kabul
34.3
60.1 67.9 71.9
23.4
1 6.2 1.6 1.7 3.7
18.6 21.6
0 20 40 60 80
J F M A M J J A S O N D
Precipitation
(mm)
time war effect and frequent explosions at current time, use of earthen roads, and
extensive use of adulterated fuel to old (majority of more than 10 years) motorised
vehicles converted the city to one of the most dangerous air polluted habitat of the
world. The visibility declined to less than 100 meter in recent years from unlimited
before 1980s (Sediqi, 2010). Due to high elevation, scarcity of water, continental
weather and continual political unrest with frequent use of explosives can give very
little hope to revive the optimum vegetation required at Kabul in near future.
1.4.4 Urban form and Land Use
The ambient rigid mountainous topography influenced significantly the Kabul city to
be fitted in a semi circular shape. The present municipality of Kabul has area about
1030.5 square kilometers including some uninhabitable mountainous land. The city
boundary is again subdivided into 22 police districts (AIMS, 2010). The size and
shape of municipal/police districts varies extensively. The smallest district (District 1)
consists of an area of only about 4.67 square kilometer and the largest district (District
20) consists of about 143.58 square kilometer area. According to Kabul Development
Plan 2008-2023, the developed areas are contained within an area of 291 square
kilometer. The city appears to be followed a traditional form of a mono centric
(Single CBD) as well as concentric-radial pattern.
It has been revealed that only 35% of the urban settlements in Kabul are authorized or
planned and rest 65% is either squatter, or built on grabbed land or built on privately
owned land but without proper authentication of Kabul Municipality (Gebremedhin,
2005). The recent war that took place from 1978 – 2001 influenced a high rural-urban
migration and mostly travelled towards the Capital and settled on freely available hill
side stiff slope lands during a gap of proper management of city authority. This
massive informal settlement without provisions of utility and proper access ultimately
knock downed the urban service system, function and security.
The current land use of Kabul city shows the administrative and commercial core
the zon Figu side 1.4. The maj wes thro seco head
in N
four Panj Afg Afg city centre. e surroundi
ure 7: Info e in Tiger H
.5 Transp
e natural to
or entrance
st connecte
ough Warda
ond road tow
ding toward
Nangarhar p
rth road le
njshir valle
ghanistan, c
ghanistan (S
Most of th
ing the Pres
rmal housi Hill)
port netwo
opography r
es or doorw
d Kandaha
ak province
wards south
ds east conn
province an
eading towa
ey, the ma
connected M
See Figure 8
e ministries
idential Pal
ing at moun
ork
restricted th
ways (ICOS,
ar, the seco
e and contin
h connected
nected Jalal
nd in further
ards north
ajor and
Mazar e Sha
8).
s and foreig
lace at the c
ntain slope
he access fr
, 2008). Th
ond largest
nued to the
d with Loga
labad, the l
r connected
which pas
cost-effecti
arif City of
gn embassie
ore of the c
es (Left side
from outside
he first road
t city of A
e far west to
ar and Khos
argest city
d Pakistan t
sses throug
ive north-s
f Balkh Pro
s are locate
city.
e is TV Hill
e of the cit
ds initially l
Afghanistan
o connect H
t provinces
of the easte
through Kh
gh the Sala
south trans
ovince as w
ed in a prote
l and Right
ty to only
leading tow
, to the so
Herat City.
. The third
ern Afghani
haibar Pass.
ang tunnel
sport route
Figure 8: Four regional roads spread out from Kabul
1.4.6 Socio-economic Environment
Kabul has about 2.8 million people and most of them are Muslims (Statistical
Yearbook, 2008/09). There are many ethnic groups with their unique culture and
traditions where Tajik, Pashtoon, Hazara and Uzbek are most famous. In present days
they are living quite peacefully showing honor to each other’s tradition. Afghanistan
has two official languages one is Dari which is very close to Persian and another is
Pashto which is the mother tongue of Pashtoun people (Qazi, 2011b)
1.4.7 Present Conflict and Threat
Afghanistan has a long history of intense fighting between tribes, against invaders and
between ideological groups. The country saw frequent dramatic takeover of the throne
in last 30 years (http://www.afghan-web.com/history/chron/index4.html). Finally
Mujahideen and its allies formed the government in 2002 after removing Taliban
attack often takes place at public places as well as mass gathering place such as
congested roads, markets/shopping complex, assembly, embassies, residential hotels,
airports etc. and affects mostly the innocent civilians compared to their intended
targets. All people of Kabul everyday goes out with no hope that he can come back
after finishing their work at end of the day. This type of fear from death is affecting
extensively the citizen’s mental health, trust, social bondage, amenity, economy and
development of the country. The International Council on Security and Development
(ICOS) researched on the Taliban advance and depicted all international and civilian
casualties and kidnappings that have taken place on the basis of publicly available
records from January 2008 to November 2008 in Kabul with proportional symbol in
Figure 9 (ICOS, 2008). The map gives an idea of incident pattern comparative
affected people of Kabul city though the research team did not mention corresponding
numeric value of proportional explosion symbol used for civilian casualty in the map.
Figure 9: Civilian casualties and kidnappings from January to November 2008
1.4.8 Study Window
Kabul has been selected for the study due to frequent experience of major suicide
attacks targeting different strategic important locations and availability of information
in the web media. We have selected only 360.318 square kilometer area within a total
1030.5square kilometer municipal boundary. The study window/area covered mainly
the settlement area (habitat) and excluded high mountainous-uninhabitable area
considering the chances of suicide attacks occurrences. The study area boundary is
shown in Figure 4.
1.5
Thesis Outline
The full content of this study has been arranged in five chapters. Chapter 1 covers the
introduction to the study; chapter 2 elaborates the data used in this study. Chapter 3
sketches the methods of the study. All the analysis and finding are discussed in
Chapter 4. Chapter 5 provides some concluding remarks and recommendation for
further study. Beyond these all the commands and data spreadsheet are attached in the
CHAPTER 2: DATA DESCRIPTION
2.1
Introduction
Variety of data that used in the research are derived from different sources. Most of
the geographic data and location attributes of Kabul city and Afghanistan are
collected from Afghanistan Information Management Services (AIMS). High
resolution Aerial Photographs has been collected from Ministry of Urban
development.
Suicide Attack data for the maps and analysis was gathered from few public insurgent
activity reports throughout the course of January 2006 to December 2010. These are
only publicly recorded attacks that were available in different local and international
news papers and other relevant records; the real number of the suicide attacks might
much higher as all incidents did not enter to the public domain.
2.2
The Base Map: Basic GIS Feature Classes
A number of basic GIS feature classes that depicted in all the figures were mainly
downloaded from Afghanistan Information Management Services (AIMS) website
database (AIMS, 2010). A list of GIS shapefile is given at Table 1 that were used to
Geocode suicide attack points based on visual proximity assessment from the
reference locations.
Table 1: List of GIS Feature Data of the Study
Data Data Type Source and Creation Year
City Boundary and district
Boundaries
Polygon Feature: 2 2
municipality district
boundaries of Kabul city
ISAF, AIMS, 2005
Road Network Line Feature: digitized on
IKONOS satellite imagery
(2000-2002) at 1:5,000
scale
AIMS, 2005
River Line Line Feature: digitized on
IKONOS satellite imagery
(2000-2002) at 1:5,000
scale
Airport Point Feature Digitized on Aerial
Photograph of year 2006
Area names, Landmarks, Road
Intersection and Education
Institutes
Point Feature: digitized on
IKONOS satellite imagery
(2000-2002) at 1:5,000
scale
AIMS, 2005
Government Buildings:
Ministries, Departments,
Supreme Court and
Presidential Palace) of
Afghanistan in Kabul city
Point Feature digitized on
IKONOS satellite imagery
(2000-2002) at 1:5,000
scale. The accuracy of data
may vary up to 30meter
from the original building.
AIMS, 2005
Location of International
Organization Establishments:
Diplomatic Missions, United
Nations and International
Organizations in Kabul city
Point Feature: collected
with GPS and mapped at
1:5,000 scale
AIMS, 2005
Urban Settlement Polygon Feature: part of
Land use data created at
1:5,000 scale on IKONOS
image of 200-2002
AIMS, 2005
Beyond the above list the study team also used Google earth, Wikimapia and Russian
topographic maps for understanding and knowledge building on environmental setup
of every part of Kabul City. Most of the geographic feature that described above is
2.3
Suicide Attack Location Points (SALP)
In total 64 major suicide attack locations were depicted based on proximity from reference
locations described in different security reports and news websites. The accuracy level of
some of the suicide attack location points may vary up to ±500m from these locations.
2.3.1 Data Sources and Formats
It was the most challenging part of this research. Collection of suicide attack information
was not easy at all. The study team approached to many security companies and national
(Afghanistan) and international defense departments but did not receive any fruitful
response to get GPS points (x, y format of geographic coordinate values) or any other
accurate data of suicide attack locations that occurred in Kabul city from January 2006 to
December 2010. After waiting for a considerable time for the response from the authentic
data developer like Security Companies, UN, ISAF, MOI etc, the study team decided to
carry on the research based on secondary public information published on different news
papers and some daily security reports prepared by some private security company
(confidential sources) for some NGOs and international companies working in
Afghanistan.
News searching was carried out with some key words like: Suicide Attack, VBIED,
BBIED, IED etc. different internet search engines. Few news website that generally
publish news on Kabul were searched for daily news achieves from 1st January 2006 to 31st
December 2010. When any news papers mentioned any suicide attack on a particular day
then further web searches was carried out for that day to extract more information of that
incident for detailed information and confirmation. Many cases the news from different
sources on same incident was contentious and mismatching with each other’s statement.
News from local newspapers was given more priority than international news by
considering scale of spatial information variation. Many news sources were considered for
this study and followings are the main sources (but not limited to) of Suicide attack
location information beyond limited number of confidential security reports.
iii. The Afghanistan Ngo Safety Office (ANSO): an independent project to inform and
advise humanitarian organizations on safety conditions across Afghanistan,
established in 2002. (URL: http://www.afgnso.org)
iv. BBC News: An International News Website (URL: www.bbc.co.uk )
v. Voice of America: An International News Website (URL: www.voanews.com.)
vi. NYDailyNews: An International News Website (URL: www.nydailynews.com)
vii. World Military Forum: International Military News (URL: www.armybase.us)
viii. The guardian: An International News Website (URL: http://www.guardian.co.uk/ )
Primarily we found 69 suicide attack information on the above mentioned sources with
different level of location description. Most of these suicide attacks, that were affected
large number of people and was successful to reach the target, came to the public news
bulletin. Evidence found for many suicide attacks that miscarried in many reasons like,
missing the aim as detonated before reaching the target, or detonated during preparation at
night or on the way mistakenly pressed the button for test etc. which affected only the
attacker did not come to the news or received any attention. Moreover, the number of
casualty and wounded never matched between two consecutive sources for same incident.
In most cases number of affected people was provided based on assumption with range
value and very few cases a controversial statement came from the government body. So, it
was very difficult to do any detailed and reliable analysis on number of affected people.
2.3.2 Data Categorization
The study team primarily categorized the incident reports that were available on the web
on the basis of attack techniques used for each of the explosive attacks. There were many
types of attack in Kabul during the study period. The study categorized all the attack
reports (for an example see Figure 11) on the basis of attack techniques. Two major
suicide attack technique, Body Borne Improvised Explosive Device technique uses suicide
vest to attack generally static targets in a building or in the crowd which is well known as
BBIED and Vehicle Borne Improvised Explosive Device technique fills huge amount of
explosives in a Car and used to chase or wait in the road to attack convoy of the target is
well known as VBIED. There are different IED’s based attack techniques that often
confuse the reader by using different term in different reports. Especially many reporters
write BBIED or VBIED as simple IED and create semantic problem for automatic
categorization. So, the author carefully read all the reports and description of incidents for
suicide attacks that were caused by BBIED and VBIED and removed all other IED based
attack techniques like Remoter control IED, Road Side IED, IEDs made with Grenades etc.
In case of multiple suicides attack occurred at same time or very little time difference then
two factors was used to categories them. In case of complex attack, if multiple suicide
attack happened at same time or within a few minutes difference and at a same place or
within a distance of 200meter then it was considered as a single attack. But if the attack
happened in different location (distance >~500meter) at similar time then it was considered
as separate attack.
2.3.3 Extraction of Spatial Information
The study team extracted spatial information of suicide attack location that described in
natural language in different incident reports. We had gone through all the reports in detail
and marked the relevant information that required for the study. An example of a suicide
attack report that published in an Afghan local news website named Pajhwok Afghan
News (www.pajhwok.com) on 27th November 2008 is shown in Figure 11 where the
relevant information required for the research are highlighted with yellow marks. The
challenging part was to understand the name reference as many of them were in local
aliases like in Dari or Pashto. Some location name was spelled differently in different
news. Some were incomplete information and with incorrect reference location. We had
compared information from different sources for authenticity and to extract complete
Figure 11: Suicide Attack news published in Pajhwok Afghan News on 27.11.2008
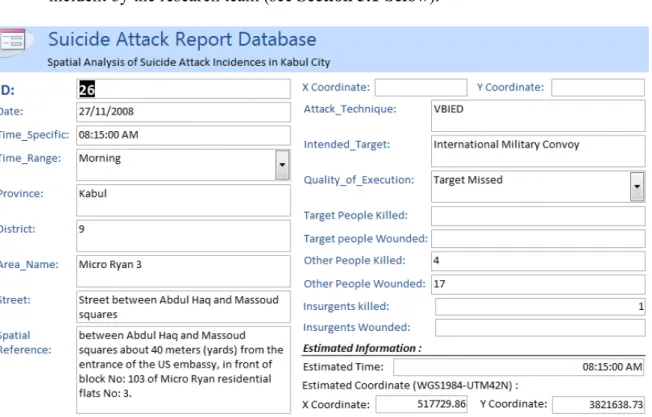
2.3.4 Suicide Attack Database
In many cases the spatial reference information in one news paper was not sufficient to
depict the location point on map. In that cases the information was accumulated from
different sources to geocode the location point quite accurately (see Figure 12). This
method also benefited the study by evaluating authenticity of published news in different
sources for better interpretation of spatial knowledge and reaching to a better decision.
The information displayed in Figure 12 is self explanatory except few aliases that used to
fit the title in the small space. The database fields were maintained some rules that are as
follows:
Date: The date of the incident
Time_Range: many cases the incident report failed to state specific time and they
use categorical time interval. In that case we add the linguistic value of time and
interoperable option to convert it to specific average time or vice versa. The
Morning- 6.00h to 9.00h, before noon - 9.01h to 12.00h, afternoon 12.1h to
15.00h, evening 15.01h to 18.00h night 18.00h to 6h on next day.
Province: in which Province the suicide attack occurred. The attack must be
occurred in Kabul province to enter in this database.
District: in which district the incident occurred among the 22 police district of
Kabul municipal boundary.
Area_Name: name of the Area or community.
Street: name or number of the Street where incident occurred
Reference: landmarks or are names that described to refer location of incident.
X_Cor_Org: original X coordinate if stated in incident report
Y_Cor_Org: original Y coordinate if stated in incident report
Attack_Technique: which technique or method (weapon/explosive) was used for
the attack
Intended_Target: who were intended target of the attack
Quality_of_Execution: how accurate was the incident to reach the target.
o Target Missed: only civilian casualty or wounded
o On the Target: only or maximum intended target casualty or wounded
o Partially on the Target: both target and civilian casualty or wounded
o Miscarriage: premature detonation - no harm to others.
Target People Killed: number of target people killed by the incident
Target People Wounded: number of target people wounded by the incident
Estimated Time: inserted mean value of specified time range in case of missing
specific time value for temporal analysis
Estimated X and Y coordinate: Generated X, Y Coordinate value for each
incident by the research team (see Section 3.1 below).
Figure 12: A database form showing extracted information on Suicide Attack of
27.11.2008
In many cases the suicide attack quality was described and on the target and showed photo
affected target groups but could not give specific number of affected people from target
group. So, that might be counted in the other people killed or wounded group as a mass.
The complete suicide attack database as a form view is attached in Annex I.
2.4
Target Group Establishment Points (TGEP)
The location of government and international organizational establishment data collected
from AIMS were categorized by incorporating local and international military
establishments and appended in one shapefile and considered as “Target Group
Establishment Points (TGEP)”. The list of considered national and international
CHAPTER 3: METHODOLOGY
3.1
Geocoding Suicide Attack Location Points
3.1.1 Spatial Reasoning
Almost all of the suicide attack reports were provided with a mix of qualitative and
quantitative approximate spatial information of the incident location described in natural
languages. This research required to generate a point data from the descriptive news
reports to use in spatial analysis. The suicide attack location points were generated from
local knowledge and relative proximity from reference point location described in the news
reports with considerations of approximate spatial reasoning techniques (Dutta, 1991) and
qualitative distances (Hernandez et al., 1995). Figure 13 shows the process graphically.
A. Method of Data Extraction B. Method of Spatial Reasoning
News Search
Identify Incident date
Further search for more information from different
sources
Insert information to
database Mark Key
Information Compare information from different sources BBIED, VBIED, SIED,
3.1.2 Data Accuracy
Some of the news reports provided with detailed descriptive spatial information pointing
towards nearby landmarks which could be used to generate points with 5 to 10 meters of
accuracy. But some spatial information was not detailed enough, either the geographic data
of reference locations mentioned was unavailable or in some cases reference point was
indicated with Persian name and spelling was not matching with the GIS data available to
the team for geocoding at similar accuracy. The original location of those incidents may
vary up to 500meter from the point that geocoded in the map. Primarily 69 suicide attack
incidents information were captured from various sources (described in Section 2.3) but
finally the team was successful to geocode 64 suicide attack location points within the
3.2
Data Conversion and processing
Spatial point pattern analysis of suicide attack location required to import 4 dataset in
SPATSTAT package supported data formats from the original GIS data format (shapefile).
The maps were produced in ArcGIS and spatial point pattern analysis done in SPATSTAT
package (Baddeley and Turner, 2005; Baddeley 2008) of Software R.
3.2.1 Create Observation Window from polygon shapefile
Considering the implication of observation widow or frame of reference on point pattern
analysis, the study area shapefile was created in ArcGIS software environment. The Study
area covered only the urban settlement and nearby area where suicide attack can be
occurred within vast Kabul municipal boundary (see Figure 14) to put emphasis on
randomness of the suicide attack probability. The study area from shapefile format was
converted to “SPATSTAT” following the techniques described by Baddeley (2011) in few
steps.
Step 1: Read shapefile using maptools
Step 2: Detection of spatial object class
Step 3: Converting data to SPATSTAT format
Step 4: Declare polygon data as window
3.2.2 Convert SALP data to SPATSTAT
The Suicide Attack Location Points (SALP) which were primarily created in GIS file
format (shapefile), converted to the SPATSTAT package of Software-R in few standard
steps (Baddeley, 2011).
Step 1: Read shapefile using maptools
Step 2: Detection of spatial object class
Figure 15: Suicide Attack Location Points in the automatic data extent window
Step 4: Apply Window from W="owin" Class
Step 5: Unmark the Point data
Step 4: Update Unit as Meter
The primary data does not show any particular measurement unit and needed to
declare appropriate measurement unit (meter for this data) for proper interpretation.
Step 5: Changing Scale and Unit to Kilometer
Considering the fact of having only few numbers of suicide attack location points
(64) within the study area, it was decided to round the measurement unit to
kilometer for better understandable statistics.
3.2.3 Converting TGEP data to SPATSTAT
The Target Group Establishment Point (TGEP) which were primarily created in GIS file
format (shapefile), converted to the SPATSTAT package of “R” by similar steps that were
followed in section 3.2.2. Only difference was to keep the embedded marks with the TGEP
data which could differentiate government establishments from international
establishments.
3.3
Spatial Point Pattern Analysis
The spatial point pattern analysis of this research carried out in 3 stages. Suicide attack
location points (SALP) and target group establishment point (TGEP) were analyzed
separately in two consecutive stages and explored spatial patterns. Finally it analyzed
covariate effect whether the location of SALP depends on TGEP.
3.3.1 Estimates of Spatial Pattern
Both SALP and TGEP were analyzed separately by following methods.
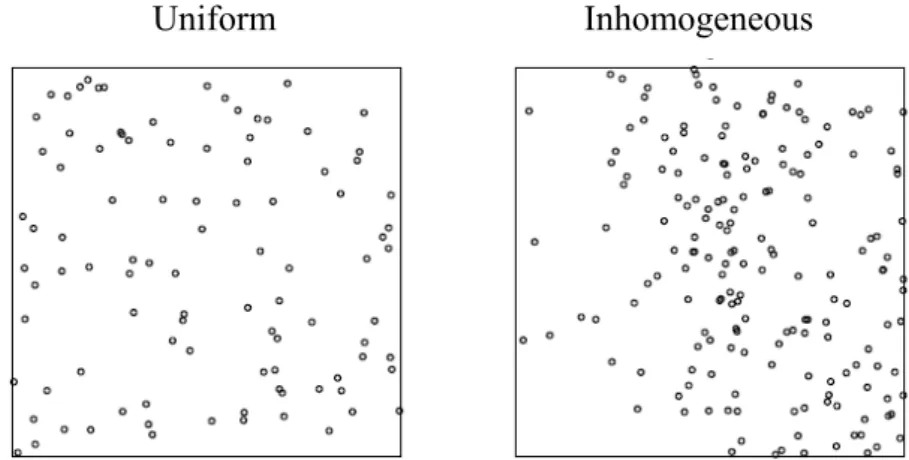
3.3.1.1 Test of Intensity
First of all the point data were checked to decide whether they are uniform (constant) or
non-uniform (inhomogeneous) by observing average density, quadrate count and kernel
density methods.
Uniform Inhomogeneous
Figure 17: A sample of uniform and inhomogeneous point pattern
Source: Baddeley (2008)
3.3.1.2 Test of Interaction
In this stage the point data were tested for complete spatial Randomness (CSR) test using
Envelops over K function and G function to decide whether the data are random or there
of maximum and minimum values of K(r) or G(r) for each value of distance r(pairwise
distance/ nearest neighbor distances) of some simulated realizations (100 simulation for
our study) of CSR with same intensity.If the test result rejects the test of CSR then next
step is to decide the nature of the pattern either regular or clustered (See Figure 18).
If the simulated line of each observed value of distance variable r become greater than the
theoretical value of K(r) or G(r) of CSR then the it is decided the point pattern as clustered
or point located closely to each other. In case of observed K(r) or G(r) < theoretical K(r)
or G(r) then the pattern is decided as regular or dispersedly located from each other.
Independent Regular Clustered
Figure 18: A sample of different types of interaction pattern
Source: Baddeley (2008)
3.3.2 Analysis of Covariate Effects
In this stage the study tried to check whether the intensity of suicide attack location points
(SALP) depends on target groups establishment locations (TGEP) by Marked Point Pattern
Analysis techniques described by Baddeley (2008) in his SPATSTAT manual.
3.4
Justification of Accuracy Impact
Some of the suicide attack location inherited with low accuracy, which varies up to 500
meter. The study generated the suicide attack location points again by considering its
possible positional error by moving the point to a different place arbitrarily within its error
extent. The simulations were carried out again based on this new dataset and results were
CHAPTER 4: RESULTS AND DISCUSSION
4.1
Introduction
To fulfill the requirement of the general objective and three specific objects that aimed for
the study we did point pattern analysis of the suicide attack location points and target
group’s establishment points to revel spatial pattern of these two types of point’s location
with respect to the Kabul city study boundary. Then we approached to reveal
interdependency between suicide attacks location points and target group establishment
location by marked point pattern analysis. Finally we esteemed to revel some spatial and
temporal analysis considering other relevant spatial and social factors like, who are the
targets of the suicide attacks, where the suicide attack happens mostly, what time, which
months and which year how many suicide attack happened in Kabul from 2006 to 2010.
4.2
Analysis of Suicide Attack Location Points (SALP)
The study contained 64 major (excluding some miscarriage and unreported incidents)
suicide attack location points that occurred in last 5 years from January 2006 to December
2010 within the urban settlement limit of Kabul City.
4.2.1 Investigation of Intensity
Intensity is the average or mean value of points distributes in a single unit of the specified
area. This value can determine whether the point pattern is uniform/constant or
inhomogeneous over the space.
4.2.1.1 Uniform Intensity
The estimated average intensity of suicide attack points is 0.178 points per square
kilometer. Now this value could be used as a parameter to prove these points distribution is
homogeneous i.e. it exists same intensity in all parts of the study area or intensity varies
over space for an inhomogeneous distribution.
4.2.1.2 Inhomogeneous Intensity
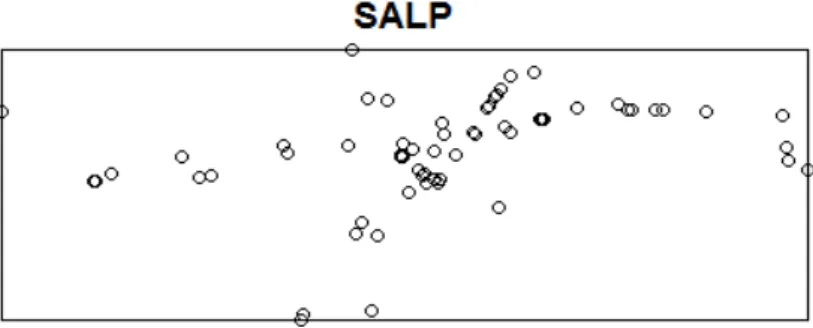
I. Quadratcount
The study area was divided into 6 x 3 quadrate cells and measured the points in each of the
quadrate to evaluate its intensity pattern and found the pattern is inhomogeneous (See
Figure 19: Intensity of suicide attack incident by 6x x 3y quadrates of the Kabul City
It was also found that the central area experienced more suicide attacks than other areas
though there were also some sort of linear patterns originated in the center and approached
outwards (especially to the ease and west) the city which might followed some major
roads.
II. Kernel Density Estimation
The kernel density estimation using an isotropic Gaussian kernel with a radius of 2
kilometer (δ=2km) was implemented in SPATSTAT for SALP data. The result is
presented in Figure 20, which strongly proved the dataset to be inhomogeneous pattern i.e.
4.2.2 Investigation of Interaction
The test of complete spatial randomness (CSR) was done by two distance based functions
to decide whether the dataset is completely random or there exists some interaction
between points. First we tested the nature of interaction by an envelope over pairwise
distance (the K function) and then envelop over nearest neighbor distances function (the G
function) with 100 simulated realization of CSR to decide the pattern to be completely
random or not. If the line of K-function or G function estimated from SALP lies outside
the typical range value of K/G function for a completely random pattern then we would
reject the data point pattern to be completely spatial random and approach towards
deciding whether the data is clustered or regular pattern by observing whether the observed
value of K/G function is greater or smaller than the typical theoretical value of CSR.
4.2.2.1 Envelop for Pairwise distances and the K function:
The outputs of the K function test for 100 simulated realization of CSR are as follows,
Table 2: Result of Envelop over K Function for SALP
Pointwise critical envelopes for K(r) Edge correction: “iso”
Obtained from 100 simulations of CSR
Significance level of pointwise Monte Carlo test: 2/101 = 0.0198
Data: SALP
Function value object (class ‘fv’) for the function r -> K(r)
Entries:
id label description -- --- ---
r r distance argument r
obs obs(r) observed value of K(r) for data pattern theo theo(r) theoretical value of K(r) for CSR
lo lo(r) lower pointwise envelope of K(r) from simulations hi hi(r) upper pointwise envelope of K(r) from simulations ---
Default plot formula: . ~ r
Figure 21: Envelope for pairwise distances and the K function for SALP data
A. Decision of Randomness
The Observed line of K Function in Figure 21 lied completely outside of envelope, i.e. for
every arguments of pairwise distances (r) which constructed an observed line that lied far
away (significant difference) from the theoretical line of CSR and both of the upper and
lower point-wise envelope limit of K(r) from 100 simulations of same intensity of points.
Hence, according to the Monte Carlo test principals (Baddeley, 2008), we rejected the null
hypothesis of the SALP point pattern to be random or independent pattern with high level
of significance (Significance level of point-wise Monte Carlo test is 0.0198 or ~98% level
of confidence). So, we can say the point data is either regular or clustered.
B. Decision of Clustering or Regularity
We also observed (in Figure 21) that for every argument of pairwise distance ´r´ the
observed value of K(r) for the SALP data pattern are always greater than the theoretical
Table 3: Result of Envelop over G Function
Point-wise critical envelopes for G(r) Edge correction: “km”
Obtained from 100 simulations of CSR
Significance level of point-wise Monte Carlo test: 2/101 = 0.0198
Data: SALP
Function value object (class ‘fv’) for the function r -> G(r)
Entries:
id label description -- --- ---
r r distance argument r
obs obs(r) observed value of G(r) for data pattern theo theo(r) theoretical value of G(r) for CSR
lo lo(r) lower pointwise envelope of G(r) from simulations hi hi(r) upper pointwise envelope of G(r) from simulations ---
Default plot formula: . ~ r
Recommended range of argument r: [0, 1.2775] Available range of argument r: [0, 4.5422] Unit of length: 1 kilometer
A. Decision of Randomness
The Observed line in Figure 22 lied completely outside of the envelope formed by 100
simulated realizations of CSR with the same intensity, over G function graph. So, for every
arguments of observed value of G(r) of the data pattern formed a line, that lied far away
(significant distance) from the theoretical line of CSR and as well as outside of both upper
and lower point-wise envelope limit of G(r) of the 100 simulations. Hence, from the Monte
Carlo test principles (Baddeley, 2008), we rejected the null hypothesis of being the SALP
point pattern as random or independent pattern significantly (Table 3). So, at this stage it
was decided that the data is not rand and it might be either regular or clustered.
B. Decision of Clustering or Regularity
For every argument of distance (r) for the observed value of G(r) were always greater than
the theoretical value of G(r) of CSR (Figure 22). Thus the Suicide attack location point
pattern is proved to be clustered.
4.3
Analysis of Target Groups Establishment Points (TGEP)
The study used 153 point location of government and International strategic establishments
(building or compound) that seems to be targets of the suicide attack within the urban
settlement limit (window area =360.32 km2) of Kabul City.
4.3.1 Investigation of Intensity
The study investigated the point pattern with the measure of intensity. It was carried out to
decide whether the point pattern is homogeneous or inhomogeneous.
4.3.1.1 Uniform Intensity
It was found that the average intensity of target group establishments was 0.425 points per
square kilometer. In case of homogeneous pattern, every corner of the study window
should have similar number of establishment per unit area. If not then the pattern is not
uniform. For this we had investigated inhomogeneous intensity.
concentrated to the core of the city or central area compared to the suicide attack location
distribution (visual comparison of Figure 19 and Figure 23).
Figure 23: Intensity of target group establishments by 6 x 3 quadrates within the
study window
II. Kernel Density
The kernel density estimation used isotropic Gaussian kernel with a radius of 2 kilometer
(δ=2km) and implemented in SPATSTAT on TGEP data. The result is presented in
Figure 24, which strongly proved the dataset as inhomogeneous pattern.
Figure 24: Graduate color plot and perspective plot of Kernel density of Target
4.3.2 Investigation of Interaction
The investigations of interaction among the points were done by two distance based
functions. First we tested the nature of interaction by an envelope over pairwise distance
(the K function) and then envelop over nearest neighbor distances function (the G
functions).
4.3.2.1 Envelop for Pairwise distances and the K function
The output of the K function test is illustrated in Table 4 below,
Table 4: Result of Envelop over K Function for TGEP
Point-wise critical envelopes for K(r) Edge correction: “iso”
Obtained from 100 simulations of CSR
Significance level of point-wise Monte Carlo test: 2/101 = 0.0198
Data: TGEP
Function value object (class ‘fv’) for the function r -> K(r)
Entries:
id label description -- --- ---
r r distance argument r
obs obs(r) observed value of K(r) for data pattern theo theo(r) theoretical value of K(r) for CSR
lo lo(r) lower point-wise envelope of K(r) from simulations hi hi(r) upper point-wise envelope of K(r) from simulations ---
Default plot formula: . ~ r
Figure 25: Envelope for pairwise distances and the K function for TGEP data
I. Decision of Randomness
The observed line in Figure 25 lied completely outside of envelop, i.e. for every
arguments of r that constructs an observed line laid far away (significant difference) from
the theoretical line of CSR and both of the upper and lower point-wise envelope limit of
K(r) from 100 simulated realization of CSR for distance r. Hence, from the principles of
Monte Carlo test (Baddeley, 2008), we rejected the null hypothesis of being the TGEP
point pattern as random or independent with high level of significance (significance level
of point-wise Monte Carlo test: 2/101 = 0.0198 or ~98% level of confidence). So, the data
is declared as either regular or clustered.
II. Decision of Clustering or Regularity
The (Figure 21) argument of distance (r) for the observed value of K(r) for data pattern are
always greater than the theoretical value of K(r) of CSR. This indicates TGEP data set as a
4.3.2.2 Envelop for nearest neighbour distances and the G function
The results of the envelop over G function computations for the point-wise distances are
illustrated in Table 5 below,
Table 5: Result of Envelop over G Function for TGEP data
Point-wise critical envelopes for G(r) Edge correction: “km”
Obtained from 100 simulations of CSR
Significance level of point-wise Monte Carlo test: 2/101 = 0.0198019801980198
Data: TGEP
Function value object (class ‘fv’) for the function r -> G(r)
Entries:
id label description -- --- ---
r r distance argument r
obs obs(r) observed value of G(r) for data pattern theo theo(r) theoretical value of G(r) for CSR
lo lo(r) lower point-wise envelope of G(r) from simulations hi hi(r) upper point-wise envelope of G(r) from simulations ---
Default plot formula: . ~ r
Figure 26: Envelope for G function test of TGEP
I. Decision of Randomness
The observed line in Figure 26 was found completely outside of the envelope, created by
100 simulated realizations of CSR with the same intensity, over G function graph. Hence,
from the Monte Carlo test principles (Baddeley, 2008), we rejected the null hypothesis of
being the TGEP point pattern as random or independent pattern significantly. So, at this
stage it was decided that the data is either regular or clustered.
II. Decision of Clustering or Regularity
For every argument of ´r´ for the observed value of G(r) were always greater than the
theoretical value of G(r) of CSR (Figure 26). Thus the Suicide attack location point pattern
4.4
Investigation of the Relationship between SAP and TGEP
The previous investigation on suicide attack location points (SALP) and Target group
establishment points (TGEP) separately revealed that both data pattern were
inhomogeneous and clustered. So, Multitype (categorical marks) point pattern analyses
were done to reveal inherent relationship or dependencies of SALP on TGEP. We also
considered TGEP as covariate and SALP as dependent on the TGEP for our analysis.
4.4.1 Creating dataset and Inspecting General Pattern
One single point data file was created inserting all suicide attack location points marked as
SALP and target group establishment points marked as TGEP as simple categorical label
value. The summary function of SPATSTAT explored that there was total 217 points
indicated as marked planar point pattern in the dataset where 64 points were marked as
SALP and 153 point marked as TGEP. Figure 27 displayed the location of both TGEP and
SALP within the study window where central part of the city looks clumsy due to high
density of point.