AND PATHOGENESIS GENES IN RESPONSE TO 6°C, 65°C AND PH 2.0
Radka Pribylova1, Petr Kralik1, Neysan Donnelly1,2, Jan Matiasovic1, Ivo Pavlik1*
1
Veterinary Research Institute, Hudcova 70, 621 00 Brno, Czech Republic; 2 University of Aberdeen, King´s College, Aberdeen
AB24 3FX, United Kingdom.
Submitted: December 14, 2009; Approved: November 04, 2010.
ABSTRACT
The aim of this work was to study the expression of selected Mycobacterium avium subsp. paratuberculosis
(MAP) genes connected with MAP virulence, adhesion and stress response. The temperature of 6°C and
65°C were chosen with regard to the food industry, storage conditions (refrigerator) and low-temperature
pasteurization. A pH of 2.0, using lactic acid, was selected to mimic the natural environment of the stomach.
Expression of selected genes was studied using real time reverse transcription PCR on three different MAP
isolates. MAP isolates were chosen according to the number of their preceding cultivations. While isolates
8672 and 8819 were previously cultivated only once, MAP isolate 12146 went through four passages.
Different expression profiles were observed in each of the three MAP isolates. However, particular similar
patterns were observed. SigE, sigF and ahpC were up-regulated, while sigL was down-regulated under
temperature stress. Mmp gene was found to be down-regulated under acidic conditions. Low passage isolates
(8672 and 8819) showed certain level of acid resistance.
Key words:MAP; Johne’s disease; stress; treatment; real time PCR
INTRODUCTION
Mycobacterium avium subsp. paratuberculosis (MAP) is a
slender, non-spore-forming, aerobic bacterium. Its main
features are the requirement for Mycobactin in growth media,
and slow growth, which complicates its cultivation and
diagnosis. MAP is the causal agent of a chronic inflammation
of the intestine called paratuberculosis or Johne´s disease (in
Anglo-Saxon countries), which affects mainly domestic
ruminants, but also other animal species. The disease is
characterised by a loss of physical condition and weight,
emaciation, decreased milk production and diarrhoea (3, 13,
18, 24,). Additionally, MAP is considered to be one of the
possible causes of Crohn’s disease (CD) in humans (7, 8, 26,
27, 37). The most frequent sources of MAP for humans are
from contaminated drinking water, water aerosol, milk (14 –
16) or even meat (1).
Transcriptional control represents the major mechanism in
gene expression regulation in prokaryotes and so the
measurement of RNA transcripts provides an accurate picture
of the cell’s response to a given stress. The detection and
quantification of gene expression levels can be investigated by
many methods such as Northern blotting (2), S1 nuclease
protection (6), sequencing of cDNA libraries (29) or serial
analysis of gene expression - SAGE (43). Nowadays, real time
reverse transcription qPCR (real time RT-qPCR) and
microarray technology represent the most used techniques for
expression profiling studies (45, 47).
The purpose of the present study was to investigate the
MAP gene expression after inducing stress factors such as
temperature and acid environment in vitro. The temperatures of
6°C and 65°C were chosen with regard to the storage
conditions (refrigerator) and low-temperature pasteurization
used in the food industry, respectively. A stress factor of pH
2.0 was selected with regard to the acid environment in the
stomach. Appropriate candidate genes were selected for their
involvement in the virulence, adhesion and stress response in
MAP or other mycobacterial infections.
The most plentiful group was represented by sigma factors
– transcriptional regulators, which are involved in all gene
expression(23, 36, 44). Nineteen sigma factors are encoded by
MAP genome (22). Mammalian cell entry (mce) genes
represented the second largest group of tested genes; they were
identified in many mycobacteria, and have been described to be
important for pathogenesis (20 – 22, 31). UmaA1, papA2, kdpC
and impA were investigated due to their role in various
pathways contributing to colonisation of host tissues (38). The
macrophage-induced gene (mig) and the major membrane
protein gene (mmp) were selected because of their apparent
involvement in virulence (4, 5, 11, 33, 34). KatG gene encodes
the catalase-peroxidase enzyme contributing to mycobacterial
survival in macrophages by protecting the cells against
hydrogen peroxide (12, 19). In its absence, antioxidant
protection is provided by an increased expression of ahpC,
which is itself reduced by ahpD (30). Finally gapdh and 1g2
were selected as MAP housekeeping genes (12).
MATERIALS AND METHODS
Bacterial isolates
Three MAP cattle field isolates (12146, 8672 and 8819)
from the Czech Republic were used. Isolates Nos. 8672 and
8819 were obtained from clinically manifested cows, while
isolate No. 12146 originated from a healthy cow. Nevertheless,
all isolates tested positive after cultivation on Middlebrook
7H9 with Middlebrook AODC enrichment, BD PANTA
antibiotic mixture (all Becton Dickinson, Franklin Lakes, NJ,
USA) and Mycobactin J (1 mg/l; Allied Monitor, Fayette, MO,
USA). While isolates 8672 and 8819 went through preceding
cultivation once, the third isolate, 12146, had been
sub-cultivated four times (under the same conditions as previous
two isolates). The MAP suspensions were inoculated into
Middlebrook 7H9 broth supplemented with Mycobactin J
(1 mg/l; Allied Monitor, USA) and OADC (Becton Dickinson,
USA). Cells were incubated with shaking at 37°C for 5 to 10
weeks to log phase. All isolates were confirmed for the
presence of IS900 using real time qPCR (40; data not showed).
MAP treatments in vitro
Six ml of each MAP isolate in the log phase were
transferred into glass tubes and subjected to 6°C, 65°C and
lactic acid (LA) treatment. The tubes were exposed to 6°C and
65°C for 30 min. To ensure the acquirement of 65°C in the
whole volume of MAP culture, tubes were exposed to
“pre-heating” step (measured in the sealed glass tubes with 6 ml of
MAP and containing a thermometer). The total time of 65°C
temperature treatment, including the “pre-heating” step was
determined as 31 min and 50 s. In the case of pH treatment, the
appropriate concentration of LA (5%) was added into a tube
containing 6 ml of MAP culture to obtain a pH of 2.0. The
mixture was agitated for 2 minutes. A sample without any
treatment was prepared to serve as a control. All experiments
RNA isolation
Immediately after treatments, guanidine thiocyanate (4M,
Sigma, St. Louis, MO, USA) was added to treated and
untreated MAP cultures. The solution was allowed to stand at
room temperature for 30 min prior to centrifugation (3,026 ×g
for 10 min at 4°C). The pellet was resuspended in 600 l of
TriReagent (Sigma, USA) and homogenised with 0.1 mm
Zirconia beads (BioSpec Inc., Bartlesville, OK, USA) using the
MagnaLyser instrument (Roche Molecular Diagnostic,
Penzberg, Germany) at 6,500 rpm for 15 s. The sample was
homogenised a further three times with cooling on ice for 2
min between each step. Homogenised samples were transferred
into a new tube, 100 l of chloroform was added, gently mixed
and centrifuged (10,000 ×g for 10 min at RT). The upper phase
was transferred into a new tube and 350 l of RLT buffer was
added (RNeasy kit, Qiagen, Hilden, Germany). Subsequently,
the RNeasy kit (Qiagen, Germany) was used for RNA isolation
with these modifications: 250 l of 98% ethanol was added to
the mixture with RLT buffer and all centrifugation steps were
carried out at 8,000 ×g for 20 s. RNA was eluted using 50 l of
RNase, DNase free water. The elution was repeated with the
same filtrate again (RNA isolation according to Dr. Tim Bull,
St. George’s Hospital Medical School, London, UK; personal
communication).
DNase treatment and reverse transcription (RT)
10 U of DNase I was applied to RNA samples according
to the manufacturer’s instructions (Roche Molecular
Diagnostic, Germany). The reaction contained 40 l of isolated
RNA in a total volume of 50 µl. Incubation was carried out at
37°C for 30 min, followed by enzyme inactivation at 75°C for
5 min. After the first incubation, an additional 10 U of enzyme
was added and the incubation and inactivation step was
repeated. The RT mix contained 20 U of Avian Myeloblastosis
Virus-reverse transcriptase (AMV-RT) and 1 × reaction buffer
(Finnzyme, Espoo, Finland), 40 nmol of all dNTPs (Finnzyme,
Finland), 40 U of Ribonuclease Inhibitor (Takara Bio Inc,
Otsu, Japan), 1 pmol of each reverse primer (see Table 1), and
20 l of DNase treated RNA. The mix was brought to a final
volume of 40 l using RNase free water. Reverse transcription
was performed at 42°C for 60 min. After RT, cDNA was
purified using the MinElute qPCR Purification Kit (Qiagen,
Germany) with final elution into 100 l of TE buffer (Amresco,
Solon, OH, USA).
Real time qPCR
Real time qPCR mixes were made up to a final volume of
10 l and contained 1 × of DyNAmo Probe qPCR Master Mix
(Finnzyme, Finland), 0.1 U of Uracil DNA Glycosylase (Roche
Molecular Diagnostic, Germany), 5 pmol of each forward and
reverse primer, 0.5 pmol of each probe labelled with FAM and
1 l of appropriate cDNA. Primers and probes were designed
using Primer3 software (35) on a MAP K10 strain genomic
sequence (GenBank AE016958) and synthesised by VBC
Genomics, Austria (Table 1). Gapdh primers were described
previously in Granger et al. (12). qPCR was performed using
the LightCycler 480 Instrument (Roche Molecular Diagnostic,
Germany) using 96-well qPCR plates under the following
conditions: initial denaturation at 95°C for 15 min followed by
45 cycles of 95°C for 5 s and 60°C for 30 s (fluorescence data
collection). Subsequent analysis was carried out using the
“Second derivative maximum” option of the LightCycler 480
software (version 1.2.0.0625). All qPCR were done in
triplicates.
Calculation of relative expression level
To determine the most suitable housekeeping genes for
data normalization, the stability of genes was tested using
geNorm software (42). Relative expression levels of selected
genes were calculated according to the modified ∆∆Ct method,
which also takes into account real time qPCR efficiencies (32).
Twice up- or down-regulated gene expression difference was
considered to be significant (46, 48). The efficiency of real
(essential for the calculation of relative expression levels) was
determined from serial dilutions of MAP isolate No. 12146
cDNA (1, 10, 100 and 1000 times diluted) in fish sperm DNA
(Serva, Heidelberg, Germany). Real time PCR followed the
above mentioned protocol.
Determination of MAP viability after the treatment
MAP viability was assessed by the propidium monoazide
PMA-PCR (28). Briefly, from each culture (with treated or
untreated control cells), two aliquots of 250 µl were delivered
to individual tubes. One of them was subjected to PMA
(Biotium, Inc, Hayward, CA, USA) treatment. Then, both tubes
with PMA treated and untreated cells suspensions were
centrifuged at 5,000 ×g for 5 min and the supernatant was
removed. 250 µl of the fish sperm DNA (Serva, Germany)
dissolved in TE buffer (50 ng/µl; Amresco, USA) was added to
the pellet. The MAP cells were lysed at 100°C for 20 min, the
suspension was then centrifuged and the supernatant served as
a template for F57 real time qPCR (40). Each sample was
analysed in physical duplicate. For the determination of the
MAP viability, the quotient of the absolute amount of MAP
cells treated with PMA and without PMA was determined for
respective MAP strain and treatment (control). By using this
approach, we were able to determine the percentage of the
MAP live cells, and to assess the effect of the treatment.
Table 1. Primers and probes used for the expression analysis in Mycobacterium avium subsp. paratuberculosis
Target Name Sequence PCR product
1g2-F aaacgatttgaacaaggtgctc 1g2-R cgaatagggcgctgaatg
1g2
1g2-TM FAM-atggaaggccacgaggcggatt-BHQ
119 bp
GAPDH-Fa atcgggcgcaacttctacc GAPDH-Ra gtcgaatttcagcaggtgagc
gapdh
GAPDH-TM FAM-acgacatcaccgacaacagcacc-BHQ
123bp
35kDa-F cggagcagacgatccaga 35kDa-R ggcgtcttccacaccttg
mmp
35kDa-TM FAM-acgacctcgacgcgctgatc-BHQ
82 bp
mod-F gcatcaaccaggacagcac mod-R gtcgctgaatttcacctcgta
fap-p
mod-TM FAM-ctcaacggcgccaacggaag-BHQ
83bp
umaA1-F ttgacctacacccagaagcag umaA1-R gaaccgtaaatcgctcatcg
umaA1
umaA1-TM FAM-cagcacgagcgcggcgtt-BHQ
66bp
papA2-F ggcgttcccacagaatcc papA2-R cagacacatcgccctgac
papA2
papA2-TM FAM-cgattcggtcgagcgctacatc-BHQ
73bp
kdpC-F caccgttcgtgagcctct kdpC-R atctggccgagcgaatagt
kdpC
kdpC-TM FAM-cgcgtcgaatgcgccaaga-BHQ
76bp
impA-F ctgacctggttgccgttc impA-R gcgggatttcgttcttgc
impA
impA-TM FAM-ctcgaccagcgctacaccgc-BHQ
mce2-F atccgcgctatgtcaacc mce2-R cgtacttgttgccgaacagc
mce2
mce2-TM FAM-tgattccggcgaacgtggtg-BHQ
78 bp
mce3-F caacacatcctgtcgattctc mce3-R tggttgtcggtgatggtg
mce3
mce3-TM FAM-tcggcgagcaccaccagc-BHQ
62 bp
mce4-F gacgctgggcatcaacag mce4-R gccgaagatggtgttaccg
mce4
mce4-TM FAM-tccaacgccaccgtgcacatc-BHQ
82 bp
mig-F ggccatatcgagctgctg mig-R cgtctcgacctcctcgac
mig
mig-TM FAM-actccgtgtgcatcaattccgg-BHQ
81 bp
sigA-F gatggcgttcctcgatttg sigA-R agcccttggtgtagtcgaac
sigA
sigA-TM FAM-cctgatccgtgcggtcgagaa-BHQ
80bp
sigD-F ccgtcgatgacaattccag sigD-R ggagtgcgttgtggtctcc
sigD
sigD-TM FAM-aacgtctcgatgctgtggtcgc-BHQ
79 bp
sigE-F gtgtaccggctggcctac sigE-R ccggatgaaggtctcctg
sigE
sigE-TM FAM-aatcagcacgacgccgaggac-BHQ
75 bp
sigF1-F gacgcagagccagatagcc sigF1-R agggtgtttgccaggatg
sigF1
sigF1-TM FAM-cgtctcgcagatgcaggtctcg-BHQ
72 bp
sigF2-F gcagctcctacaacaccttg sigF2-R cgcacttcctcctcttcg
sigF2
sigF2-TM FAM-tccatcgacagcggcggc-BHQ
61 bp
sigH-F gaccaacacctacatcaacagc sigH-R gatttcctcggtcggatactc
sigH
sigH-TM FAM-taccgcaagaagcagcgccag-BHQ
70 bp
sigL-F cgtgatcgaacggtcctact sigL-R cgatgccgaggtctgtagc
sigL
sigL-TM FAM-cggttggaccaccgcgcagata-BHQ
65 bp
katG-F caaccagggcaagttcgtc katG-R aagcggtcgttgttcatcac
katG
katG-TM FAM-aggacttcgtcgcggcctg-BHQ
66 bp
ahpC-F ctgaagaacctgccgttcc ahpC-R cgtcggcgttgagaacac
ahpC
ahpC-TM FAM-ctctcggacatcaagcgcgaact-BHQ
79 bp
ahpD-F gaacatcatcggcaatcc ahpD-R gaaacggcgaagcaccac
ahpD
ahpD-TM FAM-cgtggagaaggcgaacttcgagct-BHQ
63 bp
a
RESULTS
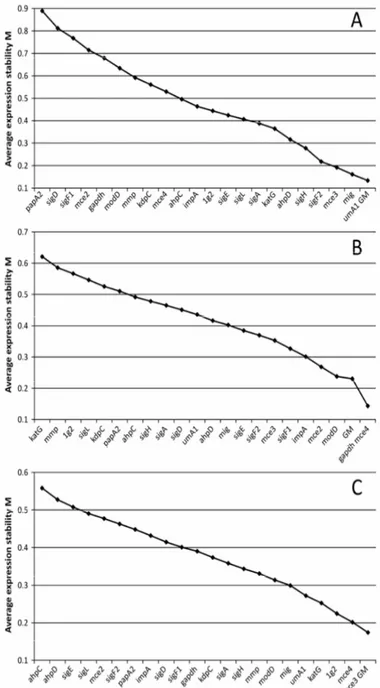
The testing of stability using geNorm software showed
different stabilities of 1g2 and gapdh genes in different MAP
isolates under various stress conditions (Fig. 1). As no other
genes (from the set of 22) were found be suitable for use as a
housekeeping gene for all three isolates, the geometric mean
(GM) of all Cts (cycle thresholds) within the respective
treatment (control) for each strain was calculated and used as
a “normalization reference”. Normalization using the GM has
been described for larger set of data and represents a way of
obtaining accurate expression profiles of tested genes (42). The
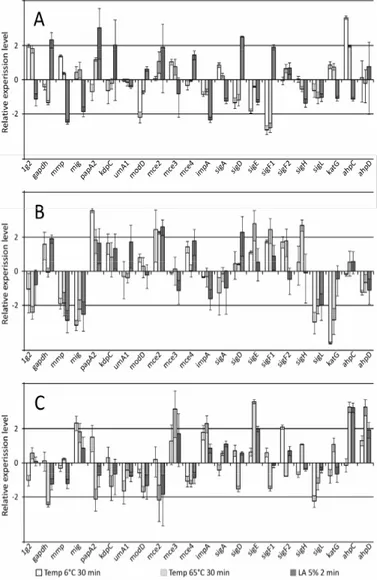
relative expression levels for each MAP isolate are shown in
Fig. 2. A two-fold change in expression was used as mentioned
above.
MAP isolate 8672 showed seven up-regulated genes under
temperature treatments 6°C and 65°C, which was the highest
number of up-regulated genes from all tested isolates (Fig. 2).
Isolate 8819 responded with 5 up-regulations, while only two
up-regulations were observed in isolate 12146. Expression
profiles were different in different isolates, nevertheless,
a similar pattern was found. SigE was up-regulated in both
8672 and 8819 treated at 65°C. The same situation was noted
with the gene sigF2 under 6°C, although the expression in
isolate 8819 was slightly under the limit of two. Similarly,
ahpC was up-regulated in 8672, and was slightly below two in
the isolate 12146 under the stress of 65°C (Fig. 2). SigL was
the only common gene found to be down-regulated in two
isolates (8819 and 8672).
With regards to the results of acidic treatments, the reverse
was determined when comparing temperature stresses (Fig. 2).
MAP isolate 12146 showed the highest level of response to this
stress factor. Three genes (gaphd, papA2 and sigD,) were
up-regulated in isolate 12146 when compared to one ahpC, and no
up-regulated gene in isolates 8672 and 8819, respectively. Each
8819 and 12146 showed down-regulation in two cases (mmp,
mig and impA genes), whereas one down-regulated gene was
noted in isolate 8672 (mce2). In both 12146 and 8819 isolates,
the mmp gene was down-regulated. The correlation between
stress factors and cell viability is shown in Table 2.
Figure 1. The average expression stability (M) of selected genes for the Mycobacterium avium subsp. paratuberculosis
strains 12146 (A), 8819 (B) and 8672 (C) measured by
Figure 2. The relative gene expression levels (in log scale) of
Mycobacterium avium subsp. paratuberculosis strains 12146
(A), 8819 (B) and 8672 (C). Numbers on y axis represent
multiples of up- (positive values) and down- (negative values)
regulation.
Table 2. Percentage of viable Mycobacterium avium subsp.
paratuberculosis cells after treatments as determined by F57
real time qPCR
MAP 12146 MAP 8672 MAP 8819
6°C 100.5 104.3 102.8
65°C 21.17 12.86 14.24
pH2 25.33 32.25 36.95
All calculations were done as the quotient of MAP cells treated with PMA and without PMA for the respective MAP strain.
DISCUSSION
The expression of virulence determinants in bacteria can
be controlled by environmental signals, especially by
temperature and low iron concentration, but osmolarity, pH,
oxygen or CO2 can play an important role as well (25). The
goal of this study was to determine the influence of certain
stress factors used in the food industry (storage conditions,
low-temperature pasteurization and the presence of lactic acid)
on the expression profiles of representatively selected genes
involved in virulence, pathogenesis and stress response of
MAP. A thorough examination of internet databases was
carried out and suitable candidate genes were selected. The
complete package contained 22 tested genes; two of them
assumed to be housekeeping genes.
Two genes, 1g2 and gapdh, were selected to serve as
housekeeping genes according to the literature (12). As they
were previously described to be constitutively expressed in
MAP, it was not confirmed in our study. None of the other
genes were proven to be uniform for all three MAP strains
therefore the strategy using a GM had to be adopted for
normalization (42). This strategy is based on the principle that
the mean expression level of a sufficiently large pool of genes
is similar in all samples, regardless of the experimental
conditions. Changes in the expression of a small portion of
genes due to experimental conditions cannot change the overall
mean of the expression ratio (49). For every control gene, the
pairwise variation with all other control genes is determined as
the standard deviation, and the internal control gene stability
measure (M) is defined (42).Using the geNorm software, the
GM was determined as the most stable (in 12146 and 8672
isolate) and second most stable (in 8819 isolate) “gene” (Fig.
1). We are aware that this study is the first to combine the use
of GM and real time RT-qPCR for the determination of the
reference gene. Although it is rather employed in the analysis
of larger gene sets, we think that it could be utilised in real time
RT-qPCR, especially when no suitable housekeeping genes are
Expression of the mmp gene was suppressed in both
isolates 12146 and 8819 as a reaction to a low pH. In 8672
isolate mmp expression did not differ from the control sample.
The mmp gene encodes a 35kDa major membrane protein (4,
5). Its transcription increases under high osmolarity and low
oxygen tension, while no transcription occurs when exposed to
acidic pH or standard aerobic growth conditions (5).Generally,
8819 isolate did not response at all under pH stress, while
12146 showed the highest number of up-regulated genes.
In all three MAP isolates, different genes were
down-regulated under temperature stress. The transcription of sigL
was suppressed under 6°C in both 8672 and 8819. SigL belongs
to a family of transcriptional regulators. Hahn et al. (17)
suggested sigL regulates the synthesis of cell envelope lipids
and is responsible for the modification of secreted proteins in
M. tuberculosis. They also found, sigL does not play a role in
responding to oxidative stress. In MAP, two (8672 and 8819;
Fig. 2) of three isolates showed decreased expression of sigL
after cold shock. Also, it seems, sigL is not affected in by heat
shock (45°C), acidic pH, and hyperosmolarity in M.
tuberculosis (9). According to this study, higher temperature
did not lead to changes in sigL expression in any of MAP
isolates (Fig. 2).
45°C heat shock led to lower expression of sigF in a
M. smegmatis study using the -galactosidase enzyme as a
reporter gene, whereas cold shock (15°C) led to higher
expression of sigF when compared to the control (39). In
M. tuberculosis, Manganelli et al. (23) observed no variation in
the transcriptional level of sigF after cold shock, which is in
contrast with the study of DeMaio et al. (10) who found
up-regulation of sigF after cold shock in M. bovis BCG. In this
study with MAP isolates, it seems, cold temperature leads to
up-regulation of sigF (MAP isolates 8672 and 8819; Fig. 2)
rather than to its down-regulation.
Under high temperature stress (65°C), the increased
transcription of genes sigF and sigE was observed in isolates
8672 and 8819. The up-regulation of sigE has been observed
after heat shock previously (23, 36). Wu et al. (46) describe the
role of sigE in MAP virulence and pathogenesis, as this gene
was co-regulated with a large number of other highly regulated
genes. At 65°C, the transcription of ahpC and ahpD was also
increased in isolate 8672. In isolate 12146, expression of ahpC
was very slightly below the level of a two-fold change
expression (1.95; Fig. 2). AhpC and ahpD genes encode
detoxifying enzymes used for the protection against reactive
nitric and oxidative metabolites. Olsen et al. (30), nevertheless,
described a strong expression of the ahp genes in vitro without
the bacteria being exposed to any oxidative stress.
The expression profiles of all three tested strains were
different. The high passage isolate No. 12146 responded
mostly to the acid treatment, when compared to the other two
low passage MAP isolates. On the contrary, a relatively low
change in 12146 gene expression during temperature stress was
observed (Fig. 2). Sung and Collins (41) observed that a higher
proportion of low passage MAP clinical isolates were sensitive
to heat when compared to high passage strains. Thus, the
temperature resistance of 12146 isolate (Tab. 2) rather reflects
higher number of its previous passages than its real feature. On
the contrary, isolate No. 8672 and 8819 mostly responded to
temperature stress, while only a limited response to lactic acid
stress was noticed (Fig. 2). As both 8672 and 8819 isolates
went through preceding cultivation only once, a weaker
reaction to acidic stress (Tab. 2, Fig. 2) could indicate a real
level of their acid tolerance. As both these isolates originated
from animals with manifested paratuberculosis, this feature
could correspond with their pathogenesis and higher level of
virulence.
This paper investigates the effect of temperature and pH
stress on the expression of selected MAP genes connected to
virulence and pathogenesis. Using three MAP isolates, various
levels of gene expression for different genes were obtained, but
certain similar patterns in expression were observed. Generally,
the transcription of sigF was up-regulated under 6°C, while the
temperature stress (65°C), the expression of sigE and ahpC
were found to be over-expressed comparing to control samples.
Under acidic conditions, the expression of gene encoding the
major membrane protein (mmp) was found to be decreased.
Dissimilarities in gene expression in various MAP isolates most
probably corresponded with the number of previous
cultivations. Nevertheless, certain level of acid resistance was
shown in low passage 8672 and 8819 isolates.
ACKNOWLEDGEMENTS
The authors would like to especially thank Dr. Tim Bull
(Department of Cardiovascular Sciences-Surgery, St. George’s
Hospital Medical School, London, UK) for providing the
method for RNA isolation. Also we thank to Vladimir Grof
(Veterinary Research Institute, Brno, Czech Republic) for
helping with pictures. This work was supported by the Ministry
of Agriculture, Czech Republic grant No. MZE0002716202
and QH81065, the Ministry of Education, Youth and Sports of
the Czech Republic (project AdmireVet No.
CZ.1.05/2.1.00/01.0006-ED 0006/01/01) and by the EC project
FOOD-CT-2005-007081 (PathogenCombat).
REFERENCES
1. Abubakar, I.; Myhill, D.J.; Hart, A.R.; Lake, I.R.; Harvey, I.; Rhodes, J.M.; Robinson, R.; Lobo, A.J.; Probert, C.S.J.; Hunter, P.R. (2007). A case-control study of drinking water and dairy products in Crohn's disease – further investigation of the possible role of Mycobacterium avium paratuberculosis. Am. J. Epidemiol. 165, 776–783.
2. Alwine, J.C.; Kemp, D.J.; Stark, G.R. (1977). Method for detection of specific RNAs in agarose gels by transfer to diazobenzyloxymethyl-paper and hybridization with DNA probes. P. Natl. Acad. Sci. USA 74, 5350–5354.
3. Ayele, W.Y.; Machackova, M.; Pavlik, I. (2001). The transmission and impact of paratuberculosis infection in domestic and wild ruminants. Veterinarni Medicina 46, 205–224.
4. Banasure, K.D.; Basagoudanavar, S.H.; Chaudhury, P.; Tiwari, V.; Parihar, N.S.; Goswami, P.P. (2001). Identification and characterization of a gene encoding a 35-kDa protein from Mycobacterium avium
subspecies paratuberculosis. FEMS Microbiol. Lett. 196, 195–199. 5. Bannantine, J.P.; Huntley, J.F.J.; Miltner, E.; Stabel, J.R.; Bermudez,
L.E. (2003). The Mycobacterium avium subsp paratuberculosis 35 kDa protein plays a role in invasion of bovine epithelial cells. Microbiol.-SGM 149, 2061–2069.
6. Berk, A.J.; Sharp, P.A. (1977). Sizing and mapping of early adenovirus mRNAs by gel electrophoresis of S1 endonuclease-digested hybrids. Cell 12, 721–732.
7. Bull, T.J.; McMinn, E.J.; Sidi-Boumedine, K.; Skull, A.; Durkin, D.; Neild, P.; Rhodes, G.; Pickup, R.; Hermon-Taylor, J. (2003). Detection and verification of Mycobacterium avium subsp. paratuberculosis in fresh ileocolonic mucosal biopsy specimens from individuals with and without Crohn's disease. J. Clin. Microbiol. 41, 2915–2923.
8. Cheng, J.; Bull, T.J.; Dalton, P.; Cen, S.; Finlayson, C.; Hermon-Taylor, J. (2005). Mycobacterium avium subspecies paratuberculosis in the inflamed gut tissues of patients with Crohn's disease in China and its potential relationship to the consumption of cow's milk: A preliminary study. World J. Microb. Biot. 21, 1175–1179.
9. Dainese, E.; Rodrigue, S.; Delogu, G.; Provvedi, R.; Laflamme, L.; Brzezinski, R.; Fadda, G.; Smith, I.; Gaudreau, L.; Palu, G.; Manganelli, R. (2006). Posttranslational regulation of Mycobacterium tuberculosis extracytoplasmic-function sigma factor sigma(L) and roles in virulence and in global regulation of gene expression. Infect. Immun. 74, 2457– 2461.
10. DeMaio, J.; Zhang, Y.; Ko, C.; Young, D.B.; Bishai, W.R. (1996). A stationary-phase stress-response sigma factor from Mycobacterium tuberculosis. P. Natl. Acad. Sci. USA 93, 2790–2794.
11. Glawischnig, W.; Steineck, T.; Spergser, J. (2006). Infections caused by Mycobacterium avium subspecies avium, hominissuis, and paratuberculosis in free-ranging red deer (Cervus elaphus hippelaphus) in Austria, 2001-2004. J. Wildlife Dis. 42, 724–731.
12. Granger, K.; Moore, R.J.; Davies, J.K.; Vaughan, J.A.; Stiles, P.L.; Stewart, D.J.; Tizard, M.L.V. (2004). Recovery of Mycobacterium avium subspecies paratuberculosis from the natural host for the extraction and analysis in vivo-derived RNA. J. Microbiol. Meth. 57, 241–249. 13. Grant, I.R. (2005). Zoonotic potential of Mycobacterium avium ssp
paratuberculosis: the current position. J. Appl. Microbiol. 98, 1282– 1293.
14. Grant, I.R.; Ball, H.J.; Rowe, M.T. (1999). Effect of higher pasteurization temperatures, and longer holding times at 72 degrees C, on the inactivation of Mycobacterium paratuberculosis in milk. Lett. Appl. Microbiol. 28, 461–465.
16. Grant, I.R.; O'Riordan, L.M.; Ball, H.J.; Rowe, M.T. (2001). Incidence of Mycobacterium paratuberculosis in raw sheep and goats' milk in England, Wales and Northern Ireland. Vet. Microbiol. 79, 123–131. 17. Hahn, M.Y.; Raman, S.; Anaya, M.; Husson, R.N. (2005). The
Mycobacterium tuberculosis extracytoplasmic-function sigma factor SigL regulates polyketide synthases and secreted or membrane proteins and is required for virulence. J. Bacteriol. 187, 7062–7071.
18. Hasonova, L.; Pavlik, I. (2006). Economic impact of paratuberculosis in dairy cattle herds: a review. Veterinarni Medicina 51, 193–211. 19. Heym, B.; Zhang, Y.; Poulet, S.; Young, D.; Cole, S.T. (1993).
Characterization of the katG gene encoding a catalase-peroxidase required for the isoniazid susceptibility of Mycobacterium tuberculosis. J. Bacteriol. 175, 4255–4259.
20. Kumar, A.; Bose, M.; Brahmachari, V. (2003). Analysis of expression profile of mammalian cell entry (mce) operons of Mycobacterium tuberculosis. Infect. Immun. 71, 6083–6087.
21. Kumar, A.; Chandolia, A.; Chaudhry, U.; Brahmachari, V.; Bose, M. (2005). Comparison of mammalian cell entry operons of mycobacteria: in silico analysis and expression profiling. FEMS Immunol. Med. Mic. 43, 185–195.
22. Li, L.L.; Bannantine, J.P.; Zhang, Q.; Amonsin, A.; May, B.J.; Alt, D.; Banerji, N.; Kanjilal, S.; Kapur, V. (2005). The complete genome sequence of Mycobacterium avium subspecies paratuberculosis. P. Natl. Acad. Sci. USA 102, 12344–12349.
23. Manganelli, R.; Dubnau, E.; Tyagi, S.; Kramer, F.R.; Smith, I. (1999). Differential expression of 10 sigma factor genes in Mycobacterium tuberculosis. Mol. Microbiol. 31, 715–724.
24. Manning, E.J.; Collins, M.T. (2001). Mycobacterium avium subsp. paratuberculosis: pathogen, pathogenesis and diagnosis. Rev. Sci. Tech. OIE 20, 133–150.
25. Mekalanos, J.J. (1992). Environmental signals controlling expression of virulence determinants in bacteria. J. Bacteriol. 174, 1–7.
26. Nakase, H.; Nishio, A.; Tamaki, H.; Matsuura, M.; Asada, M.; Chiba, T.; Okazaki, K. (2006). Specific antibodies against recombinant protein of insertion element 900 of Mycobacterium avium subspecies paratuberculosis in Japanese patients with Crohn's disease. Inflamm. Bowel Dis. 12, 62–69.
27. Naser, S.A.; Ghobrial, G.; Romero, C.; Valentine, J.F. (2004). Culture of Mycobacterium avium subspecies paratuberculosis from the blood of patients with Crohn's disease. Lancet 364, 1039–1044.
28. Nocker, A.; Cheung, C.Y.; Camper, A.K. (2006). Comparison of propidium monoazide with ethidium monoazide for differentiation of live vs. dead bacteria by selective removal of DNA from dead cells. J. Microbiol. Meth. 67, 310–320.
29. Okubo, K.; Hori, N.; Matoba, R.; Niiyama, T.; Fukushima, A.; Kojima, Y.; Matsubara, K. (1992). Large scale cDNA sequencing for analysis of
quantitative and qualitative aspects of gene expression. Nat. Genet. 2, 173–179.
30. Olsen, I.; Reitan, L.J.; Holstad, G.; Wiker, H.G. (2000). Alkyl hydroperoxide reductases C and D are major antigens constitutively expressed by Mycobacterium avium subsp paratuberculosis. Infect. Immun. 68, 801–808.
31. Paustian, M.L.; Kapur, V.; Bannantine, J.P. (2005). Comparative genomic hybridizations reveal genetic regions within the Mycobacterium avium complex that are divergent from Mycobacterium avium subsp paratuberculosis isolates. J. Bacteriol. 187, 2406–2415.
32. Pfaffl, M.W. (2001). A new mathematical model for relative quantification in real-time RT-PCR. Nucleic Acids Res. 29, e45. 33. Plum, G.; Brenden, M.; Clark-Curtiss, J.E.; Pulverer, G. (1997). Cloning,
sequencing, and expression of the mig gene of Mycobacterium avium, which codes for a secreted macrophage-induced protein. Infect. Immun. 65, 4548–4557.
34. Plum, G.; Clarkcurtiss, J.E. (1994). Induction of Mycobacterium avium gene expression following phagocytosis by human macrophages. Infect. Immun. 62, 476–483.
35. Rozen, S.; Skaletsky, H. (2000). Primer3 on the WWW for general users and for biologist programmers. In: Misener, S.; Krawetz, S.A. (eds). Methods in Molecular Biology, vol. 132: Bioinformatics Methods and Protocols. Humana Press Inc., Totowa NJ, USA, p. 365–386.
36. Sechi, L.A.; Felis, G.E.; Ahmed, N.; Paccagnini, D.; Usai, D.; Ortu, S.; Molicotti, P.; Zanetti, S. (2007). Genome and transcriptome scale portrait of sigma factors in Mycobacterium avium subsp. paratuberculosis. Infect. Genet. Evol. 7, 424–432.
37. Sechi, L.A.; Scanu, A.M.; Molicotti, P.; Cannas, S.; Mura, M.; Dettori, G.; Fadda, G.; Zanetti, S. (2005). Detection and isolation of Mycobacterium avium subspecies paratuberculosis from intestinal mucosal biopsies of patients with and without Crohn's disease in Sardinia. Am. J. Gastroenterol. 100, 1529–1536.
38. Shin, S.J.; Wu, C.W.; Steinberg, H.; Talaat, A.M. (2006). Identification of novel virulence determinants in Mycobacterium paratuberculosis by screening a library of insertional mutants. Infect. Immun. 74, 3825–3833. 39. Singh AK, Singh BN (2008). Conservation of sigma F in mycobacteria
and its expression in Mycobacterium smegmatis. Curr. Microbiol. 56: 574–580.
40. Slana, I.; Kralik, P.; Kralova, A.; Pavlik, I. (2008). On-farm spread of Mycobacterium avium subsp paratuberculosis in raw milk studied by IS900 and F57 competitive real time quantitative PCR and culture examination. Int. J. Food Microbiol. 128, 250–257.
41. Sung, N.; Collins, M.T. (1998). Thermal tolerance of Mycobacterium paratuberculosis. Appl. Environ. Microb. 64, 999–1005.
quantitative RT-PCR data by geometric averaging of multiple internal control genes. Genome Biol. 3, 0034.1–0034.11.
43. Velculescu, V.E.; Zhang, L.; Vogelstein, B.; Kinzler, K.W. (1995). Serial analysis of gene expression. Science 270, 484–487.
44. Waagmeester, A.; Thompson, J.; Reyrat, J.M. (2005). Identifying sigma factors in Mycobacterium smegmatis by comparative genomic analysis. Trends Microbiol. 13, 505–509.
45. Weiss, D.J.; Evanson, O.A.; Deng, M.; Abrahamsen, M.S. (2004). Gene expression and antimicrobial activity of bovine macrophages in response to Mycobacterium avium subsp paratuberculosis. Vet. Pathol. 41, 326– 337.
46. Wu, C.W.; Schmoller, S.K.; Shin, S.J.; Talaat, A.M. (2007). Defining the stressome of Mycobacterium avium subsp. paratuberculosisin vitro and
in naturally infected cows. J. Bacteriol. 189, 7877–7886.
47. Xiang, Z.Y.; Yang, Y.N.; Ma, X.J.; Ding, W. (2003). Microarray expression profiling: Analysis and applications. Curr. Opin. Drug Disc. 6, 384–395.
48. Yang, I.V.; Chen, E.; Hasseman, J.P.; Liang, W.; Frank, B.C.; Wang, S.; Sharov, V.; Saeed, A.I.; White, J.; Li, J.; Lee, N.H.; Yeatman, T.J.; Quackenbush, J. (2002). Within the fold: assessing differential expression measures and reproducibility in microarray assays. Genome Biol. 3, 0062.
49. Zhang, A. (2006). Data normalization – Global normalization approaches. In Zhang, A., (ed). Advanced analysis of gene expression microarray data. World Scientific Publishing Co., Hackensack, NJ, USA, p. 46–47.