ISSN 1553-345X
© 2007 Science Publications
Corresponding Author: Abdel Ghaly, Professor, Department of Process Engineering and Applied Science, Dalhousie University, Halifax Nova Scotia, Canada; Tel: (902) 494-6014
247
Effect of Mixing on the Biological Degradation of Toluene under Aerobic Conditions
A.E. Ghaly, D.G. Rushton and K. Martinell Department of Process Engineering and Applied Science Dalhousie University Halifax, Nova Scotia Canada B3J 2X4
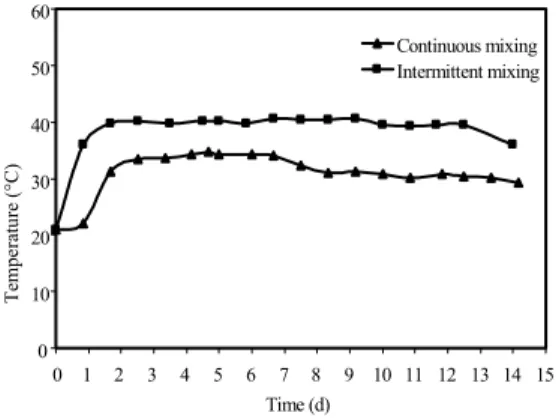
Abstract: The effectiveness of in-vessel bioremediation in reducing the concentration of toluene in contaminated soil under continuous and intermittent mixing conditions using invessel composting system. The results showed that there was a startup period (60 h) during which the average temperature rose from 21 to 32 and 40°C (and then remained constant) for the bioreactors with continuous and intermittent mixing, respectively. The increase in the temperature demonstrated the conversion of the complex organic carbon into H2O, CO2 and energy during mineralization (cell respiration process) of
carbon. The lower temperature of the bioreactor with continuous mixing (8-9°C) mixing during the steady state period indicating that more heat was lost with exhaust gas from this bioreactor. Little changes were observed in the moisture contents of the mixture. Most of the moisture losses were through the exhaust gas. The analysis of the exhaust gas samples did not show identifiable toluene peaks but some unidentifiable peaks were present. By day 15, about 96.35 and 89.07 % of the initial toluene were removed by the bioreactors with intermittent and continuous mixing, respectively. These results indicate that in addition to reducing the energy requirement by 50 %, the bioreactor with intermittent mixing also reduces the time required for complete degradation. This method of bioremediation is very effective in removing toluene but the production of toluene derivatives during the biodegradation process should be investigated.
Key words: Toluene, bioremediation, biological degradation, mixing, aerobic condition
INTRODUCTION
Managing contaminated soils with petroleum hydrocarbons (PHCs) is a common problem. These organic compounds reach soil through spills, leaks from underground tanks and from production, storage and disposal facilities[1]. Traditionally, the approach to remediating contaminated soil has been containment or excavation and transport to a landfill[2-5]. In most cases, this approach simply does not resolve the problem and the contaminants continue to be present on the site. Soil consists of four phases (Fig. 1) gas phase (15 – 35 %) water phase (15 – 35 %), inorganic solids phase (38 – 45 %) and organic solids phase (5 – 12 %). PHCs could be distributed among the four phases in relation to their volatility, solubility and ion exchange capacity[6]. When released in large quantities at the soil surface, PHCs will penetrate the soil surface and saturate the pores in the soil. The movement of these contaminants through the subsurface layer of the soil is largely governed by the processes of advection, dispersion, sorption and transformation[7]. The movement of contaminants
within the soil is also affected by the soil characteristics at the site, the concentration of the contaminant and the contaminant characteristics. Eventually, these contaminants will reach surface and ground water causing environmental and health problems. The short term human and environmental health effects of PHCs include acute toxicity to aquatic organisms and skin irritation and itchy eyes at low concentrations to humans. At high concentrations, damage can be done to the liver, lungs, kidneys and nervous system leading to cancer and immunological, reproductive, fetotoxic and genotoxic effects[6,8-9].
Fig. 1: Soil phases
Table 1: Tier I risk based screening level for soil[12]
Receptor Groundwater Use
Soil Type
Compound of Concern in Soil (mg/kg)
Benzene Toluene Ethyl
Benzene Xylenes
Modified TPH
Gas Diesel/#2 #6 oil
Residential
Potable Coarse 0.03 0.38 0.08 11 39 140 690
Fine 0.01 0.08 0.02 2.3 140 220 970
Non-potable Coarse 0.16 14 58 17 39 140 690
Fine 1.5 120 430 160 330 4400 8300
Commercial
Potable Coarse 0.03 0.38 0.08 11 450 7400 10000
Fine 0.01 0.08 0.02 2.3 520 840 4700
Non-potable Coarse 1.8 160 430 200 450 7400 10000
Fine 11 680 430 650 10000 7700 10000
al.[12] evaluated the current remediation methods for oil contaminated soils. These methods include: physical (soil washing and landfilling), chemical, thermal (incineration, thermal desorption and radio frequency heating) and biological (landfarming, biopiling, composting, bioventing and liquid delivery systems). The study concluded that in order to achieve a complete petroleum hydrocarbon removal, a biological remedial process and a bioreactor should be used.
Toluene is commonly used as an additive in gasoline and as a solvent in paints, cleaners, adhesives, inks and coatings[9]. Of the primary constituents of gasoline (benzene, toluene, ethylbenzene and xylene), toluene is the second- most mobile in water systems[13]. Toluene is a colorless liquid with a sweet odor at room temperature. Its physical-chemical properties are listed in Table 2. Toluene primarily causes central nervous
system disorders. In the short term, it can cause fatigue, nausea, weakness and confusion. Long term exposure to toluene can result in spasms, tremors, memory and/or coordination impairment, as well as liver and kidney damage[9]. Martinell[14] suggested the use of biological treatment as a tool for the treatment of soil contaminated with toluene.
Table 2: Physical-chemical properties of toluene[11,19]
degradation of toluene. Davis and Madsen[16] reported that the degradation of toluene in soil depends on the moisture content, microbial activity, bioavailability of nutrients and the initial concentration of toluene. Lee et al. [17] found that the transfer rate of oxygen is the most important limitation for toluene degradation under aerobic conditions.
The aim of this study was to evaluate the effectiveness of in-vessel bioremediation in reducing the concentration of toluene in contaminated soil under continuous and intermittent mixing conditions.
MATERIALS AND METHODS
Experimental apparatus: The experimental setup shown in Fig. 2 consists of a bioreactor, a mixing unit, an air supply and a temperature measurement and recording unit. The bioreactor was constructed of 6.4 mm thick stainless steel. The sides of the bioreactor measured 340 mm x 280 mm with a radius of 150 mm at the lower end. The lid (340 mm x 800 mm) had 4 hinges on one side and could be clamped down on the opposite side by 4 locking clamps. There was a rubber gasket around the opening to provide a good seal and prevent gas leakages. The bioreactor was insulated with a 25.4 mm thick Styrofoam layer to minimize heat losses. There were three holes at the bottom of the bioreactor used for aeration. The lid had three 60 mm holes which were used as sampling ports and were covered during the operation with rubber stoppers. Inside the reactor, a 6.4 mm diameter stainless steel shaft was mounted on two bearings. There were five stainless steel collars on the shaft in which five 101.6 mm long bolts were mounted to provide mixing. The mixing shaft was rotated by a permanent
magnet-variable speed (0-250 rpm), ¾ ph electric motor (Model No. 2X846, D.C., Dayton Electric manufacturing Company, Chicago, Illinois), which is coupled directly to a gearbox (Model No. 4Z295B, Dayton Electric Manufacturing Company, Chicago, Illinois) of a 30:1 gear reduction ratio. The speed of the motor was controlled by a speed controller (Model No. 60648, Dayton Electric Manufacturing Company, Chicago, Illinois).
Fig. 2: Experimental apparatus
Air was supplied to the bioreactor by a ¾ hp compressor (Model No. M01 FC75-7.5, Sanborn, Markham, Ontario) with an airflow regulated at 2.5 L/min. The air was passed through a 4.38 L plexiglas canister (35 cm in height x 15 cm in diameter) filled with hydroscopic silica gel (Type 3-8 mesh-ACS Grade, Fisher Scientific, Fair Lawn, New Jersey) which removed the moisture from air. The dry air was then passed through a flow meter (Model No. N103-5G, Cole Parmer, Chicago, Illinois) and then to a manifold which was connected to the holes at the bottom of the bioreactor by 6.4 mm diameter tubing. The condensate from the saturated exhaust gas was collected in a 0.63 L plexiglass water trap. The exhaust gas was then dried in another 4.38 L plexiglas canister (35 cm in height x 15 cm in diameter filled with hydroscopic silica gel (Type 3-8 mesh-ACS Grade, Fisher Scientific, Fair Lawn, New Jersey). Two rubber septums were located on the air inlet and exhaust outlet lines for air/gas sampling. Temperatures were measured using 10 thermocouples (Model No. LM 35C2, National Semiconductor, Chicago, Illinois). The locations of the thermocouples are shown in Fig. 2. The thermocouples T1-T3 were used to measure the temperature at the Parameters Value
Fluid Density (g/cm3) 0.867
Water Solubility (g/L at 25°C) 0.530 Vapor Pressure (mm Hg) 28.400 SurfaceTension (dyne/cm at 20°C) 28.520 Dynamic Viscosity (at 20°C) 0.631 Molecular weight (g/mol) 92.000
Molecular formula C7H8
center of the reactor. The thermocouples T4-T6 were located on the front wall of the bioreactor while thermoucouples T7-T9 were located on the back wall of the bioreactor. The thermocouple T10 was used to measure the ambient air temperature. All thermocouples were linked to a data logger (Model No. 1000, Omega Tempscan Engineering, Stamford, Connecticut) which was connected to a microcomputer.
The temperature sensors were calibrated using ice and boiling water bathes. The thermocouples including the fittings were immersed into the ice bath and hooked up to the data acquisition system individually. The thermocouple readings were corrected to read zero °C (offset). They were then immersed into the boiling water bath to correct the upper limit. Before each run, temperature sensors were tested for 24 hours in an empty bioreactor and the temperature readings were always within ± 0.5 °C of the reactor temperature (measured with thermometer), which is within the accuracy range of the thermocouple.
Materials: In this study, soil, wood shavings, compost, urea, used cooking oil and toluene were used. The soil was obtained from Prince Edward Island. It was collected with a shovel at a depth of 60 cm and placed in heavy duty (0.6 mm thick) polyethylene bags. Particle size distribution was performed on the soil using the mechanical method recommended by Black et al.[18]. The soil was characterized as silty sand, with most particles in the fin sand range. The soil had a coarse texture with an effective grain size of 0.08 mm and a moisture content of 20 %.
Wood shavings were used as the bulking agent for this process. They were collected from a wood lumber mill in Sackville, Nova Scotia in small polyethylene bags (~5 kg). Compost was used as an inoculum to increase the initial microbial population and to introduce a wide range of active microorganisms. A 15-day old municipal solid waste compost was obtained from a municipal solid waste composting facility operated by Miller Composting Corporation in Dartmouth, Nova Scotia.
Urea [CO(NH2)2] was added as a nitrogen source.
It was used to adjust the C:N ratio to 30:1. The choice of urea was based on the work by Ghaly and Pyke[15] and Alkoaik and Ghaly[1] which indicated that it is an
effective source of nitrogen in initiating and maintaining intense respiratory activity. It was purchased from Halifax Seed Company in Halifax, Nova Scotia. Used cooking oil was obtained from a local fast food restaurant in Halifax, Nova Scotia. It was used to provide bio-available carbon as recommended by Alkoaik and Ghaly[1]. Table 3 describes characteristics of the materials.
Mixture preparation: The volume of the bioreactors is approximately 133 L. The optimum loading for this particular bioreactor is about 75 % of the total volume (100 L). The ratio of soil to bulking agent reported in the literature varied from 1:3[19] to 1:1[1]. Therefore, a soil: bulking agent (by volume) of 1:2 was chosen. Alkokaik and Ghaly[20] and Namkoong et al. [21] showed that a 50 % inoculum size (by volume of the soil) achieved the greatest rates of microbial degradation. Therefore, the soil: wood shavings: compost ratio was set at 1:2:0.5. This amounts to approximately 28 L of soil, 56 L of wood shavings and 14 L of compost.
Alkoaik and Ghaly[1] recommended the addition of 36 mL of cooking oil per kg (dry weight) of the composting mix. The required cooking oil was estimated to be 1.667 L. The composition of the mixture is shown in Table 4. The moisture content and C: N of the initial mixture were found to be 24.23 % and 201:1, respectively. The moisture content was brought to 60 % by adding water to the mixture and the C: N ratio was adjusted to 30:1 by the addition of urea. The quantity of nitrogen and water required were calculated as follows:
Nitrogen required = (total carbon / desired C: N) – total available nitrogen (1)
) MC 1 (
) MC 1 ( ) 1 MC ( DW MC MC Required Water
2
1 2
1 2
−
− − +
= (2)
Where:
MC1 is the initial moisture content (%) MC2 is the final moisture content (%) DW is the dry weight (kg)
Table 3: Characteristics of soil, wood shavings, municipal solid compost, urea and used cooking oil
Characteristic Soil Wood
shavings
Municipal compost
Urea
Used cooking oil
Moisture content (%) 20 8.0 58.6 0.0
Total solids (mg/g DM)
Volatile solids * 264 997.4 854.6 999.45
Ash 736 3.0 145.4 0.55
Nitrogen (mg/g DM)
Total Kjeldahl nitrogen 2.0 2.0 18.0 466.6 0.22
Ammonium nitrogen 0.12 0.2 5.2
Carbon (mg/g DM)
Total 99.0 490.0 440.0 200.0 820
Organic 55.0 390.0 350.0 200.0 820
Elemental composition (mg/g DM)
B 0.2
Ca 0.1 0.8 20.0 0.06
Cu 0.7
Na 0.2 0.0 6.2 0.30
Fe 0.9 0.0 2.8 1.2 0.14
Mg 0.7 0.1 1.8 0.5 0.01
Zn 0.2 0.0 0.1 0.3 0.00
K 0.2 0.6 7.8 0.01
Cl 0.1 0.0 0.3 0.74
P 0.9 0.0 2.7 0.01
S 2.9 0.9 2.3 2.32
Others ** 724.8 0.6 101.4 0.16
C:N 47:1 223:1 19:1 1:2.33 3727:1
* Volatile solids are the organic matter, largely carbon, oxygen, hydrogen, nitrogen and sulfur ** Others include other elements that were not identified; mostly silica in the case of soil
Table 4: The constituents of the mixture used in this experiment
Item Soil Wood Shavings Compost Used Oil Total
Volume (L) 28.0 56.0 14.0 1.67 99.67
Density (kg/L) 1.4 0.2 0.8 0.93 0.63
Wet weight (kg) 39.2 11.2 11.2 1.55 63.15
Moisture content (%) 20.0 8.0 58.6 0.0 24.23
Dry weight (kg) 31.4 10.3 4.6 1.55 47.85
C:N 47:1 223:1 19:1 3727:1 201:1
Experimental procedure: The airflow and mixing speed were adjusted to 2.5 L/min (1.5 v/v/h) and 25 rpm, respectively. The reactor temperatures were recorded on an hourly basis for the duration of the experiment. Gas samples were taken on a daily basis from the inlet air and exhaust gas streams using syringes and evacuated vials. These samples were stored at room temperature until the time of analysis. Samples were also taken on a daily basis from the mixture for moisture content and toluene analyses. The samples were collected by scooping approximately 50 mL of materials into glass bottles. The bottles were capped and refrigerated until needed for analysis.
The experiment was repeated with intermittent mixing so as to reduce toluene, moisture and energy losses with the exhaust gas. A timer (Model No. 4M, Dayton Electric Manufacturing Company, Chicago, Illinois) was attached to the gearbox and was set to turn the motor on for one hour and off for one hour for the duration of the experiment. The airflow rate and mixing
speed were maintained at 2.5 L/min at 25 rpm, respectively.
During the preliminary experiments, it was noticed that on day 9 the temperature seemed to be dropping too much. Thus, 544 mL of used cooking oil was added to the mixture. The same amount of oil was added to the mixture on day 13 as well. This quantity was based on that used by Alkoaik and Ghaly[1] to maintain thermophilic temperature during their composting process.
Ultimate analysis: Ultimate analysis was performed to determine the elemental composition of the soil, wood shavings, municipal solid waste compost and oil samples. The weight fractions of carbon, hydrogen, nitrogen, sulfur, chlorine and ash were determined and the weight fraction of oxygen in the samples was calculated by the difference. Carbon, hydrogen and nitrogen weight fractions were determined using a Perkin-Elmer LECO CHN Elemental Analyzer (Model No. 240, International Equipment Company, Needham Heights, Massachusetts). Sulfur was determined using the LECO induction furnace (LECO S-Analyzer, International Equipment Company, Needham Heights, Massachusetts). Chlorine was determined by following the Mercuric Nitrate Method given in Standard Methods for the Examination of Water and Wastewater[24]. The ASTM Standard Test Method for Ash in Wood (D-1102-84) was followed to determine the ash percentage in the peat sample[23]. Because of the lack of a simple, direct method for determining oxygen in biomass fuels, it is usually estimated by subtracting the sum of carbon, hydrogen, nitrogen, sulfur, chlorine and ash from 100.
Moisture content: Moisture content tests were performed on the samples by the oven drying method, according to the ASTM D 3173-73 procedure[23]. Samples weighing approximately 4 to 5 g each were placed in large aluminum dishes. The dishes containing the samples were placed in an air forced drying oven (Isotemp Oven Model No. 655F, Fisher Scientific, Toronto, Ontario) at 105°C for at least 24 hours. The moisture content of the samples was then calculated on wet basis as follows:
100 WW
) DW WW (
MC= − × (3)
Where:
MC is the moisture content on wet basis (%)
WW is the wet weight of the sample (kg) DW is the dry weight of the sample (kg)
Moisture loss: The moisture losses were monitored in two parts: (a) the portion collected by the desiccant and (b) the portion collected in the water trap. The moisture absorbed by the desiccant was calculated by subtracting the mass of the desiccant before starting the experiment from its mass following the experimental run. The water collected in the water trap was measured and added to the amount absorbed. The total accounted for total moisture losses.
Toluene: The toluene contents in the exhaust gas and the mixture were determined using a gas chromatograph (Model No. 5890-SII, Hewlett Packard, Atlanta, Georgia). The gas chromatograph was calibrated by injecting 1.0 µL of the hexane extracted mixture onto a 25 m x 0.2 mm, 0.33 µm film thickness, 5 % diphenyl siloxane megabore capillary column. A split ratio of 5:1 was employed using the split mode of the injection port. The injection port was set at 180°C and the flame ionization detector was set at 250°C. The oven containing the column was first maintained at 40°C for 4 minutes and then increased at a rate of 10°C/min until a final temperature of 350°C was reached. This final temperature was held for 5 minutes. The carrier gas, helium, was held at a flow rate of 1.2 mL/min. In order to perform this analysis on the soil samples, hexane extraction had to be performed on the mixture samples first.
RESULTS AND DISCUSSION
Temperature: The temperature measurements obtained from the nine thermocouples indicated that the bioreactor had a homogeneous temperature distribution; the variations in the temperature were very small (coefficient of variation was in the range of 2 %). The measured temperatures for each experiment were averaged and the average temperatures were plotted versus time as shown in Fig. 3.
0 10 20 30 40 50 60
0 1 2 3 4 5 6 7 8 9 10 11 12 13 14 15 Time (d)
T
em
p
er
atu
re (
°C)
Continuous mixing Intermittent mixing
to rise in the bioreactor with continuous mixing. Thus, the steady state condition was reached after 64 h for the bioreactor with continuous mixing due to the initial lag period of 24 h. The temperature of the bioreactor with continuous mixing was 8-9°C lower than that of the bioreactor with intermittent mixing during the steady state period indicating that more heat was lost with exhaust gas from the bioreactor with continuous mixing. The rise in the temperature during the startup period can be described as a function of the initial temperature (21°C) by the following equations:
Continuous mixing:
Tt = 21e0.008t (R2 = 0.89) (4)
Intermittent mixing:
Tt = 21e0.0134t (R2 = 0.61) (5)
Where:
Tt is the temperature at a time t during the startup
period (°C) t is the time (hr)
The increase in the temperature demonstrated the conversion of the complex organic carbon into H2O,
CO2 and energy during mineralization (cell respiration
process) of carbon. A part of energy is needed for work done within the cell in synthesizing substances and structural cell parts (enzymes, proteins, cell wall, etc.) and for growth and multiplication whereas the rest is converted to heat[25]. The energy production and cell growth can be described as follows:
Cell respiration and energy production
CxHyOz + O2→ CO2 + H2O + Energy (6)
Cell growth
CxHyOz + NH4→ C5H7O2N (7)
microbes
Mixing or agitating of a solid mixture with a forced aeration enhances air/liquid exchange which can lead to increased water and heat losses[26]. Lau et al.[27] found that mixing with forced aeration interfered with temperature increase during composting of swine manure and peat moss. Smårs et al.[28] observed a rise in temperature up to 63°C while composting household waste and chopped wheat straw and used intermittent mixing to regulate the temperature in the bioreactor to 55°C. Cai et al.[29] reported steady state temperatures around 50°C during aerated composting for removal of PAHs.
Moisture content: Moisture can be lost through the exhaust gas or through condensation on reactor walls and then collect in other parts of the reactor[26]. Most of the moisture losses from the current system were
through the exhaust gas. This amounted to 0.636 and 0.257 kg of moisture for the continuous mix and intermittent mix system, respectively. Smårs et al.[28] reported moisture losses due to respiration of 220 g of water per kg of the initial dry weight of the compost material. Rojas-Avelizapa et al.[30] used biopiles to reduce total petroleum hydrocarbons by approximately 94 % in polluted mud by maintaining moisture levels around 30-35 %. While treating soil contaminated with motor oil, Alkoaik and Ghaly[31] reported a decline in the moisture content from the intial value of 60 % to 35 % on day 55. Margesin et al.[32] reported that low moisture levels were more detrimental to system efficiency than that of low temperatures.
The initial moisture content of the mixture was 60 % and the final moisture contents observed in this study were 59.47 and 59.79 % for the bioreactor with continuous mixing and the bioreactor with intermittent mixing, respectively. Even though continuous aeration was supplied, little changes were observed in the moisture contents of the mixture as the final moisture content remained within the optimum range of 50-60 % reported by Lang et al[33]. This could be due to the compensation of water lost in the exhaust by the water produced as a byproduct of the degradation process according to equation (6) as reported by Ghaly and Alkoaik[34]:
Exhaust gas: In addition to monitoring the depletion of the compound of interest, various methods of monitoring biodegradation rates have been reported in the literature. These include parameters such as CO2, O2
and cellular metabolite concentrations[35]. In this study, the initial composition of inlet air (N2, O2, Ar and CO2)
was determined at the start of the experiment whereas the concentrations of O2, CO2, CH4, and C2H6 in the
exhaust gas were determined on a daily basis. The results are shown in Fig. 4. The inlet air had 20.94 % O2, 78.10 % N2, 0.93 % Ar and 0.03 % CO2. For the
bioreactor with intermittent mixing, the oxygen concentration in the exhaust gas declined with time from the initial value of 20.94 % reaching a low value of 7.54 % on day 5 and then started to increase reaching 15.96 % by day 15. The carbon dioxide in this bioreactor increased from the initial value of 0.03 % to a maximum value of 5.79 % on day 5 and then declined reaching 1.60 % by day 15. A peak of C2H6 measuring
0.13 % was observed on day 2 and two peeks of CH4
reaching a maximum value of 3.37 % on day 8 and then declined gradually with time reaching a value of 1.62 % on day 15. The Gas chromatography analysis of the exhaust gas samples did not show identifiable toluene peaks. However, some unidentifiable peaks were present.
0 5 10 15 20 25
0 1 2 3 4 5 6 7 8 9 10 11 1213 14 15 16
Time (d)
C
o
n
c
en
tr
atio
n (
%
)
O2
CO2
(a) Continuous Mixing
0 5 10 15 20 25
0 1 2 3 4 5 6 7 8 9 1011 12 13 14 15 16
Time (d)
C
o
n
c
ent
rat
ion (%)
O2
CO2
CH4
C2H6
(b) Intermittent Mixing
Fig. 4: Concentrations of O2, CO2, CH4 and C2H6 in the exhaust gas
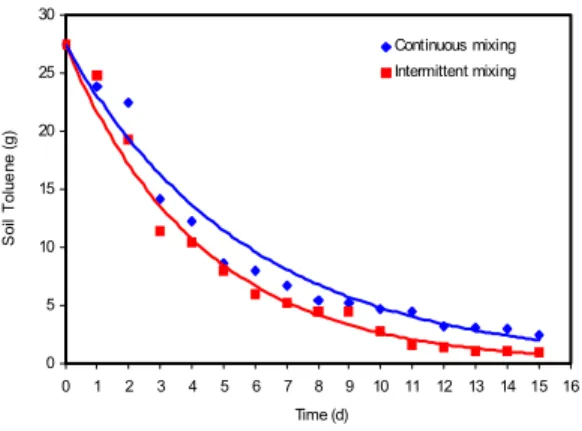
Toluene: Since there was no evidence of toluene volatilization, it can be assumed that the reduction in toluene was due to microbial degradation in the reactor. The toluene concentrations in the bioreactor declined exponentially with time as shown in Fig. 5. The decline of toluene concentration can be described as a function of the initial toluene concentration (27.44 g) by the following equations:
Continuous mixing:
TOt = 27.44e-0.17t (R2 = 0.96) (8)
Intermittent mixing:
TOt = 27.44e-0.24t (R2 = 0.98) (9)
Where:
TO is the toluene concentration at a time t (g) T is the time (d)
0 5 10 15 20 25 30
0 1 2 3 4 5 6 7 8 9 10 11 12 13 14 15 16 Time (d)
S
o
il To
lu
e
n
e
(
g
)
Continuous mixing Intermittent mixing
Fig. 5: Toluene concentration
The toluene degradation constant (K) was 0.17 d-1 for continuous mixing and 0.24 d-1 for intermittent mixing. By day 15, about 96.35 and 89.07 % of the initial toluene were removed by the bioreactors with intermittent and continuous mixing, respectively. These results indicate that in addition to reducing the energy requirement by 50 %, the intermittent mix system also reduces the time required for complete degradation.
conventional composting techniques as higher temperatures can inhibit microbial diversity and reduce system efficiency. In this study, the temperature of40°C, which resulted from intermittent, mixing, appeared to be more suitable for the toluene degrading microorganisms.
There are several pathways for microbial degradation of toluene under aerobic conditions as shown in Fig. 6[41]. In each pathway, a number of intermediate products are produced. Complete mineralization of toluene and its byproducts must take place, results in the production of carbon dioxide, water and energy as follows:
C7H8 + 9 O2→ 7 CO2 + 4 H2O + Energy (10)
In this study, only toluene was monitored in the bioreactors and the exhaust gas. Although no toluene was detected in the exhaust gas, some unidentified peaks were noticed that could possibly be one or more of the intermediate byproducts of the toluene degradation process. There is also the possibility of anaerobic pockets developing during the period of no mixing. He et al.[42] reported anaerobic pockets in their 18 L forced aeration, continuously mixed bioreactor.
According to Beller et al.[43], dead-end breakdown products can be formed rather than complete mineralization, particularly when toluene degrades in anaerobic environments as shown in Fig. 7[41]. These include benzylsuccinic acid and benzylfumaric acid. Gödeke et al.[44] degraded toluene under sulfate-reducing conditions and benzylsuccinate was identified at the site. The unidentifiable peaks shown on the gas chromatographs could also be one or more of these dead-end metabolites.
Several authors reported on the importance of pH, temperature, moisture content, agitation, aeration, C:N ratio and nutrients on the degradation rate of petroleum hydrocarbons. Wang et al.[45] stated that pH, temperature, contact time and initial concentration of petroleum hydrocarbons significantly affected the degradation rate and found a pH of 7, a temperature of 30°C, a minimum residence time of 30 h and an aeration rate of 7 mg O2/L to be optimum conditions for
degrading penthylamine and aniline in petrochemical wastewater. Efremenko et al.[46] found the specific growth rate of petroleum hydrocarbon degrading microorganisms to decrease with increased initial oil
Ps. Mendocina Ps. Pickettii and Ps. Putida Ps. Mendocina
Fig. 7: Anaerobic toluene degradation pathway[43] Marcon et al.[47] found the addition of nutrients to significantly enhance the degradation of polycyclic aromatic hydrocarbons in lagoon sediment. Pala et al.[48] found the biodegradation rate to be affected by pH and the concentrations of N and P in soil. In this study, the moisture content (60 %), C: N ratio (30:1) and pH (6.7-8.0) were within the optimum ranges reported in the literature of 35-70 %, 25:1-35:1 and 6.5-8.5, respectively[49]. The compost provided the necessary micronutrients (B, Ca, Cu, Na, F, Mg, Zn, K, Cl, P, S).
However, the success of bioremediation of soil contaminated with hydrocarbons (contaminant degradation) will depend on the type of microorganisms involved and the transport of substrate and oxygen from the medium to the microorganisms and operating parameters. Table 5 presents a summary of the important parameters and their optimum values.
Table 5: Important parameters and their optimum ranges
Parameter Optimal Values/Rational
Moisture content 35 % - 70 % with 60 % being optimum value
Temperature 10 - 35°C with 25 - 35 dc being optimum range
pH 6.5 - 8.5 with 7 being optimum value
Aeration 0.5 - 3 volume per reactor volume per minute
C:N ratio 25:1 - 35:1 with 30:1 being optimum
Nutrients Trace concentration of Ca, Cl, CO, Cu, Fe, K, Mg, Mn, Mo, Na
Mixing Agitation is needed to ensure uniform distribution of heat, nutrients and moisture
Inoculum
Addition of specific bacterial isolate or compost (10 - 30 %) to provide greater variety of microorganisms in order to shorten the lag period and enhance the degradation rate, provide buffering capacity and improves water holding capacity
Bulking agents
Saw dust, straw, woodchips should be added to provide sufficient voids to ensure better aeration and avoid agglomeration and pellet formation
CONCLUSION
The results showed that there was a startup period (60 h) during which the average temperature rose from 21 to 32°C and 40°C (and then remained constant) for the bioreactors with continuous and intermittent mixing, respectively. The increase in the temperature demonstrated the conversion of the complex organic carbon into H2O, CO2 and energy during mineralization
continuous mixing, respectively. These results indicate that in addition to reducing the energy requirement by 50 %, the intermittent mix system also reduces the time required for complete degradation. This method of bioremediation is very effective in removing toluene but the production of toluene derivatives during the biodegradation process should be investigated.
ACKNOWLEDGEMENT
This study was financially supported by the National Science and Engineering Research Council (NSERC) of Canada.
REFERENCES
1. Alkoaik, F. and A. E. Ghaly, 2006. Influence of dairy manure addition on the biological and thermal kinetics of composting of greenhouse tomato plant residues. Waste Management, 28: 902-913.
2. Bremle, G. and P. Larsson, 1998. PCB in the air during landfilling of contaminated lake sediment. Atmospheric Environment, 32: 1011-1019.
3. Rivett, M. O., J. Petts, B. Butler and I. Martin, 2002. Remediation of contaminated land and groundwater: experience in England and Wales. J. Environ. Manag., 65: 251-268.
4. Anderson, E. I. and E. Mesa, 2006. The effects of vertical barrier walls on the hydraulic control of contaminated groundwater. Advances in Water Resources, 29: 89-98.
5. Swords, C. and J. Strange, 2006. Active containment system for a former industrial site in East London. Engineering Geology, 85: 204-211. 6. Ghaly, R., J. B. Pyke, A. E. Ghaly and I. Ugrsul.
Remediation of diesel contaminated soil using peat. Energy Sources, 2: 785-800.
7. DeVinny, J.S., L.G. Everett, J.C.S. Lu and R.L. Stollar, 1990. Subsurface Migration of Hazardous Wastes, Van Nostrand Reinhold, New York. 8. Irwin, R.J., M. Van Mouwerik, L. Stevens, M.D.
Seese and W. Basham, 1997. Environmental Contaminants Encyclopedia: Diesel Oil. National Park Service, Water Resources Division. Fort Collins, CO. Accessed October, 2006.
9. USEPA 2005. Toxicological Review of Toluene. Environmental Protection Agency, EPA/635/R-05/004,
accessed February, 2007.
10. Harbottle, M.J., A. Al-Tabbaa and C.W. Evans, 2006. A comparison of the technical sustainability of in situ stabilization/solidification with disposal to landfill. J. Hazardous Materials.
11. Riser-Roberts, E., 1998. Bioremediation of Petroleum Contaminated Soils. Lewis Publishers, Boca Raton, Florida.
12. Rushton, D.G., A.E. Ghaly and K. Martinell, 2007. Assessment of Remediation Regulations and Remediation Methods for Oil Contaminated Soils in Canada. Am. J. Appl. Sci., 4 (7): 465-478.
13. Odermatt, J.R., 1994. Natural chromatographic separation of benzene, toluene, ethylbenzene and xylenes (BTEX compounds) in a gasoline contaminated ground water aquifer. Organic Geochemistry, 21: 1141-1150.
14. Martinell, K., 2006. Bioremediation of Diesel Contaminated Soil. Undergraduate Thesis, Department of Process Engineering and Applied Science. Dalhousie University, Halifax, Nova Scotia.
15. Ghaly, A.E. and J.B. Pyke, 2001. In-vessel bioremediation of oil-contaminated peat. Energy Sources, 23: 305-325.
16. Davis, J.W. and S. Madsen, 1996. Factors affecting the biodegradation of toluene in soil. Chemosphere, 33: 107-130.
17. Lee, J.Y., Y.B. Choi and H.S. Kim, 1993. Simultaneous Biodegradation of Toluene and p-xylene in a novel bioreactor: experimental results and mathematical analysis. Biotechnology Progress, 9: 46-53.
18. Black, C.A., D.D. Evans, L.E. Ensminger, J.L. White and F.E. Clark, 1965. Methods of Soil Analyses. American Society of Agronomy Publisher, Madison, Wisconsin.
19. Jørgensen, K.S., J. Puustinen and A.M. Suortti, 2000. Bioremediation of petroleum hydrocarbon contaminated soil by composting in Biopiles. Environ. Pollu., 107: 245-254.
20. Alkoaik, F. and A.E. Ghaly, 2005. Effect of inoculum size on the composting of greenhouse tomato plant trimmings. Compost Science and Utilization, 15: 262-273.
21. Namkoong, W., E. Hwang, J. Park and J. Choi, 2002. Bioremediation of diesel contaminated soil with composting. Environ. Pollu., 119: 23-31. 22. Tsai, W.Y., L.Y. Chan, D.R. Blake and K.W. Chu,
2006. Vehicular fuel composition and atmospheric emissions in South China: Hong Kong, Macau, Guangzhou and Zhuhai. Atmospheric Chemistry and Physics, 6: 3281-3288.
23. ASTM, 2001. Annual of ASTM Standard Methods. American Society of Testing and Materials. Philadelphia, Pennsylvania.
24. APHP, 1995. Standard Methods for Examination of Water and Wastewater. Am. Pub. Health Associ., Washington, D.C.
25. Baker, K.H. and D.S. Herson, 1994. Bioremediation, McGraw Hill, New York.
26. Petiot, C. and A. de Guardia, 2004. Composting in a laboratory reactor: a review. Compost Science and Utilization, 12: 69-79.
27. Lau, A.K., K.V. Lo, P.H. Liao and J.C. Yu, 1992. Aeration experiments for swine waste composting. Bioresource Technology, 41: 145-152.
29. Cai, Q.Y., C.H. Mo, Q.T. Wu, Q.Y. Zeng, A. Katsoyiannis and J.F. Férard, 2006. Bioremediation of Polycyclic aromatic hydrocarbons (PAHs)-contaminated sewage sludge by different composting processes. J. Hazardous Materials.
30. Rojas-Avelizapa, N.G., T. Roldán-Carrillo, H. Zegarra-Martínez, A.M. Muñoz-Colunga and L.C. Fernández-Linares, 2007. A field trial for an ex-situ bioremediation of a drilling mud-polluted site. Chemosphere, 66: 1595-1600.
31. Alkoaik, F. and A.E. Ghaly, 2006. Thermal Bioremediation of Soil contaminated with used motor oil. Energy Sources, 28: 487-500.
32. Margesin, R., J. Cimadom and F. Schinner, 2006. Biological activity during composting of sewage sludge at low temperatures. International Biodeterioration and Biodegradation, 57: 88-92. 33. Lang, C., K.C. Das and R.W. McClendon, 2003.
The influence of temperature and moisture content regimes on the aerobic microbial activity of a biosolids composting blend. Bioresource Technology, 86: 131-137.
34. Ghaly, A.E. and F. Alkoaik, 2006. Influence of bioavailable carbon on the thermal and biological kinetic parameters of the composting process of tomato plant trimmings. Am. J. Environ. Sci., 2: 15-26.
35. Baker, R.J., A.L. Baehr and M.A. Lahvis, 2000. Estimation of hydrocarbon biodegradation rates in gasoline contaminated sediment from measured respiration rates. J. Contaminant Hydrology, 41: 175-192.
36. Lau, K.L., Y.Y. Tsang and S.W. Chiu, 2003. Use of spent mushroom compost to Bioremediate PAH contaminated samples. Chemosphere, 52: 1539-1546.
37. Sivagurunathan, M., A. M. Martin and R. J. Helleur, 2003. Biological waste- treatment of hydrocarbon residues: effects of humic acids on the degradation of Toluene. Appli. Energy, 75: 267-273.
38. Antizar-Ladislao, B., J. Lopez-Real and A. J. Beck, 2006. Degradation of polycyclic aromatic hydrocarbons (PAHs) in an aged coal tar contaminated soil under in-vessel composting conditions. Environ. Pollu., 14: 459-468.
39. Wang, L., S. Barrington and J.W. Kim, 2007. Biodegradation of pentyl amine and aniline from petrochemical wastewater. Environ. Manag., 83: 191-197.
40. Antizar-Ladislao, B., J. Lopez-Real and A.J. Beck, 2005. In-vessel composting– bioremediation of aged coal tar soil: effect of temperature and soil/green waste amendment ratio. Environ. Inter., 3: 173-178.
41. Wackett, 2004. Toluene Pathway Map. University of Minnesota, St Paul, Minnesota. Accessed March 2007.
42. He, Y.W., Y. Inamori, M. Mizuochi, H. Kong, N. Iwami and T. Sun, 2000. Measurements of N2O and CH4 from the aerated composting of food
waste. Science of the Total Environment, 254: 65-74.
43. Beller, H.R., M. Reinhard and D. Grbic-Galic, 1992. Metabolic byproducts of anaerobic toluene degradation by sulfate reducing enrichment cultures. Appli. and Environ. Microbio., pp: 3192-3195.
44. Gödeke, S.H. Richnow, H. Weiβ, A. Fischer, C. Vogt, H. Borsdorf and M. Schirmer, 2006. Multi tracer test for the implementation of enhance in-situ bioremediation at a
BTEX-contaminated megasite. J. Contaminant Hydrolo., 87: 211-236.
45. Wang, L., S. Barrington and J. W. Kim, 2002. Biodegradation of pentyl amine and aniline from petrochemical wastewater. J. Environ. Manag, 83: 191-197.
46. Efremenko, E.N., R.E. Azizov, A.A. Raeva, V.M. Abbasov and S.D. Varfolomeyev, 2005. An approach to rapid control of oil spill bioremediation by bioluminescent method of intracellular ATP determination. International Bioremediation and Biodegradation, 56: 94-100. 47. Marcon, R., G. Bestetti, F. Frati, M. Pepi and F.
Baldi, 2006. Naphthalene and biphenyl oxidation by two marine pseudomonas strains isolated from Venice lagoon sediment. International Bioremediation and Biodegradation, 59: 25-31. 48. Pala, D.M., D.D. de Carvalho, J.C. Pinto, G.L.
Sant’Anna, 2006. A suitable model to describe bioremediation of petroleum contaminated soil. International Bioremediation and Biodegradation, 58: 254-260.
![Fig. 1: Soil phases Table 1: Tier I risk based screening level for soil [12]](https://thumb-eu.123doks.com/thumbv2/123dok_br/18427891.361771/2.918.222.692.152.435/fig-soil-phases-table-tier-based-screening-level.webp)
![Table 2: Physical-chemical properties of toluene [11,19]](https://thumb-eu.123doks.com/thumbv2/123dok_br/18427891.361771/3.918.108.445.161.383/table-physical-chemical-properties-of-toluene.webp)

![Fig. 6: Aerobic toluene degradation pathway [43]](https://thumb-eu.123doks.com/thumbv2/123dok_br/18427891.361771/9.918.112.804.522.953/fig-aerobic-toluene-degradation-pathway.webp)
![Fig. 7: Anaerobic toluene degradation pathway [43]](https://thumb-eu.123doks.com/thumbv2/123dok_br/18427891.361771/10.918.111.440.138.823/fig-anaerobic-toluene-degradation-pathway.webp)
