A Systematic Review of Health Economic
Analyses of Housing Improvement
Interventions and Insecticide-Treated
Bednets in the Home
Frank Pega
*
, Nick Wilson
Burden of Disease Epidemiology, Equity and Cost-Effectiveness Programme, University of Otago, Wellington, PO Box 7343, Wellington, New Zealand
Abstract
Background
Housing improvements have considerable potential for improving health. So does the
pro-vision of insecticide-treated bednets for malaria prevention. Therefore we aimed to
con-duct updated systematic reviews of health economic analyses in both these intervention
domains.
Methods and findings
The search strategy included economic analyses of housing improvement interventions and
use of insecticide-treated bednets for community-dwelling, healthy populations (published
between 1 January 2000 and 15 April 2014). We searched the Cochrane Database of
Sys-tematic Reviews, MEDLINE, PubMed, EMBASE, and three health economics databases.
Thirty-five economic analyses of seven types of intervention fulfilled the inclusion criteria.
Most included studies adopted a health sector perspective and were cost-effectiveness
anal-yses using decision analytic modeling or conducted alongside trials. The overall quality of
the studies was generally likely to be adequate for informing policy-making (albeit with
limita-tions in some areas). There was fairly consistent evidence for the
cost-effectiveness/favor-able cost-benefit of removing indoor lead to prevent lead poisoning and sequelae, and
retrofitting insulation to prevent lung disease. But the value of assessing and improving
home safety and providing smoke alarms to prevent injuries was more mixed and the
eco-nomic evidence was inconclusive or insufficient for: home ventilation to prevent lung disease,
installing heaters to prevent lung disease and regulating tap water temperatures to prevent
scalding. Few studies (n = 4) considered health equity. The 12 studies of providing
insecti-cide-treated bednets or hammocks to prevent malaria found these interventions to be
moder-ately to highly cost-effective.
a11111
OPEN ACCESS
Citation:Pega F, Wilson N (2016) A Systematic Review of Health Economic Analyses of Housing Improvement Interventions and Insecticide-Treated Bednets in the Home. PLoS ONE 11(6): e0151812. doi:10.1371/journal.pone.0151812
Editor:Delmiro Fernandez-Reyes, University College London, UNITED KINGDOM
Received:April 9, 2015
Accepted:January 18, 2016
Published:June 1, 2016
Copyright:© 2016 Pega, Wilson. This is an open access article distributed under the terms of the Creative Commons Attribution License, which permits unrestricted use, distribution, and reproduction in any medium, provided the original author and source are credited.
Data Availability Statement:All relevant data are within the paper and its Supporting Information files. Additional data can be found atwww.otago.ac.nz/ bode3.
Conclusions
This systematic review provides updated evidence that several housing improvement
inter-ventions (such as removing indoor lead and retrofitting insulation) and also the provision of
insecticide-treated bednets are cost-effective interventions. Nevertheless, for some
inter-ventions additional analyses are required to better clarify their health economic and health
equity value.
Introduction
Housing quality is an important social determinant of health [
1
]. Thus, interventions that
improve housing quality have the potential to improve individual and population health [
1
].
If these interventions are targeted at populations disadvantaged by living in housing of
rela-tively poor quality, then they also have the potential for improving health equity [
1
]. Recent
systematic review evidence suggested that selected housing interventions effectively improve
health [
2
]. It was concluded, for example, that
“
housing investment which improves thermal
comfort in the home can lead to health improvements, especially where the improvements are
targeted at those with inadequate warmth
”
(p. 2) [
2
]. Thus, the effectiveness of some housing
interventions is now fairly evidence-based [
2
]. In addition, some such interventions also have
considerable non-health benefits in domains such as climate change, energy use and income.
For example, retrofitting insulation to improve thermal comfort may not only improve health,
but at the same time also reduce domestic energy use and anthropogenic green-house gas
emissions.
Economic analysis is
“
the comparative analysis of alternative courses of action in terms of
both their costs and their consequences
”
(p. 1) [
3
]. Health economic analyses encompass three
primary types of studies, i.e., cost-benefit, cost-effectiveness and cost-utility analyses. The
World Health Organization (WHO) has noted the central importance of evidence from
eco-nomic analyses of the health impact of interventions addressing the social determinants of
health, including housing-related interventions, in making the economic case for such
inter-ventions. The WHO has also noted the scarcity of and called for additional such evidence to be
produced [
4
].
Systematic reviews of health economic analyses remain scarce, but are increasingly gaining
attention. While specific, standard methodology for such systematic reviews has been
pro-posed, additional development and refinement to these methods is required [
5
]. Best practice
guidelines[
5
] are clear that such systematic reviews should always review both economic
analy-ses conducted alongside randomized controlled trials [
6
] (or, more broadly, intervention
studies) and economic analyses using decision analytic modeling [
7
]. The main use of such
sys-tematic reviews is to inform decision model development; identify the most relevant study for
a specific decision context; and understand the key economic trade-offs and causal
relation-ships in a decision model or treatment area [
5
]. Because cost-effectiveness analytic evidence is
commonly highly context specific, systematic reviews of economic evaluations of the health
impact of interventions may have relatively little potential to produce (pooled)
cost-effective-ness estimates that are generalizable[
5
], unless multiple methodologically and statistically
homogenous studies from a comparable context are available for meta-analysis.
We identified only one previous systematic review specifically of economic analyses of the
health impact of housing improvements [
8
]. This review synthesized evidence from economic
analyses that were included in another systematic review [
9
] of the effectiveness of housing
and analysis, decision to publish, or preparation ofthe manuscript.
interventions that was published in 2009 (which covered studies published before 2008). It
identified two such studies of community-dwelling, healthy populations conducted before
2008, namely one study each of installing heaters [
10
] and retrofitting insulation [
11–13
], plus
one study [
14
,
15
] of a population with pre-existing conditions and another study [
16
] of an
intervention that combined housing with major non-housing components. The review authors
concluded that there is a
“
near absence of economic evaluation of housing improvements
”
(p. 843) [
8
]. Similarly, the authors of a cost-effectiveness study of enhanced home ventilation
published in 2011 have argued that their study was only the second comprehensive economic
analysis of a housing intervention [
17
].
An updated systematic review is therefore necessary for establishing the status of evidence
from economic analyses of the health impact of housing interventions for four reasons. First,
research activity on housing and health has grown substantially in the last seven years (i.e.,
2008
–
2014), and so new studies may have been published that the previous systematic review
[
8
] did not include. Second, this previous systematic review [
8
] was fairly narrow in scope for
included study types and interventions. For example, it excluded any economic analyses using
decision analytic modeling [
7
] and may also have excluded some types of housing
interven-tions altogether, such as home safety assessment and modification (HSAM) interveninterven-tions (e.g.,
those for preventing injuries in community-dwelling older adults). Third, this previous
system-atic review [
8
] did not search dedicated health economics databases. Furthermore, the status
of equity analysis conducted as part of economic analyses has not specifically been reviewed
before, despite the WHO calling specifically for economic analyses of social determinants of
health interventions to assess and value effects on health equity [
4
].
Another in-house intervention is the provision of insecticide-treated bednets (ITBNs) for
malaria prevention. This intervention has existing evidence for cost-effectiveness from a
sys-tematic review [
18
] that covered interventions published between 2000 and 2010. But since this
is an active area for on-going research, we considered it appropriate to consider an updated
review of this literature.
Given the above, our study objective was to provide updated systematic reviews of health
economic analyses of both housing interventions and the provision of insecticide-treated
bed-nets for community-dwelling, healthy populations.
Methods
Study eligibility criteria
We developed a strict study protocol before we commenced the search stage, which is available
from the authors on request. To be included in this systematic review a study had to be an
eco-nomic analysis, i.e., a cost-benefit, cost-effectiveness and/or cost-utility analysis. Following best
practice guidelines [
5
], we included both economic analyses conducted alongside randomized
controlled trials [
6
] (or other intervention studies) and economic analyses using decision
ana-lytic modeling [
7
]. Any other study types, including studies of costs alone, were excluded.
environment (e.g., neighborhood crime reduction) or economic environment of the house
(e.g., improve affordability of housing). We also excluded multi-mode interventions that
com-bined structural housing interventions with more predominant other interventions (e.g.,
HSAM provided as a minor intervention alongside major education or exercise programs).
Rehousing interventions (e.g., for low-income families) were also excluded, because they may
have acted primarily through the changed social environment, rather than a change to the
physical environment.
All types of static, physical, permanent houses were included. The exception was that we
excluded institutionalized housing such as hospitals or supported housing for vulnerable
popu-lations. Non-static, (potentially) non-permanent houses such as caravans and house boats were
also excluded, because they may not be comparable to the houses included in the systematic
review.
Included participants were community-dwelling (non-institutionalized), healthy (without
major pre-existing conditions) populations residing in any country. Homeless people and
peo-ple with major pre-existing conditions such as moderate or severe asthma, severe visual
impair-ments and HIV and/or AIDS were excluded from the review, because housing interventions
may have a different cost-effectiveness in these populations than in the healthy general
popula-tion. However, general population samples that included some people with pre-existing
condi-tions were included. Records written in any language were included.
Search and screening
One review author (FP) searched a total of seven electronic academic databases between 28
April and 15 May 2014 for economic analyses of the health impact of housing interventions in
community-dwelling, healthy populations published between 1 January 2000 and 15 April
2014.
Fig 1
presents the MEDLINE search strategy, and this search strategy was adapted to
suit the searches of the other database. The Cochrane Database of Systematic Reviews (
The
Cochrane Library
2014, Issue 5), MEDLINE, PubMed, and EMBASE electronic academic
databases were searched. Three specialized databases of health economic analyses were also
searched, i.e., the Health Economic Evaluation Database, the NHS Economic Evaluation
Data-base and the Tufts Cost-Effectiveness Analysis Registry. We also screened the first 30 hits on
Internet search engine Google Scholar. When we were near the completion of the systematic
review we searched the PubMed database again for records published after 15 May 2014 to
identify any additional studies and records published since the original searches had been
conducted.
One review author (FP) screened the titles of all potentially relevant records and then the
abstracts of all records with potentially relevant titles. Both review authors then independently
screened the full texts of all potentially relevant records in depth for the inclusion criteria. We
also independently hand searched the reference lists of relevant previous systematic reviews [
8
,
18
] and of each included study record for additional studies or records.
Study characteristics
system or societal); time horizon; and effectiveness outcome measure (quality-adjusted
life-years [QALY] gained, disability-adjusted life-life-years [DALY] averted, life-life-years saved [LYS],
lives saved or deaths averted and other outcomes). We also documented as qualitative
charac-teristics the sources for estimation of effectiveness, sources for estimation of resource
utiliza-tion, discount rates used and whether sensitivity analysis had been conducted. Sources for
estimation of effectiveness and resource utilization were classified as primary data collection
(for example, questionnaires or trials), secondary data collection (for example, administrative
records), literature (for example, systematic reviews of effectiveness) or expert opinion. Use
of discount rates was classified into use on costs, effects or both costs and effects, or not used
at all.
Quality assessment
Both review authors independently assessed the quality of the included economic analyses
using Drummond and Jefferson
’
s established checklist [
21
] as modified by Zelle and Baltussen
[
22
]. This checklist included 29 items covering five categories, namely study design;
effective-ness estimation; cost estimation; analysis; and interpretation of results. We independently
assessed, for each study, each item along a three-point scale, allowing grading as to whether the
Fig 1. Medline search strategy.respective item was fully considered (assigning 2 points), partially considered (1 point) or not
considered (0 points) in the study. Items that were irrelevant for a study were excluded from
the quality assessment. For example, if a study sourced effectiveness estimates from an
individ-ual study, then we did not assess whether the study provided details of the method of synthesis
or meta-analysis of effectiveness estimates (item 11). The two reviewers discussed any
disagree-ment between the quality assessdisagree-ments until resolution was reached. To provide a mean quality
score, scores were summed and compared to the maximum attainable score, both for each
assessment category and overall. We also screened all studies for potential disclosed and
undis-closed financial conflicts of interest and note these as part of our quality assessment. In the
absence of best practice guidelines for assessing publication bias in systematic review of
eco-nomic analyses, we assessed whether the body of evidence included a plausible range of
cost-effectiveness estimates across the included studies.
Study findings
We extracted and documented each study
’
s objective, the comparator intervention(s) and the
main outcomes measures (i.e., cost-effectiveness or cost-benefit measures). The main outcome
measures of this systematic review were (i) the study author
’
s or authors
’
conclusion of the
cost-effectiveness or cost-benefit of the housing intervention (e.g., differentiating not, likely or
highly cost-effective, or cost-saving) and (ii) the average cost per relevant health outcome (e.g.,
average cost per DALY averted). If study authors did not reach a clear conclusion on the
cost-effectiveness of an examined housing intervention, we judged cost-cost-effectiveness ourselves. We
based our judgment on the WHO standard [
23
] of one per-capita gross domestic product
(GDP; sourced from the World Bank [
24
]) per QALY gained or DALY averted as indicating
high cost-effectiveness and two to three per capita GDP as indicating likely cost-effectiveness.
In the absence of a global standard of cost-effectiveness for the cost of one malaria infection
averted, we applied an arbitrary effectiveness threshold of US$50. If a study reported
cost-effectiveness or cost-benefit measures for multiple health outcomes, then we prioritized
mea-sures for the health outcomes in the following order: DALYs averted over QALYs averted over
LYS over lives saved or deaths averted over other outcomes. For studies that report results
from two types of economic analyses (i.e., combined cost-effectiveness and cost-benefit
analy-ses), we extracted and reported findings from both economic analyses types.
Results
Search results
The search identified a total of 7,957 records (without duplicates).
Fig 2
presents a PRISMA
flow-chart of the selection of studies. After title screening, 374 records were considered
tially relevant. After abstract screening, 138 records of 135 studies were still considered
poten-tially relevant and these progressed to in-depth full-text screening. This next screening phase
identified 34 studies with 37 records (described below). Hand searching of the reference lists of
relevant previous systematic reviews [
8
,
18
] identified one additional eligible study (Grimes
et al 2012) [
25
]. The review included a final total of 35 studies with 38 records that fulfilled
eli-gibility criteria, and they were included in the review and synthesized qualitatively. Study
het-erogeneity prohibited combining studies in meta-analysis.
Study characteristics
analyses, one was a cost-utility analysis and two combined cost-effectiveness with cost-benefit
analyses. The base year of cost data ranged between 1990 and 2014, although it was unclear in
four studies. Most analyses used decision analytic modeling (n = 14 studies) or were conducted
alongside randomized controlled trials or other experimental studies (n = 12), but some were
conducted alongside observational studies (7), and two were conducted alongside intervention
implementation. Slightly more studies took a health system perspective (22) than a societal
per-spective (13). Societal perper-spectives, in addition to health, covered one or more of the domains
of climate change, energy, crime, education, income, productivity and wealth. The time
hori-zon was short (i.e., 1
–
4 years) in 14 studies, medium (i.e., 5
–
10 years) in six studies, long (i.e.,
>
10 years) in 11 studies and unclear in four studies.
The most common country setting was the United States (n = 11 studies), followed by New
Zealand (4) and the United Kingdom (3). Two studies each were conducted for Australia,
Eri-trea, Kenya and Togo, and one study each for: Canada, France, India, Malawi, Myanmar, the
Netherlands, Senegal, South Africa, Tanzania, Thailand, Vietnam, the Southern / Eastern
Afri-can region and the Western AfriAfri-can region. Study populations were the community-dwelling,
healthy general population (n = 12 studies), children (13), older people (6) and/or specific
pop-ulation groups (e.g., persons residing in geographically deprived areas or persons earning low
or middle incomes) (6). Study populations were generally well-tailored to the studied
interven-tions. For example, most HSAM interventions were studied in older people, and indoor lead
paint removal was studied in children.
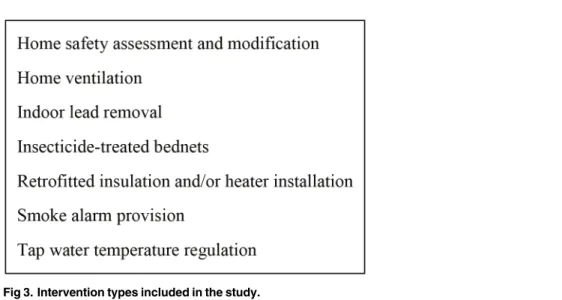
This systematic review included six broad types of housing interventions (
Fig 3
) in addition
to the provision of ITBNs or ITHs to prevent malaria or other infections. The latter were
exam-ined in 12 studies [
26
–
36
,
38
]. These interventions differed in terms of the type of bednet or
hammock (conventional versus long-lasting) and the type of insecticide used.
HSAM interventions were studied in seven studies [
39–45
]. All of these interventions aimed
to reduce falls in older people (except one study that aimed to reduce injury in the general
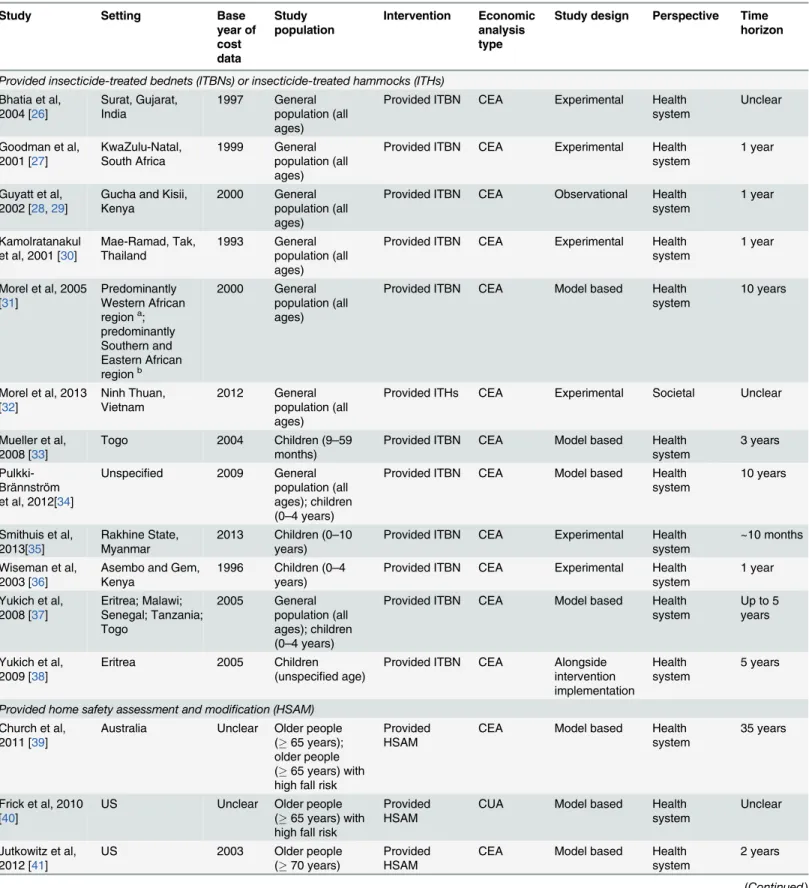
Fig 2. Flow-chart of the selection of studies of economic analyses of housing interventions.Table 1. Characteristics of included studies, ordered by type of intervention.
Study Setting Base
year of cost data Study population Intervention Economic analysis type
Study design Perspective Time horizon
Provided insecticide-treated bednets (ITBNs) or insecticide-treated hammocks (ITHs)
Bhatia et al, 2004 [26] Surat, Gujarat, India 1997 General population (all ages)
Provided ITBN CEA Experimental Health system
Unclear
Goodman et al, 2001 [27] KwaZulu-Natal, South Africa 1999 General population (all ages)
Provided ITBN CEA Experimental Health system
1 year
Guyatt et al, 2002 [28,29]
Gucha and Kisii, Kenya
2000 General population (all ages)
Provided ITBN CEA Observational Health system
1 year
Kamolratanakul et al, 2001 [30]
Mae-Ramad, Tak, Thailand
1993 General population (all ages)
Provided ITBN CEA Experimental Health system
1 year
Morel et al, 2005 [31]
Predominantly Western African regiona; predominantly Southern and Eastern African regionb 2000 General population (all ages)
Provided ITBN CEA Model based Health system
10 years
Morel et al, 2013 [32] Ninh Thuan, Vietnam 2012 General population (all ages)
Provided ITHs CEA Experimental Societal Unclear
Mueller et al, 2008 [33]
Togo 2004 Children (9–59
months)
Provided ITBN CEA Model based Health system
3 years
Pulkki-Brännström et al, 2012[34]
Unspecified 2009 General
population (all ages); children (0–4 years)
Provided ITBN CEA Model based Health system
10 years
Smithuis et al, 2013[35]
Rakhine State, Myanmar
2013 Children (0–10 years)
Provided ITBN CEA Experimental Health system
~10 months
Wiseman et al, 2003 [36]
Asembo and Gem, Kenya
1996 Children (0–4 years)
Provided ITBN CEA Experimental Health system
1 year
Yukich et al, 2008 [37] Eritrea; Malawi; Senegal; Tanzania; Togo 2005 General population (all ages); children (0–4 years)
Provided ITBN CEA Model based Health system
Up to 5 years
Yukich et al, 2009 [38]
Eritrea 2005 Children
(unspecified age)
Provided ITBN CEA Alongside intervention implementation
Health system
5 years
Provided home safety assessment and modification (HSAM)
Church et al, 2011 [39]
Australia Unclear Older people (65 years); older people (65 years) with high fall risk
Provided HSAM
CEA Model based Health
system
35 years
Frick et al, 2010 [40]
US Unclear Older people
(65 years) with high fall risk
Provided HSAM
CUA Model based Health
system
Unclear
Jutkowitz et al, 2012 [41]
US 2003 Older people
(70 years)
Provided HSAM
CEA Model based Health
system
2 years
Table 1. (Continued)
Study Setting Base
year of cost data Study population Intervention Economic analysis type
Study design Perspective Time horizon
Keall et al, 2014 [42]
New Zealand 2014 People in households residing in an owner-occupied dwelling constructed before 1980 and with one or more members receiving a state benefit or subsidy
Provided HSAM
CBA Experimental Health
system
20 years
Kochera et al, 2002 [43]
US 2000 Older people
(65 years)
Provided HSAM
CBA Model based Health
system
1 year
Ling et al, 2008 [44]
Hanna, Maui, Hawaii, US
Unclear Older people (65 years) with high fall risk
Provided HSAM
CBA Observational Health
system
1 year
Salkeld et al, 2000 [45]
Part of Central Sydney Area, Australia
1997 Older people (65 years)
Provided HSAM
CEA Experimental Health
system
1 year
Ventilated home
Franchimon et al, 2008 [46]
Netherlands 2003 General
population (all ages) Ventilated home (dwellings only), ventilated home (dwellings, schools, offices)
CEA Model based Health
system
Entire life span of the Dutch population in 2003
Removed indoor lead (paint and dust)
Brown, 2002 [47]
US 2001 Children
(unspecified age)
Removed indoor lead (public policy enforcement)
CBA Model based Societal
(health, education, income) Up to lifetime for data inputs
Dixon et al, 2012 [48]
Burlington, Bennington, Springfield, and scattered locations, Vermont;
Minneapolis, St Paul, and Duluth, Minnesota; Cleveland and Chicago, US
Unclear Children (unspecified age)
Removed indoor lead
CBA Observational Societal (health, education, energy, wealth) Up to lifetime for data inputs
Gould, 2009 [49] US 2006 Children (1–5
years)
Removed indoor lead
CBA Model-based Societal
(health, education, crime, wealth) Up to lifetime for data inputs
Nevin et al, 2008 [50]
US 2005 Children (1–5
years) Removed indoor lead (replaced lead-unsafe with lead-safe windows)
CBA Observational Societal (health, wealth, energy) Up to lifetime for data inputs
Table 1. (Continued)
Study Setting Base
year of cost data Study population Intervention Economic analysis type
Study design Perspective Time horizon
Pichery et al, 2011 [51]
France 2008 Children (1–6
years)
Removed indoor lead (lead-paint abatement)
CBA Observational Societal (health, education, crime) Up to lifetime for data inputs
Retrofitted insulation and/or installed heaters
Barton et al, 2007[10]
UK 2000 General
population living in deprived geographic areas (all ages)
Retrofitted insulation; installed heaters
CEA Experimental Societal
(health, education, energy)
1 year
Grimes et al, 2012 [25]
New Zealand 2009 General
population (all ages) on low- or middle-income and living in houses built before 2000
Retrofitted insulation; installed heaters
CBA Observational Societal (health, energy)
30 years for retrofitting insulation, 10 years for installing heaters
Chapman et al, 2004 [11–13]
New Zealand 2002 General
population (all ages)
Retrofitted insulation
CBA Experimental Societal
(health, energy, environment)
30 years
Levy et al, 2003 [52]
US 1990 Families in
single-family homes
Retrofitted insulation
CBA Model based Societal
(health, productivity, energy)
1 year
Preval et al, 2010 [53]
New Zealand 2007 Households using either an unflued gas or electric plug-in heater as the main form of heating and with one or more children (7–12 years) with doctor-diagnosed asthma who had asthma symptoms in the last 12 months
Installed clean heater (heat pump, pellet burner,flued gas heater)
CBA Observational Societal (health, energy, climate)
12 years
Gave away and/or installed smoke alarms
Ginnelly et al, 2005 [54] Camden and Islington, London, UK 1999 General population (all ages) Gave way smoke alarms
CEA Experimental Societal
(health, wealth)
2 year
Haddix et al, 2001 [55] Oklahoma City, Oklahoma, US 1990 General population (all ages) Gave way smoke alarms CBA Alongside intervention implementation Health system, societal (health, productivity) 5 years
Liu et al, 2012 US 2011 General
population living in small communities of 5,000 population (all ages) Gave way smoke alarms, installed smoke alarms
CEA, CBA Model based Societal (health, productivity, wealth)
1 year
population [
42
]) by identifying and removing fall and other injury hazards in the home, for
example by installing hand rails on stairs or in the bathroom and removing trip hazards.
Removal of indoor lead was examined in five studies [
47–51
]. These interventions included
removal of lead-containing window frames and other indoor materials, as well as enforcement
of public policy for removing indoor lead. Retrofitting of insulation and/or installation of
heat-ers was examined in five studies [
10–13
,
25
,
52
,
53
]. Finally, giving away or installing smoke
alarms was examined in three studies [
54
,
55
,
58
], regulating household tap water temperature
to prevent scalds was examined in two studies [
56
,
57
], and increasing home ventilation was
examined in one study [
46
].
Effectiveness outcome measures were QALYs gained (n = 3 studies), DALYs averted (8),
life-years saved (LYS) (2), lives saved or deaths averted (10) and/or one or more other
out-comes (24 studies). Other outout-comes comprised morbidity ones (e.g., asthma, attention deficit
hyperactivity disorder, lead poisoning, malaria infection, mental retardation or psychological
distress), injury (e.g., fall or scald), medication and use of health services (e.g., GP visit and
hos-pitalization). Effectiveness estimates were sourced primarily from the literature (n = 14 studies)
and secondary data (15), and less commonly from primary data (7), expert opinion and/or an
unclear source (1 each). Estimates of resource utilization were sourced from secondary data
(19), literature (18 studies), primary data (3), expert opinion (2), unclear sources (2) and/or a
field study or operational costs (1 each). If discount rates were used, they ranged between 3%
and 5.3%, but were most commonly either 3% or 5% and applied to both effects and costs.
However, just under half of all included studies (17) did not discount either or both of effects
and costs, and four studies did not discuss discounting. Sensitivity analyses were conducted in
most (27) studies. Only four studies reported some form of equity analysis, which were
gener-ally limited to comparisons of targeted (to disadvantaged populations) and untargeted
strate-gies. For example, one study compared the cost-benefit of retrofitting insulation targeted to the
low- and middle-income populations with that of the intervention targeted to the high-income
population [
11–13
].
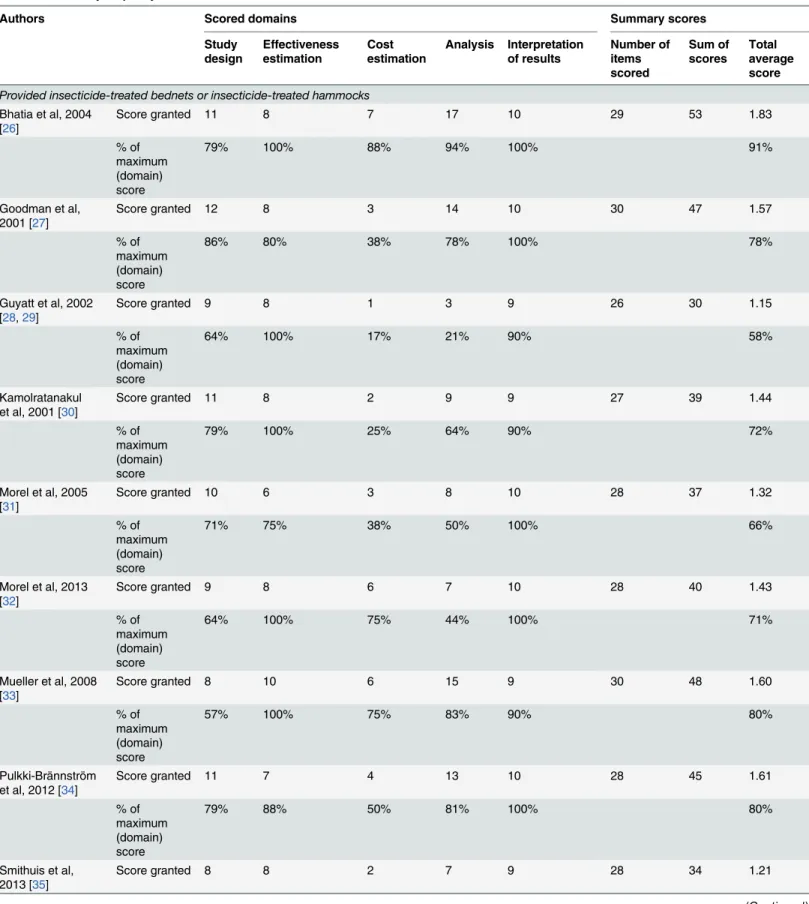
Quality assessment
Table 3
presents our quality assessments of the included studies, excluding non-applicable
items and using percentage scores as indicators. The quality varied across included studies,
ranging in average score from 33% to 98% (median: 72%). The studies with the highest average
scores were Liu et al 2012 (98%) [
58
], Bhatia et al 2004 (91%) [
26
] and Preval et al 2010 (83%)
[
53
]. For interventions examined by four or more studies, studies on provision of smoke alarms
received the highest average score (83%), followed by studies on provision of ITBNs or ITHs
(73%) and retrofitting insulation and/or installing heaters (68%). Relatively low average scores
were received by studies of removal of indoor lead (63%) and HSAM (62%). On average,
Table 1. (Continued)Study Setting Base
year of cost data
Study population
Intervention Economic analysis type
Study design Perspective Time horizon
Regulated tap water
Han et al, 2007 [56]
Ontario, Canada 2002 Children (0–9 years)
Regulated tap water
CEA Model based Health
system
10 years
Phillips et al, 2011 [57]
UK 2008 Children (0–4
years)
Regulated tap water
CEA, CBA Experimental Health system
Unclear
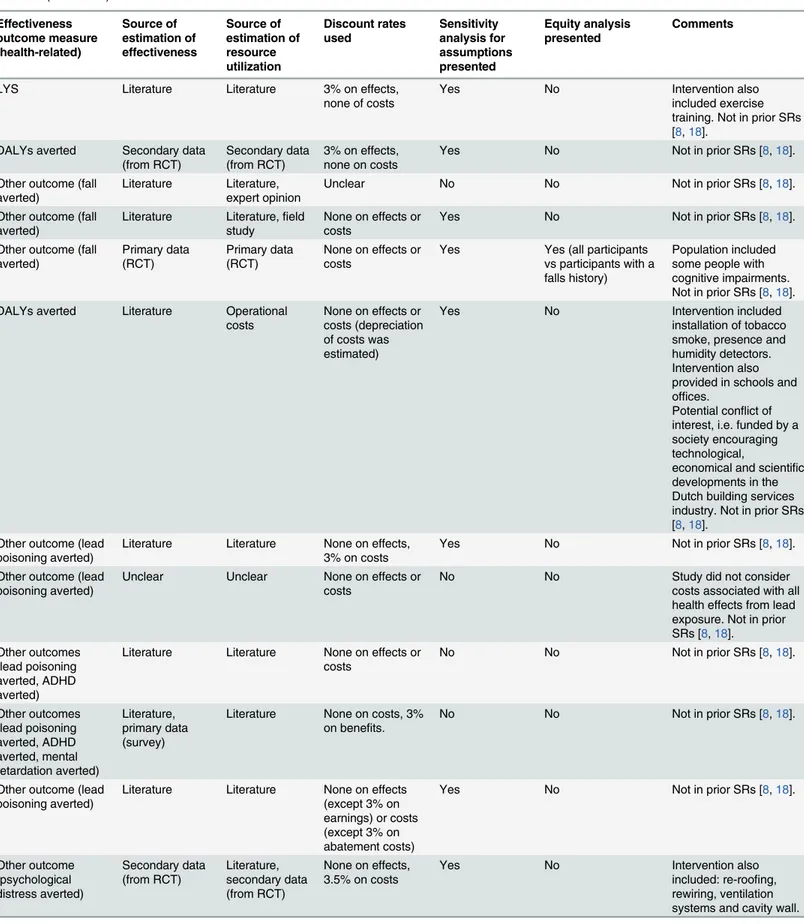
Table 2. Characteristics of included studies, ordered by type of intervention (Table 1continued). Effectiveness outcome measure (health-related) Source of estimation of effectiveness Source of estimation of resource utilization Discount rates used Sensitivity analysis for assumptions presented Equity analysis presented Comments Other outcome (malaria infection averted) Secondary data (records) Secondary data (records) Unclear discounting on effects, cost discounted by different, not specified percentages
Yes No
Life saved Secondary data (records)
Secondary data (records)
None on effects, 5.3% on (selected) costs Yes No Other outcomes (malaria vector exposure averted, malaria infection averted) Primary data (survey) Secondary data (records)
None on effects, 3% on (selected) costs Yes No Other outcome (malaria infection averted) Secondary data (records) Secondary data (records)
None on effects or costs
No No
DALYs averted Literature, secondary data (records), expert opinion Literature, secondary data (records), expert opinion
Unclear Yes No
Other outcome (malaria infection averted) Primary data (survey), secondary data (trial) Primary data (survey), secondary data (trial)
None on effects, 3% on costs
Yes No Not in prior SRs [8,18].
DALYs averted, life saved, other outcome (malaria infection averted)
Literature Primary data (survey)
3% on effects, 5% on costs
Yes No Not in prior SRs [8,18].
DALYs averted Primary data (from RCT)
Literature, secondary data (records)
Unclear No No Not in prior SRs [8,18].
DALYs averted, life saved
Literature Literature 3% on effects and costs
Yes Yes (general
population vs children)
Not in prior SRs [8,18].
LYS, life saved, other outcome (all cause sick child visit averted) Secondary data (records, from trial) Literature, secondary data (records), primary data (survey)
3% on effects and costs
Yes No Not in prior SRs [8,18].
DALYs averted, death averted, other outcome (person year protected from malaria infection) Secondary data (records) Literature, secondary data (records)
3% on effects and costs
Yes No
DALYs averted, life saved
Literature Secondary data (records)
3% on effects and costs
Yes No Intervention also
provided in ante-natal care facilities. Not in prior SRs [8,18].
QALYs gained Literature Literature 5% on effects and costs
Yes No Not in prior SRs [8,18].
QALYs gained Literature Literature 3% on effects and costs
Yes No Not in prior SRs [8,18].
Table 2. (Continued) Effectiveness outcome measure (health-related) Source of estimation of effectiveness Source of estimation of resource utilization Discount rates used Sensitivity analysis for assumptions presented Equity analysis presented Comments
LYS Literature Literature 3% on effects,
none of costs
Yes No Intervention also
included exercise training. Not in prior SRs [8,18].
DALYs averted Secondary data (from RCT)
Secondary data (from RCT)
3% on effects, none on costs
Yes No Not in prior SRs [8,18].
Other outcome (fall averted)
Literature Literature, expert opinion
Unclear No No Not in prior SRs [8,18].
Other outcome (fall averted)
Literature Literature,field study
None on effects or costs
Yes No Not in prior SRs [8,18].
Other outcome (fall averted)
Primary data (RCT)
Primary data (RCT)
None on effects or costs
Yes Yes (all participants vs participants with a falls history)
Population included some people with cognitive impairments. Not in prior SRs [8,18]. DALYs averted Literature Operational
costs
None on effects or costs (depreciation of costs was estimated)
Yes No Intervention included
installation of tobacco smoke, presence and humidity detectors. Intervention also provided in schools and offices.
Potential conflict of interest, i.e. funded by a society encouraging technological,
economical and scientific developments in the Dutch building services industry. Not in prior SRs [8,18].
Other outcome (lead poisoning averted)
Literature Literature None on effects, 3% on costs
Yes No Not in prior SRs [8,18].
Other outcome (lead poisoning averted)
Unclear Unclear None on effects or
costs
No No Study did not consider
costs associated with all health effects from lead exposure. Not in prior SRs [8,18].
Other outcomes (lead poisoning averted, ADHD averted)
Literature Literature None on effects or costs
No No Not in prior SRs [8,18].
Other outcomes (lead poisoning averted, ADHD averted, mental retardation averted) Literature, primary data (survey)
Literature None on costs, 3% on benefits.
No No Not in prior SRs [8,18].
Other outcome (lead poisoning averted)
Literature Literature None on effects (except 3% on earnings) or costs (except 3% on abatement costs)
Yes No Not in prior SRs [8,18].
Other outcome (psychological distress averted) Secondary data (from RCT) Literature, secondary data (from RCT)
None on effects, 3.5% on costs
Yes No Intervention also
included: re-roofing, rewiring, ventilation systems and cavity wall.
studies scored highly on the categories of effectiveness estimation (94% of the maximum
attainable score over all studies) and interpretation of results (86%). However, cost estimation,
study design and analysis scored relatively poorly with 54%, 59% and 62%, respectively. We
found the study [
46
] on home ventilation for preventing chronic lung disease to have a
poten-tial financial conflict of interest, because it received funding from
“
a society that aims to
encourage technical, economical and scientific developments in the Dutch building services
industry
”
(p. 384). The range over which the cost-effectiveness estimates ranged appeared
Table 2. (Continued)Effectiveness outcome measure (health-related) Source of estimation of effectiveness Source of estimation of resource utilization Discount rates used Sensitivity analysis for assumptions presented Equity analysis presented Comments
Other outcomes (GP visit averted, hospitalization averted) Secondary data (records) Literature, secondary data (records)
5% on effects and costs
Yes No Majority of study
population on low incomes.
Life saved, other outcomes (medical visit averted, hospitalization averted, medication averted) Secondary data (records) Secondary data (records)
4% on effects and costs
Yes Yes (low- and
middle-income vs high-income population; cooler vs warmer geographic regions)
Not in prior SRs [8,18].
Life saved, other outcome (asthma averted)
Primary data (survey)
Literature 5% on effects and costs
No No Not in prior SRs [8,18].
Other outcomes (visit to health professional averted, medication averted) Secondary data (from RCT) Secondary data (from RCT)
5% on effects and costs
Yes No Intervention implemented
in homes previously retrofitted with insulation. Not in prior SRs [8,18]. Life saved, other
outcome (injury)
Secondary data (records)
Secondary data (records)
Unclear No No Study population resided
in deprived geographic areas. Not in prior SRs [8,18].
Life saved, other outcome (injury)
Secondary data (records)
Secondary data (records)
None on effects, 3% on costs
Yes No Not in prior SRs [8,18].
QALYs gained, LYS Literature Literature 3% on effects and costs
Yes No Not in prior SRs [8,18].
Other outcome (scald averted) Secondary data (records) Secondary data (records)
3% on effects and costs
Yes No Intervention modified
home safety indirectly through legislation and included education. Not in prior SRs [8,18]. Other outcome (scald averted) Primary data (survey) (from trial) Secondary data (records)
None on effects, 3.5% on (selected) costs
Yes Yes (children in all vs in the most
disadvantaged geographic areas)
Intervention included education. Participants resided in social housing. Not in prior SRs [8,18]. Notes:
ADHD: attention deficit hyperactivity disorder; CBA: cost-benefit analysis; CEA: cost-effectiveness analysis; CUA: cost-utility analysis; QALY: quality-adjusted life-year; DALY: disability-quality-adjusted life-year; HSAM: home safety assessment and modification; ITBN: insecticide-treated bednets; ITHs: insecticide-treated hammocks; LYS: life-years saved; SRs: systematic reviews; UK: United Kingdom; US: United States.
aAlgeria, Angola, Benin, Burkina Faso, Cameroon, Cape Verde, Chad, Comoros, Equatorial Guinea, Gabon, Gambia, Ghana, Guinea, Guinea Bissau, Liberia, Madagascar, Mali, Mauritania, Mauritius, Niger, Nigeria, Sao Tome and Principe, Senegal, Seychelles, Sierra Leone and Togo.
bBotswana, Burundi, Central African Republic, Congo, Cote d’Ivoire, Democratic Republic of the Congo, Eritrea, Ethiopia, Kenya, Lesotho, Malawi, Mozambique, Namibia, Rwanda, South Africa, Swaziland, Uganda, United Republic of Tanzania, Zambia and Zimbabwe.
plausible and study authors
’
conclusions included
“
not cost-effective
”
in some studies, which
provided no evidence for publication bias.
Study findings
Table 4
presents study findings. Overall, there was a considerable body of evidence on the
cost-effectiveness of the health impact of several housing interventions (including for ITBNs) in
sev-eral populations and country settings. In gensev-eral, this body of evidence suggested that these
interventions were moderately to highly cost-effective or cost-beneficial, although
cost-effec-tiveness varied by different intervention types.
There was fairly consistent evidence for the cost-effectiveness or favorable cost-benefit of
ITBNs or ITHs, indoor lead removal and retrofitting of insulation. The 12 studies of ITBNs or
ITHs for preventing malaria or other insect-borne infections found these interventions to be
moderately to highly cost-effective [
26–36
,
38
]. This body of evidence included two studies
[
28–30
] which found ITBNs to have an cost per malaria infection averted of less than US$50,
and one study [
35
] which found ITBNs to have a cost per DALY averted of Int$51, which we
regard to indicate high cost-effectiveness. The only exception was one study [
26
] that found
ITBNs to have an cost per malaria infection averted of US$52, which could be of borderline
cost-effectiveness assuming a cost-effectiveness threshold of US$50. Two studies found that,
under certain conditions, long-lasting ITBNs were relatively more cost-effective than
conven-tional ITBNs [
34
,
37
].
Five studies on indoor lead removal for reducing lead poisoning and sequelae consistently
found this intervention to be highly cost-beneficial, accruing considerable net benefits [
47–51
].
Three studies on retrofitting insulation found that retrofitting insulation was highly
cost-effec-tive or cost-beneficial [
11–13
,
25
,
52
].
The evidence was more mixed around the cost-effectiveness or cost-benefit for HSAM and
provision of smoke-alarms. Seven studies of HSAM for reducing injury (predominantly falls)
had mixed results, but tended towards being cost-effective/cost-beneficial overall. One study
found HSAM not to be cost-effective among older people [
43
]. Another study found HSAM
likely be cost-effective among older people [
41
]. Relatively high cost-effectiveness was found in
two studies [
40
,
44
] for older people and one study [
42
] for the general population. Similarly,
another study [
39
] suggested HSAM was a very cost-effective intervention among older people,
producing health gain below the WHO
’
s standard cost-effectiveness threshold [
23
] of the
per-Fig 3. Intervention types included in the study.Table 3. Summary of quality assessment and domain scores of included studies.
Authors Scored domains Summary scores
Study design
Effectiveness estimation
Cost estimation
Analysis Interpretation of results
Number of items scored
Sum of scores
Total average score
Provided insecticide-treated bednets or insecticide-treated hammocks
Bhatia et al, 2004 [26]
Score granted 11 8 7 17 10 29 53 1.83
% of maximum (domain) score
79% 100% 88% 94% 100% 91%
Goodman et al, 2001 [27]
Score granted 12 8 3 14 10 30 47 1.57
% of maximum (domain) score
86% 80% 38% 78% 100% 78%
Guyatt et al, 2002 [28,29]
Score granted 9 8 1 3 9 26 30 1.15
% of maximum (domain) score
64% 100% 17% 21% 90% 58%
Kamolratanakul et al, 2001 [30]
Score granted 11 8 2 9 9 27 39 1.44
% of maximum (domain) score
79% 100% 25% 64% 90% 72%
Morel et al, 2005 [31]
Score granted 10 6 3 8 10 28 37 1.32
% of maximum (domain) score
71% 75% 38% 50% 100% 66%
Morel et al, 2013 [32]
Score granted 9 8 6 7 10 28 40 1.43
% of maximum (domain) score
64% 100% 75% 44% 100% 71%
Mueller et al, 2008 [33]
Score granted 8 10 6 15 9 30 48 1.60
% of maximum (domain) score
57% 100% 75% 83% 90% 80%
Pulkki-Brännström et al, 2012 [34]
Score granted 11 7 4 13 10 28 45 1.61
% of maximum (domain) score
79% 88% 50% 81% 100% 80%
Smithuis et al, 2013 [35]
Score granted 8 8 2 7 9 28 34 1.21
Table 3. (Continued)
Authors Scored domains Summary scores
Study design
Effectiveness estimation
Cost estimation
Analysis Interpretation of results
Number of items scored
Sum of scores
Total average score
% of maximum (domain) score
57% 100% 25% 44% 90% 61%
Wiseman et al, 2003 [36]
Score granted 8 7 7 9 9 28 40 1.43
% of maximum (domain) score
57% 88% 88% 56% 90% 71%
Yukich et al, 2008 [37]
Score granted 10 7 5 8 9 28 39 1.39
% of maximum (domain) score
71% 88% 63% 50% 90% 70%
Yukich et al, 2009 [38]
Score granted 7 10 6 10 9 29 42 1.45
% of maximum (domain) score
50% 100% 75% 63% 90% 72%
Provided home safety assessment and modification
Church et al, 2011 [39]
Score granted 8 8 1 17 10 28 44 1.57
% of maximum (domain) score
57% 100% 17% 94% 100% 79%
Frick et al, 2010 [40]
Score granted 11 8 3 16 9 29 47 1.62
% of maximum (domain) score
79% 100% 38% 89% 90% 81%
Jutkowitz et al, 2012 [41]
Score granted 6 8 3 16 10 29 43 1.48
% of maximum (domain) score
43% 100% 38% 89% 100% 74%
Keall et al, 2014 [42]
Score granted 6 6 6 6 6 28 30 1.07
% of maximum (domain) score
43% 75% 75% 38% 60% 54%
Kochera et al, 2002 [43]
Score granted 5 5 4 5 2 28 21 0.75
Table 3. (Continued)
Authors Scored domains Summary scores
Study design
Effectiveness estimation
Cost estimation
Analysis Interpretation of results
Number of items scored
Sum of scores
Total average score
% of maximum (domain) score
36% 63% 50% 31% 20% 38%
Ling et al, 2008 [44]
Score granted 4 7 2 2 3 27 18 0.67
% of maximum (domain) score
29% 88% 25% 14% 30% 33%
Salkeld et al, 2000 [45]
Score granted 7 8 6 11 9 28 41 1.46
% of maximum (domain) score
50% 100% 75% 69% 90% 73%
Increased home ventilation
Franchimon et al, 2008 [46]
Score granted 7 7 3 9 6 28 32 1.14
% of maximum (domain) score
50% 88% 38% 56% 60% 57%
Removed indoor lead (paint and dust)
Brown, 2002 [47] Score granted 11 8 5 14 8 29 46 1.59
% of maximum (domain) score
79% 100% 63% 78% 80% 79%
Dixon et al, 2012 [48]
Score granted 6 6 2 3 9 27 26 0.96
% of maximum (domain) score
43% 75% 25% 21% 90% 48%
Gould, 2009 [49] Score granted 5 6 4 4 9 27 28 1.04
% of maximum (domain) score
36% 75% 50% 29% 90% 52%
Nevin et al, 2008 [50]
Score granted 5 7 4 6 8 27 30 1.11
% of maximum (domain) score
36% 88% 50% 43% 80% 56%
Pichery et al, 2011 [51]
Score granted 11 7 8 10 10 28 46 1.64
% of maximum (domain) score
79% 88% 100% 63% 100% 82%
Table 3. (Continued)
Authors Scored domains Summary scores
Study design
Effectiveness estimation
Cost estimation
Analysis Interpretation of results
Number of items scored
Sum of scores
Total average score
Retrofitted insulation and/or installed heaters
Barton et al, 2007 [10]
Score granted 3 6 6 13 4 29 32 1.10
% of maximum (domain) score
21% 75% 75% 72% 40% 55%
Chapman et al, 2004 [11–13]
Score granted 7 8 3 11 10 27 39 1.44
% of maximum (domain) score
50% 100% 38% 79% 100% 72%
Grimes et al, 2012 [25]
Score granted 8 7 6 10 8 28 39 1.39
% of maximum (domain) score
57% 88% 75% 63% 80% 70%
Levy et al, 2003 [52]
Score granted 5 8 3 8 9 28 33 1.18
% of maximum (domain) score
36% 100% 38% 50% 90% 59%
Preval et al, 2010 [53]
Score granted 13 8 5 12 10 29 48 1.66
% of maximum (domain) score
93% 100% 63% 67% 100% 83%
Provided smoke alarm
Ginnelly et al, 2005 [54]
Score granted 7 7 5 6 9 23 34 1.48
% of maximum (domain) score
50% 88% 83% 75% 90% 74%
Haddix et al, 2001 [55]
Score granted 9 8 6 9 10 27 42 1.56
% of maximum (domain) score
64% 100% 75% 64% 100% 78%
Liu et al, 2012 [58] Score granted 14 10 7 18 10 30 59 1.97
% of maximum (domain) score
100% 100% 88% 100% 100% 98%
Regulated tap water temperature
Han et al, 2007 [56]
Score granted 8 7 1 11 9 27 36 1.33
capita GDP level. Finally, one study found HSAM to be cost-saving among older people with a
previous fall (but not among all older people) [
45
].
The three studies of smoke alarm provision found mixed evidence favoring
cost-effective-ness. One study found that giving away smoke alarms was unlikely to be cost-effective [
54
]. In
contrast, another found that both giving away and installing smoke-alarms was cost-effective
and cost-beneficial, with the give-away programs being relatively more cost-effective than the
installation program [
58
]. And the third study found this intervention to be cost-saving [
55
].
Finally, the economic evidence was inconclusive for installing heaters and insufficient for
home ventilation and regulating tap water temperatures. Three studies of installing heaters
could either not establish the cost-effectiveness of this intervention [
10
,
25
] or found
cost-effec-tiveness only if the intervention was targeted at households with high asthma rates [
53
]. One
study found home ventilation to be cost-effective [
46
], but we note that this study may have
had a financial conflict of interest. Both studies examining regulating tap water temperature
found this intervention to be cost-effective [
56
,
57
], but we judged this body of evidence too
small in size to be considered conclusive.
Discussion
Main findings and interpretation
This review identified 35 economic analyses of housing improvement interventions, of which
12 involved ITBNs or ITHs. Most of the included studies were cost-effectiveness analyses that
either used decision analytic modeling or were conducted alongside randomized controlled
tri-als or other experimental studies and that adopted a health sector perspective. Overall, the
quality of the body of evidence is probably acceptable for informing policy-making regarding
some intervention types (i.e., provision of ITBNs or ITHs, lead paint removal and retrofitting
of insulation). But there is still considerable scope for additional studies and for improvements
in study quality for other types of housing interventions. Furthermore, few studies determined
the relative cost-effectiveness of different housing interventions (i.e., HSAM versus home
insu-lation), and no study determined the cumulative cost-effectiveness of implementing two or
more housing interventions at once (e.g., HSAM plus home insulation).
Table 3. (Continued)
Authors Scored domains Summary scores
Study design
Effectiveness estimation
Cost estimation
Analysis Interpretation of results
Number of items scored
Sum of scores
Total average score
% of maximum (domain) score
57% 70% 17% 79% 90% 67%
Phillips et al, 2011 [57]
Score granted 10 8 4 8 10 27 40 1.48
% of maximum (domain) score
71% 100% 50% 57% 100% 74%
Total average domain score (%)
59% 94% 54% 62% 86%
Table 4. Interventions compared, study objectives and main study conclusions of included studies.
Authors Comparison Study objective Study authors’health-related conclusions [Reviewers’health-related conclusions]
Provided insecticide-treated bednets (ITBNs) or insecticide-treated hammocks (ITHs)
Bhatia et al, 2004 [26]
ITBNs vs standard practice To estimate the cost-effectiveness of ITBNs in preventing malaria infection
ITBNs had a cost per malaria infection averted of Rs1,848 (US$52). [Assuming a cost-effectiveness threshold of US$50 per malaria infection averted, ITBNs were not cost-effective.]
Goodman et al, 2001 [27]
ITBNs vs indoor residual spraying
To estimate the cost-effectiveness of ITBNs in preventing malaria infection
ITBNs were more effective and more costly at a cost per death averted of R11,718 (US$1,915). Guyatt et al, 2002
[28,29]
ITBNs vs standard practice To estimate the cost-effectiveness of ITBNs in preventing malaria infection [28]
ITBNs had a cost per malaria infection averted of US$29 [28]. [Assuming a cost-effectiveness threshold of US$50 per malaria infection averted, ITBNs were highly cost-effective.]
As above As above To estimate the cost-benefit of ITBNs in
preventing malaria infection [29]
ITBNs had a cost per person protected from malaria infection of US$2.34 [29]. [Assuming a cos-effectiveness threshold of US$50 per malaria infection averted, ITBNs were highly cost-effective.]
Kamolratanakul et al, 2001 [30]
ITBNs vs standard practice To estimate the cost-effectiveness of ITBNs in preventing malaria infection
ITBNs had a cost per malaria infection averted of US$1.54. [Assuming a cost-effectiveness threshold of US$50 per malaria infection averted, ITBNs were highly cost-effective.] Morel et al, 2005
[31]
ITBNs plus other interventionsavs standard practice
To estimate the cost-effectiveness of ITBNs plus other interventionsain preventing malaria infection
ITBNs plus other interventionsawere cost-effective at incremental cost per DALY averted of at less than Int$60 in both regions of Africa. Morel et al, 2013
[32]
Long-lasting ITHs vs standard practice
To estimate the cost-effectiveness of using long-lasting ITHs in preventing malaria infection
Long-lasting ITHs could be cost-effective at average savings per malaria infection averted of US$14.60. [Assuming a cost-effectiveness threshold of US$50 per malaria infection averted, long-lasting ITHs were highly cost-effective.]
Mueller et al, 2008 [33]
Long-lasting ITBNs vs standard practice
To estimate the cost-effectiveness of ITBNs in preventing malaria infection among children
Long-lasting ITBNs were cost-effective at a cost per DALY averted of US$16.39.
Pulkki-Brännström et al, 2012 [34]
Long-lasting ITBNs vs conventional ITBNs
To estimate the cost-effectiveness of long-lasting ITBNs compared with conventional ITBNs in preventing malaria infection
If conventional and long-lasting ITBNs have the same physical lifespan (3 years), long-lasting ITBNs are more cost-effective unless they are priced at more than US$1.5 above the price of conventional nets. Distributing replenishment nets each year in addition to the replacement of all nets every 3–4 years costs US$1,080 to US $1,610 per additional under-5 death averted. Smithuis et al, 2013
[35]
ITBNs vs standard practice To estimate the cost-effectiveness of ITBNs in preventing malaria infection among children
ITBNs had a cost per DALY averted of Int$51. [It is impossible to contextualize this in terms of the per capita GDP as this measure is not available in 2013 for Myanmar [24], but we consider the cost per DALY averted to be highly cost-effective.]
Wiseman et al, 2003 [36]
ITBNs vs standard practice To estimate the cost-effectiveness of ITBNs in preventing malaria infection among children
ITBNs were highly cost-effective at a cost per LYS of US$34.
Yukich et al, 2008 [37]
Long-lasting ITBNs vs conventional ITBNs
To estimate the cost-effectiveness of long-lasting ITBNs vs conventional ITBNs in preventing malaria infection
Long-lasting ITBNs were more cost-effective than conventional ITBNs. The cost per treated-net year of protection ranged from US$1.38 in Eritrea to US$1.90 in Togo for long-lasting ITBNs, but from US$1.21 in Eritrea to US$6.05 in Senegal for conventional ITBNs.
Table 4. (Continued)
Authors Comparison Study objective Study authors’health-related conclusions [Reviewers’health-related conclusions]
To estimate the cost-effectiveness of long-lasting ITBNs vs conventional ITBNs in preventing malaria infection among children
Long-lasting ITBNs were more cost-effective than conventional ITBNs among children. The cost per child death averted ranged from US $502 to US$692 for long-lasting ITBNs, but from US$438 to US$2,199 for conventional ITBNs. Yukich et al, 2009
[38]
ITBNs vs standard practice To estimate the cost-effectiveness of ITBNs in preventing malaria infection among children
ITBNs were cost-effective at a cost per DALY averted of US$13 to US$44.
Provided home safety assessment and modification (HSAM)
Church et al, 2011 [39]
HSAM vs standard practice To estimate the cost-effectiveness of HSAM in preventing falls among older people with a previous injurious fall
HSAM had a cost per QALY gained of AU $57,856. [Assuming a base year of 2010 and one 2010 per-capita GDP of Australia [24] as the cost-effectiveness threshold [23], HSAM was highly cost-effective.]
Frick et al, 2010 [40] HSAM vs standard practice To estimate the cost-effectiveness of HSAM in preventing falls among older people
HSAM was less expensive and more effective than standard of care.
Jutkowitz et al, 2012 [41]
HSAM vs standard practice To estimate the cost-effectiveness of HSAM in addressing functional difficulties, performance goals and home safety among older people
HSAM had a cost per LYS of US$13,179. Investment in HSAM may be worthwhile depending on society’s willingness to pay. Keall et al, 2014
[42]
HSAM vs standard practice To estimate the cost-effectiveness of HSAM in preventing injuries among the general population
HSAM was very cost-effective at a cost per DALY averted of NZ$14,300.
Kochera et al, 2002 [43]
HSAM vs standard practice To estimate the cost-benefit of HSAM in preventing falls among older people
HSAM had a cost per injury averted of US $8,319.
Ling et al, 2008 [44] HSAM vs standard practice To estimate the cost-benefit of HSAM in preventing falls among older people
HSAM was highly cost-saving at an average cost of US$800 and an averted cost of $1,728, with a cost-benefit ratio of 1:3.2.
Salkeld et al, 2000 [45]
HSAM vs standard practice To estimate the cost-effectiveness of HSAM in preventing falls among older people and among older people with a previous injurious fall
HSAM had an average cost of AUS$1,921 per fall averted among all older people, but was cost-saving among older people with a previous injurious fall.
Increased home ventilation
Franchimon et al, 2008 [46]
Increased home ventilation vs standard practice
To estimate the cost-effectiveness of building ventilation for preventing chronic lung disease
Increased home ventilation was cost-effective at a cost per DALY averted of€18,000.
Removed indoor lead (paint and dust)
Brown, 2002 [47] Strict versus limited enforcement of lead poisoning prevention housing policies
To estimate the cost-benefit of strict versus limited enforcement of lead poisoning prevention housing policies in preventing lead poisoning among children
Strict enforcement compared with limited enforcement had net benefits per lead poisoning averted of US$45,360.
Dixon et al, 2012 [48]
Lead-safe window replacement vs window repair
To estimate the cost-benefit of lead-safe window replacement in preventing lead poisoning among children
Lead-safe window replacement compared to window repair had net benefits of US$1,700 to US$2,000 per housing unit.
Gould, 2009 [49] Lead abatement vs standard practice
To estimate the cost-benefit of lead abatement among children
Lead abatement had a large net benefit of $181 billion to US$269 billion, with a cost-benefit ratio of 1:17 to 1:221.
Nevin et al, 2008 [50]
Lead-safe window replacement vs standard practice
To estimate the cost-benefit of lead-safe window replacement in preventing lead poisoning among children
Lead-safe window replacement had a large net societal benefit of at least US$67 billion (including the benefit from preventing IQ reduction but excluding other health benefits). Pichery et al, 2011
[51]
Lead abatement vs standard practice
To estimate the cost-benefit of lead abatement in preventing lead poisoning among children
Lead abatement had a large net benefit of €0.25 billion to€3.78 billion.
Retrofitted insulation and/or installed heater
Barton et al, 2007 [10]
Retrofitting insulation and installing heater vs standard practice
To estimate the cost-effectiveness of retrofitting insulation and installing heaters
The study could not estimate the cost-effectiveness of retrofitting insulation and installing heater.
In summary, this review found that several housing improvement interventions were
cost-effective or cost-beneficial in general. There was a considerable amount of consistent evidence
of relatively high quality for the cost-effectiveness or favorable cost-benefit of providing ITBNs
or ITHs, removing indoor lead paint or dust and retrofitting insulation. In contrast, evidence
on providing HSAM and giving away or installing smoke alarms while mostly of acceptable
quality had mixed results (though favoring cost-effectiveness) and, for providing smoke
alarms, was relatively small (n = 3 studies). The relatively small body of evidence on installing
Table 4. (Continued)Authors Comparison Study objective Study authors’health-related conclusions [Reviewers’health-related conclusions]
Chapman et al, 2004 [11–13]
Retrofitted insulation vs standard practice
To estimate the cost-benefit of retrofitting insulation
Retrofitting insulation was cost-beneficial, with a cost-benefit ratio of 1:1.5 to 1:2.
Grimes et al, 2012 [25]
Retrofitted insulation and installed heater vs standard practice
To estimate the cost-benefit of retrofitting insulation and installing heaters
Retrofitting insulation and installing heaters had a net benefit of NZ$0.95 billion. The benefits attributable to retrofitting insulation dominated, and the study could not estimate the benefits attributable to installing heaters.
Levy et al, 2003 [52] Retrofitted insulation vs standard practice
To estimate the cost-benefit of retrofitting insulation
Retrofitting insulation averted health costs of US $1.3 billion per year.
Preval et al, 2010 [53]
Targeted installing of heater vs standard practice
To estimate the cost-benefit of targeted installing of heaters
Targeted installing of heaters was cost saving from health-related benefits alone, with a cost-benefit ratio of 1:1.09.
Untargeted installing of heaters vs standard practice
To estimate the cost-benefit of untargeted installing of heaters
Untargeted installing of heaters was not cost saving, with a cost-benefit ratio of 1:0.31.
Provided smoke alarms
Ginnelly et al, 2005 [54]
Gave away smoke alarms vs standard practice
To estimate the cost-effectiveness of giving away smoke alarms for reducingfire-related injury and death
Giving away smoke alarms is unlikely to be cost-effective.
Haddix et al, 2001 [55]
Gave away smoke alarms vs standard practice
To estimate the cost-effectiveness of giving away smoke alarms for reducingfire-related injury and death
Giving away smoke alarms was cost saving, with almost US$1 million saved overfive years.
Liu et al, 2012 [58] Gave away smoke alarms vs standard practice
To estimate the cost-effectiveness of giving away and installing smoke alarms for reducing
fire-related injury and death
Installing smoke alarms was more cost-effective than giving away smoke alarms at an average cost-effectiveness ratio per QALY gained of US $51,404 and US$45,630, respectively. Installed smoke alarm vs
standard practice
To estimate the cost-benefit of installing smoke alarms for reducingfire-related injury and death
Both giving away and installing smoke alarms were cost-beneficial, with cost-benefit ratios of 1:2.1 and 1:2.3, respectively.
Regulated tap water temperature
Han et al, 2007 [56] public health legislative / educational strategy vs standard practice
To estimate the cost-effectiveness of a public health legislative / educational strategy for reducing tap water scalds among children
A public health legislative / educational strategy was cost saving, with a cost per scald averted of C$531.
Phillips et al, 2011 [57]
Installing thermostatic mixer valves vs standard practice
To estimate the cost-effectiveness of installing thermostatic mixer valves for reducing tap water scalds
Installing thermostatic mixer valves is very likely to be cost-effective at the cost per bath water scald averted of £1,887 to £75,520.
To estimate the cost-benefit of installing thermostatic mixer valves for reducing tap water scalds
Installing thermostatic mixer valves is very likely to be cost-beneficial, with a cost-benefit ratio of 1:1.4.
Notes:
AU$: Australian dollar; C$: Canadian dollar; DALY: disability adjusted life year; GDP: gross domestic product; HSAM: home safety assessment and modification; Int$: international dollar; ITBNs: insecticide-treated bednets; ITHs: insecticide-treated hammocks; LYS: life years saved; NZ$: New Zealand dollar; QALY: quality-adjusted life year; R: South African rand; Rs: Indian rupee; US$: United States dollar.