THERMODYNAMIC, ECONOMIC AND EMISSIONS ANALYSIS
OF A MICRO GAS TURBINE COGENERATION SYSTEM
OPERATING ON BIOFUELS
Guaratinguetá - São Paulo BRAZIL
BENJAMIN KUNTE
Thermodynamic, Economic and Emissions Analysis of a Micro Gas Turbine Cogeneration System operating on Biofuels
UNESP
Universidade Estadual Paulista “Júlio de Mesquito Filho”
Campus de Guaratinguetá
Benjamin Kunte
Thermodynamic, Economic and Emissions Analysis of a Micro Gas Turbine Cogeneration System operating on Biofuels
Dissertation submitted to the Faculty of Engineering of Guaratinguetá, São Paulo State University, to obtain the title of Master in Mechanical Engineering in the field of Energy.
Supervisor: Prof. Dr. José Alexandre Matelli Co-Supervisor: Prof. Dr. José Luz Silveira
K96t
Kunte, Benjamin
Thermodynamic, economic and emissions analysis of a micro gas turbine cogeneration system operating on biofuels / Benjamin Kunte – Guaratinguetá, 2015.
101 f. : il.
Bibliografia : f. 96-101
Dissertação (Mestrado) – Universidade Estadual Paulista, Faculdade de Engenharia de Guaratinguetá, 2015.
Orientador: Prof. Dr. José Alexandre Matelli Coorientador: Prof. Dr. José Luz Silveira
1. Biocombustíveis 2. Turbinas a gás 3. Biogás I. Título
CURRICULUM VITAE
Benjamin Kunte
BIRTH 14.05.1991 – HEIDELBERG / GERMANY
PARENTS Christian Herbert Werner Kunte
Bettina Susanne Kunte
2007-2010 High School Graduation:
Ludwig-Frank-Gymnasium Mannheim, GERMANY
2010-2014 Bachelor of Science in Mechanical Engineering, at the University of Applied Sciences, Hochschule Mannheim, GERMANY
2014-2015 Master of Science in Mechanical Engineering, at Faculty of
ACKNOWLEDGEMENTS
To my supervisor, Prof. Dr. José Alexandre Matelli who never stopped encouraging me. Without his guidance, dedication and assistance, the presented study would not have been possible.
“I am not a product of my circumstances. I am a product of my decisions.”
Stephen R. Covey
“Everything should be made as simple as possible, but not simpler.”
KUNTE, B. Thermodynamic, economic and emissions analysis of a micro gas turbine
cogeneration system operating on biofuels. 2015. 101 p. Dissertation (Master in Mechanical
Engineering) - Faculty of Engineering of Guaratinguetá, São Paulo State University, Guaratinguetá, 2015.
ABSTRACT
The most promising methods to reduce greenhouse gases as well as counteract against the imminent depletion of fossil fuels are: a) the use of alternative fuels obtained from biomass, such as biogas or bio-syngas; b) enhancing the power plant efficiency by decreasing the percentage of useful energy lost to the environment. Whereas efficiency optimisation of a particular machine in a power plant, e.g. gas turbine or compressor, is a very longsome development, cogeneration can quickly and significantly increase the overall efficiency of a power plant. In this work, energetic, exergetic, emissions and economic analyses of a cogeneration system consisting of a 200 kW micro gas turbine combined with a heat recovery steam generator are introduced and conducted. Furthermore, biogas and syngas operation are compared to natural gas operation, to investigate the adequacy of these two alternative fuels for use in micro gas turbines. The proposed cogeneration plant proved to be technically feasible for all fuels, because the selected micro gas turbine Capstone C200 is available in various, fuel-specific versions with optimised fuel injection systems. The plant presented overall energetic efficiencies of 50.9%, 48.6% and 47.9% for natural gas, biogas and syngas operation, respectively. Due to very high natural gas and syngas prices, the cogeneration plant presented economic feasibility only in case of biogas operation, with short payback periods of approximately 2.8 years and high expected annual saving. Moreover, biogas has the highest ecologic efficiency and was therefore found to be the best alternative to fossil fuels.
KUNTE, B. Análise termodinâmica, econômica e de emissões de sistemas de cogeração
baseados em microturbinas operando com biocombustíveis. 2015. 101 f. Dissertação
(Mestrado em Engenharia Mecânica) – Faculdade de Engenharia do Campus de Guaratinguetá, Universidade Estadual Paulista, Guaratinguetá, 2015.
RESUMO
Os métodos mais promissores para reduzir gases de efeito estufa, bem como combater o iminente esgotamento das reservas de energia fóssil, são: a) o uso de combustíveis alternativos obtidos a partir da biomassa, como o biogás ou gás de síntese (syngas); b) o aumento da eficiência do sistema através da redução da percentagem de energia útil perdido para o ambiente. Enquanto a otimização da eficiência de uma determinada máquina da central elétrica, por exemplo, turbina a gás ou compressor, é um desenvolvimento muito demorado, a cogeração pode rápida e significativamente aumentar a eficiência global da central. Neste trabalho, análise termodinâmica, econômica e de emissões de um sistema de cogeração baseado em uma microturbina a gás de 200 kW combinado com uma caldeira de recuperação são conduzidas. Além disso, a operação de biogás e syngas é comparada com a operação de gás natural para investigar a pertinência destes dois combustíveis alternativos para o uso em micro turbinas a gás. A central de cogeração proposta mostrou-se tecnicamente viável para todos os combustíveis, porque a microturbina selecionada é disponível em várias versões, específicas para cada combustível, com sistemas de injeção de combustível otimizados. A central apresentou eficiências energéticas globais de 50,9%, 48,6% e 47,9% para operação com gás natural, biogás e syngas, respectivamente. Devido aos preços muito elevados do gás natural e do syngas, a central de cogeração apresentou viabilidade econômica apenas no caso de operação com biogás, com curtos períodos de retorno de aproximadamente 2,8 anos e alta economia anual esperada. Além disso, o biogás tem a maior eficiência ecológica e, portanto, apresentou-se como a melhor alternativa aos combustíveis fósseis.
LIST OF FIGURES
Figure 1 - Capstone C200 MGT ... 21
Figure 2 - Cutaway view of a Capstone C65 MGT ... 23
Figure 3 - Comparison of partial load of a MGT micro-grid ... 25
Figure 4 - Schematic overview of biomass to bio-fuel conversion chains ... 28
Figure 5 - Anaerobic biogas digestion process ... 30
Figure 6 - Anaerobic biodigester ... 31
Figure 7 - Syngas gasification and cleaning processes... 34
Figure 8 - Correctional coefficients for the local temperature ... 36
Figure 9 - Correctional coefficient for the local altitude ... 36
Figure 10 - Correctional coefficient for the local humidity on the heat rate ... 37
Figure 11 - Correctional coefficient for the local humidity on the shaft power ... 37
Figure 12 - Schematic overview of the cogeneration plant using a Capstone C200 ... 39
Figure 13 - Influence of ambient temp. and pressure on power output of Capstone C200 ... 43
Figure 14 - Net power output of Capstone C200 limited by power electronics ... 44
Figure 15 - Influence of the LHV on electric efficiency of a 100 kW MGT ... 47
Figure 16 - Graphical interpretation of adiabatic flame temperature ... 52
Figure 17 – Graphical analysis of pinch point ... 60
Figure 18 - Price of NG depending on monthly consumption ... 74
Figure 19 - Specific heat curves of combustion gases of each fuel ... 81
Figure 20 - Temperature and enthalpy profiles for NG, biogas and syngas operation... 82
Figure 21 - Irreversibility of each component ... 86
Figure 22 - Mean percentage distribution of irreversibilities in the components ... 87
Figure 23 - Electric power production costs with variation of the annual interest rate ... 90
Figure 24 - Steam production costs with variation of the annual interest rate ... 91
Figure 25 - Development of annuity factor over time, depending on annual interest rate ... 92
LIST OF TABLES
Table 1 – Typical natural gas composition in São Paulo ... 26
Table 2 - Literature comparison of biogas compositions ... 31
Table 3 - Adopted biogas composition (anaerobic digestion of lignocellulosic biomass) ... 32
Table 4 - Typical syngas compositions of CFB gasification of lignocellulosic biomass ... 34
Table 5 - Selected syngas composition (CFB gasification of lignocellulosic biomass) ... 35
Table 6 - Nominal data of the Capstone C200 Micro Gas Turbine ... 40
Table 7 - Important adopted and estimated values ... 41
Table 8 - Influence of ambient temperature on data of MGT C200 ... 43
Table 9 - Influence of inlet pressure drop on power output and efficiency of MGT C200 ... 45
Table 10 - Influence of back pressure on power output and efficiency of MGT C200... 46
Table 11 - Composition of the NG combustion gases considering 529.3 %EA ... 54
Table 12 - Composition of the biogas combustion gases considering 515.4 %EA ... 55
Table 13 - Composition of the syngas combustion gases considering 592.8 %EA ... 55
Table 14 - Pollution limits considering international air quality standards ... 68
Table 15 - Ecologic efficiency values ... 69
Table 16 - Price rates of NG for commercial use (November 2015) ... 73
Table 17 - Price rates of NG for commercial use (in USD and kg) ... 74
Table 18 - Comparison of turbine data adjustment methods ... 77
Table 19 - State variables for NG operation ... 78
Table 20 - State variables for biogas operation ... 79
Table 21 - State variables for syngas operation ... 79
Table 22 - Overview of important energetic data of the cogeneration system ... 80
Table 23 - Exergetic data at points 1 through 10 for NG operation ... 83
Table 24 - Exergetic data at points 1 through 10 for biogas operation ... 83
Table 25 - Exergetic data at points 1 through 10 for syngas operation ... 84
Table 26 - Overview of all component efficiencies ... 85
Table 27 - Pollutant emissions per kg of fuel and per year ... 88
Table 28 - Pollution indicator and ecologic efficiency ... 88
LIST OF ABBREVIATIONS AND ACRONYMS
BRL Brazilian Real
CHP Combined Heat and Power CG Combustion Gases
EES Engineering Equation Solver HRSG Heat Recovery Steam Generator LHV Lower Heating Value
MGT Micro Gas Turbine NG Natural Gas
USD United States Dollar
LIST OF SYMBOLS
a Altitude [m]
Cel Power production costs [USD/kWh]
CFEff Correction factor for Efficiency [-]
CFP Correction factor for Power output [-]
C Cost or Price [USD/kWh]
CM,cb Maintenance and operation costs of conventional boiler system [USD/kWh] CM,gts Maintenance and operation costs of MGT system [USD/kWh]
(CO2)e CO2-equivilent of exhaust gases [kg/kg]
(CO2) Mass of CO2 in exhaust gases per mass of fuel [kg/kg] (SO2) Mass of SO2 in exhaust gases per mass of fuel [kg/kg] (NOx) Mass of NOx in exhaust gases per mass of fuel [kg/kg]
Cspc Conventional boiler steam production costs [USD/kWh]
Cst Steam production costs [USD/kWh]
cp Specific heat at constant pressure [kJ/kg K]
Eel Power generated by MGT [kW]
Effecrec Effectiveness of recuperator [-]
Efuel Energy supplied by fuel per unit of time [kW]
EM Mass of pollutant in combustion emissions per mass of fuel [kg/kg]
ER Heat flow recovered from exhaust gases [kW]
Elos Energy losses per unit of time [kW]
Est Heat flow effectively transferred into water / steam in HRSG [kW]
exi Specific exergy at point i [kJ/kg]
Ex Exergy [kJ]
Ėxi Exergy flow rate at point i [kW]
f Annuity factor [year -1]
fcAlt Correctional coefficient for local altitude [-] fcT Correctional coefficient for local temperature [-]
fcUe Correctional coefficient for local humidity [-]
g Gravitational acceleration [m/s2]
H Hours of operation per year [h/year]
Hi Total enthalpy at point i per unit of time [kW]
hi Specific enthalpy at point i [kJ/kg]
hp Specific enthalpy of the saturated liquid in HRSG [kJ/kg]
HR Heat Rate [kJ/kWh]
Ij Irreversibility of component j [kW]
IHRSG Investment in the HRSG [USD]
IMGT Investment in the MGT [USD]
Igts Investment in the gas turbine system [USD]
k Payback, amortisation period of the investment [years] kciv Factor for civil engineering and transportation cost [-]
kimport Factor for import and tax cost [-]
M Molar mass [g/mol]
ṁair Inlet air flow [kg/s]
ṁ Mass flow [kg/s]
ṁst,ai Steam flow in HRSG calculated using initial exhaust temp. T7ai [kg/s]
ṁst Steam flow in HRSG adjusted by pinch point [kg/s]
N Number of moles [mol]
nH2S Mass of H2S in the fuel per mass of fuel [kg/kg]
P0 Average sea-level pressure [kPa]
Pa Local atmospheric pressure [kPa]
Pel Electric energy price [USD/kWh]
Poil Price of fuel oil used in conventional steam generators [USD/kWh]
ps Process steam pressure [kPa]
pi Pressure at point i [kPa]
PR Pressure ratio of the compressor [-]
q Interest rate quotient [-]
r Annual interest rate [%]
R Gas constant [kJ/kg K]
Ru Universal gas constant [kJ/kg K]
Re Expected annual saving [USD]
si Specific entropy at point i [kJ/kg K]
T0 Ambient temperature [°C]
T7ai Initially adopted exhaust gas temperature at point 7 [°C]
Ti Temperature at point i [°C]
Tp Temperature of exhaust gases at dew point in HRSG [°C]
TS Saturation temperature corresponding to pS [°C]
Ue Specific humidity [%]
Urel Relative humidity [%]
W Work / Power [kW]
wCO2 Mol of CO2 in exhaust gases per mol of fuel. [mol/mol]
WelGT Power output of MGT [kW]
Wshaft Power in turbine transferred into electric generator [kW]
%EA Amount of excess air [%]
Greek letters:
Power to heat ratio of cogeneration plant [-]
Specific heat ratio (cp / cv) [-]
∆p Pressure losses [-]
ΔTpp Pinch point temperature difference [°C]
Δh0
Enthalpy of formation [kJ/mol]
Exergetic efficiency (second-law efficiency) [-]
eco Ecologic efficiency [-]
Πg Pollution indicator [kg/MJ]
ηisoTG Isentropic efficiency of gas turbine [-]
ρair Air density [kg/m³]
φ Ratio of chemical exergy to LHV of fuel [-]
ψj Rational efficiency of component j [-]
Subscripts:
0 Reference or ambient state (25°C, 101.325 kPa) a Combustion air per mass of fuel
air Air
as Stoichiometric combustion air per mass of fuel back Back pressure
BIO Biogas c compressor
cb Conventional boiler for steam generation cc Combustion chamber
cg Combustion gases comp Compressor el Electricity / Power
FPO Cost related to the fuel per plant output fuel Fuel (natural gas, biogas or syngas)
GB Gas booster (compressor) for biogas and syngas compression ger Power generator
GT Gas turbine
gts Gas turbine system
HRSG Heat recovery steam generator i At point i (1, ... , 10)
inlet Inlet pressure drop caused by air filtering
INV Costs related to the initial investment in the plant ISO At ISO conditions
M Maintenance and operation MGT Micro gas turbine
NG Natural gas
P Products of combustion pp Pinch point
rec Recuperator (air pre-heater) R Reactants of combustion s Sensible enthalpy
shaft Turbine shaft (to electric generator)
scp Steam production cost using amortised conventional boilers burning fuel oil
st Steam
Superscripts:
‘ Not yet adjusted to local conditions CH Chemical exergy
TABLE OF CONTENTS
ABSTRACT ... 7
LIST OF FIGURES ... 9
LIST OF TABLES ... 10
LIST OF ABBREVIATIONS AND ACRONYMS ... 11
LIST OF SYMBOLS ... 12
TABLE OF CONTENTS ... 16
1 INTRODUCTION ... 18
1.1 GENERAL INFORMATION ... 18
1.2 OBJECTIVE ... 20
1.3 PROPOSED COGENERATION PLANT ... 20
1.4 STRUCTURE ... 21
2 LITERATURE REVIEW ... 22
2.1 MICRO GAS TURBINES AND COGENERATION ... 22
2.2 NATURAL GAS ... 26
2.3 BIOMASS ... 27
2.4 BIOGAS ... 29
2.5 SYNGAS ... 32
2.6 ADJUSTMENT OF GAS TURBINE DATA TO LOCAL CONDITIONS ... 35
3 MATERIAL AND METHOD ... 39
3.1 FIRST LAW OF THERMODYNAMICS ANALYSIS ... 42
3.1.1 Adjustment of Capstone C200 data to local conditions ... 42
3.1.2 Adjustment of gas turbine performance for biogas and syngas operation ... 47
3.1.3 Calculation of the percentage of excess air ... 48
3.1.4 Calculation of the turbine inlet temperature ... 51
3.1.5 Determination of the combustion gas compositions ... 54
3.1.6 Calculation of the pressures ... 56
3.1.7 Calculation of the MGT system ... 56
3.1.8 Calculation of the HRSG ... 59
3.1.9 Calculation of the cogeneration plant’s overall efficiency (ηplant) ... 61
3.2 EXERGY ANALYSIS ... 61
3.2.1 Determination of the specific exergies and specific entropies ... 63
3.2.3 Calculation of the rational efficiencies... 65
3.2.4 Calculation of the irreversibilities of each component ... 66
3.3 EMISSIONS ANALYSIS ... 67
3.3.1 Emissions analysis of natural gas firing ... 70
3.3.2 Emissions analysis of biogas firing ... 70
3.3.3 Emissions analysis of syngas firing ... 71
3.4 ECONOMIC ANALYSIS ... 71
3.4.1 Annualised production cost per kWh ... 72
3.4.2 Expected annual saving ... 75
4 RESULTS & DISCUSSION ... 77
4.1 RESULTS AND DISCUSSION OF FIRST LAW ANALYSIS ... 78
4.2 RESULTS AND DISCUSSION OF EXERGY ANALYSIS ... 82
4.3 RESULTS AND DISCUSSION OF EMISSIONS ANALYSIS ... 87
4.4 RESULTS AND DISCUSSION OF ECONOMIC ANALYSIS ... 88
5 CONCLUSION ... 94
1 INTRODUCTION
1.1 GENERAL INFORMATION
One of the most important – if not the single most important – challenges that scientists and engineers of our time are facing around the world is the reduction of global warming. Moreover, mankind as a whole, including politicians, scientists, engineers and others, must rapidly increase its efforts to diminish greenhouse gases as well as pollution and preserve the world we live in. Thus, minimisation of greenhouse gases released into the atmosphere has become a major goal in the field of power generation.
Nevertheless, fuel-fired power plants will remain the predominant source for power generation in the foreseeable future, because alternative energies such as nuclear power, solar power, wind power and hydropower all underlie their own limitations and problems such as environmental impacts, disproportionately high costs, fluctuating generating conditions and regional restrictions, to only name a few. Therefore, the most promising methods to reduce the greenhouse gases in the atmosphere are the use of alternative fuels such as biogas or syngas (obtained from biomass) and enhancing the power plant efficiency by decreasing the percentage of useful energy lost to the environment. The main advantage of biogas and syngas, besides being renewable energy sources, is that their use in thermal power plants is considered cleaner than natural gas (NG) use, in regard to the whole life cycle of the carbons. As a result, the carbon-dioxide-equivalents of the emissions released into the atmosphere are lower, which reduces the environmental impacts, especially regarding global warming. Additionally, the use of biogas or syngas can counteract against the imminent depletion of fossil fuels. Furthermore, whereas efficiency optimisation of a particular machine in a power plant, e.g. gas turbine or compressor, is a very longsome development, cogeneration is a relatively simple and quickly applicable method to significantly increase the overall efficiency of any thermal power plant. Cogeneration is defined as the simultaneous generation of mechanical energy and useful heat, e.g. power and saturated steam.
polluting. According to Somehsaraei et al. (2014), electrical efficiency of micro gas turbine (MGT) systems decreases together with the percentage of methane in the fuel. However, biogas use is encouraged because the reduction in energy efficiency is less than 1% when comparing NG (90% methane) and biogas (45% methane) firing (SOMEHSARAEI et al., 2014).
Syngas, also known as synthesis gas, is produced by gasification of biomass or other solid fuels. Similar to biogas, the crude gas must pass through cleaning and filtering processes before being effectively useable in power generation. Furthermore, syngas also has great importance in researches and in the pursuit of renewable energy sources. Although its obtaining technique was already well known, it ceased to matter after World War II and only returned to relevance in the late 20th and early 21st century due to the oil crisis, environmental problems and the imminent depletion of fossil fuels (SIEDLECKI; DE JONG; VERKOOIJEN, 2011). In Brazil, the use of synthesis gas is very attractive due to the large production of biomass in the form of bagasse from sugarcane mills. In this sense, the gasification of biomass presents an important alternative to fuel MGTs generating power and useful heat. Likewise, the technology of obtaining biogas through anaerobic digestion at WWTPs is also highly recommendable, since it uses a material as a source which is found in large quantity and was previously not taken advantage of.
Besides the search for renewable and cleaner energy sources, another focal point is the rational use of primary energy. The higher the percentage of fuel energy converted into useable energy, the greater the overall efficiency of the system – even more so, if taking into account the effects on the environment. In this context of efficiency optimisation lays the importance of implementing cogeneration plants. Cogeneration consists of the combined generation of mechanical energy and useful heat by recovering thermal energy from the exhaust gases. The mechanical energy can be used to drive equipment or to generate power, while the heat can be directly applied into a process (e.g. to heat the digesters in WWTPs) or indirectly used to produce steam, hot water or chilled water. According to Silveira (1994), the efficiency of thermal power plants increases from a range of 34 - 50% to 50 - 90% by implementing cogeneration, since heat previously lost into the atmosphere is recovered and made useful.
cogeneration has proven to be the best alternative considering the optimal fuel consumption and high overall plant efficiency.
Cogeneration is already widely used in the industrial sector. For the tertiary sector, however, the implementation is not always feasible. Thus, MGTs are chosen for the cogeneration system due to the small size of the machines, enabling increased mobility and easy maintenance. In the literature, several studies researching and describing cogeneration systems operating in different conditions can be found (SILVEIRA; WALTER; LUENGO, 1997; BRIZI et al., 2014).
1.2 OBJECTIVE
The objective of this dissertation is to conduct energetic, exergetic, emissions and economic analyses of a cogeneration system consisting of a MGT generating power combined with a heat recovery steam generator (HRSG) producing saturated steam. Moreover, biogas and syngas firing are compared to NG firing to investigate how suitable these two renewable fuels are for the use in MGTs.
In the energetic analysis, the ISO-condition-data of the gas turbine Capstone C200 obtained from its manufacturer are adjusted to the climatic conditions of Guaratinguetá. Hereupon, the important energetic data are calculated for the principle points of the system to obtain the energetic efficiencies of all the single components, and of the plant as a whole.
The exergy analysis determines the exergies at each point and the irreversibilities and exergetic efficiencies of each component. Additionally, the total irreversibility and the overall exergetic efficiency are calculated.
Through the emissions analysis, plant CO2-equivalent for each fuel, pollution indicator and ecologic efficiency are all determined.
Finally, the economic analysis calculates and compares the power generation and steam production costs of the proposed plant with traditional production costs to predict the annual saving and payback period of the system.
1.3 PROPOSED COGENERATION PLANT
Capstone C200 with a nominal power output of 200 kW (see Figure 1). A schematic overview of the complete cogeneration plant is shown in Figure 12.
Figure 1 - Capstone C200 MGT
Source: (CAPSTONE TURBINE CORPORATION, 2015).
1.4 STRUCTURE
The chapter “literature review” presents information and fundamentals about the proposed MGT cogeneration system as well as the analysed fuels NG, biogas and syngas. In chapter three, titled “material and method”, energetic, exergetic, emissions and economic analyses are introduced, described and conducted for the proposed system. Subsequently, the results of the aforementioned analyses are illustrated and discussed. The last chapter is the conclusion, rounding of the work, summarising the meaning of the results and proposing further studies.
2.5 m
3.8 m
1.7 m
Approx
2 LITERATURE REVIEW
This chapter presents information and fundamentals about the proposed MGT cogeneration system, as well as the analysed fuels NG, biogas and syngas.
2.1 MICRO GAS TURBINES AND COGENERATION
Gas turbines with a power output of up to several hundred kW are usually labelled as MGTs – but as there is no official definition, each author can define the range more or less arbitrarily. The MGT mainly considered in this dissertation is the Capstone C200 with a power output of 200 kW. Some of the advantages of MGTs are their fuel flexibility and low maintenance costs. The most interesting application of these small turbines lies in distributed power generation. One of the principal advantages that several small plants have over a single larger power plant is the reduction in transmission losses.
The military and aerospace industries were the first to invest in MGTs. In these two sectors, the importance of compact, light-weight and high-powered generators traditionally outweighs the high requirements of MGTs in terms of development and production costs (PILAVACHI, 2002). Starting from there, the manufacturers developed the turbines into one of the primary power generation systems. A typical micro turbine is stage and single-shaft with a comparably low pressure ratio. Optionally, the turbine system can include a recapture of the exhaust gases to preheat the compressed air – in this case, it is called a regenerative gas turbine. This increases the electric efficiency of the system, while decreasing the potential to generate useful heat through cogeneration.
Finally, the exhaust gases leave the turbine through the outlet – steel hot enough to be further utilised.
Figure 2 - Cutaway view of a Capstone C65 MGT
Source: (GILLETTE, 2010).
range of power output. As the load increases, the highest usable percentage of biogas decreases – at full load, the limit was found to be 26%. The use of this mixture reportedly reduces CO2 emissions by about 19% at full load. The paper also states that the mixture neither has a significant influence on the electrical efficiency nor on the operating parameters.
The higher the percentage of fuel energy converted into useable energy, the greater the overall efficiency of the system – even more so, if taking into account the effects on the environment. In this context of efficiency optimisation lays the importance of implementing cogeneration plants. Cogeneration consists of the combined generation of mechanical energy and useful heat by recovering thermal energy from the exhaust gases. The mechanical energy can be used to drive equipment or to generate power, while the heat can be directly applied into a process (e.g. to heat the digesters in WWTPs) or indirectly used to produce steam, hot water or chilled water.
Cogeneration is already widely used in the industrial sector. For the tertiary sector, however, the implementation is not always feasible due to the comparably small capacities. In this output range, gas turbines demonstrate various advantages in comparison to other engine technologies, such as relatively small size and weight, less moving parts and noise as well as the opportunity to use alternative fuels (PILAVACHI, 2002). Thus, MGTs are chosen for this cogeneration system, mainly due to their high temperature exhaust gases, the increased mobility and the decreased maintenance costs. According to the manufacturer Capstone, the C200 can be fuelled by natural gas, biogas and others. To optimise their efficiency, every combined heat and power (CHP) plant requires a precise calibration of electrical and thermal load to ensure that the generated heat will be used by the consumer – electricity can usually be fed into the grid easily, if connected. Thereby, the highest overall efficiency is usually achieved, if the plant operates in thermal match mode, meaning that it follows the thermal load requirements.
allows a better controlling and managing of the produced useful heat flow. This may or may not be desired.
In their paper, Somehsaraei et al. (2014) investigated the fuel flexibility of MGT and analysed their performance using biogas. For biogas application, the exhaust gas flow and the pressure ratio decreased in comparison to NG use. Furthermore, the paper states that the electrical efficiency of micro gas turbine (MGT) systems declines with decreasing methane content and therewith decreasing LHV of the fuel. However, biogas use is encouraged, as the reduction in energy efficiency is only about 0.7% when comparing operation using NG (ca. 90% methane) and biogas (45% methane).
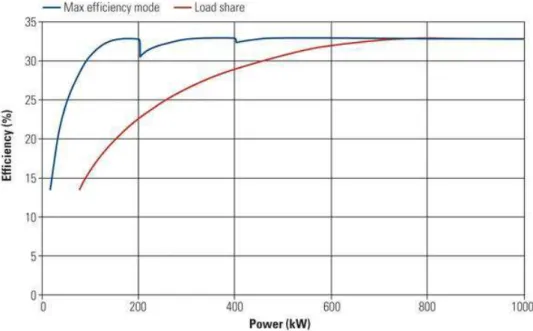
According to Gillette (2010), another advantage of MGTs in comparison to other power generating engines is the considerably cleaner exhaust gases. This can lead to a major investment advantage if a costly active exhaust clean-up is not necessary to meet given pollution restrictions. Furthermore, various MGTs can be combined to create a micro-grid with a higher power output but yet simple controlling and managing. For example, five Capstone C200 MGTs can be connected for a 1 MW power output. This provides a higher
flexibility regarding the system’s load, as the modules can separately be turned on and off to
meet the instantaneous load. Thus, the running sub-systems still operate at full-load with maximum efficiency. Figure 3 demonstrates the efficiency difference in partial load between five connected C200 MGTs in comparison to a single larger turbine. The area in-between the two curves equates to the potential fuel savings.
Figure 3 - Comparison of partial load of a MGT micro-grid
2.2 NATURAL GAS
Natural gas is the least polluting among all fossil fuels. The exact composition of NG can vary significantly, but usually about 90 vol% of it is methane. Other components are ethane, propane, butane and carbon dioxide. Furthermore, it can contain water and contaminants such as nitrogen. As NG itself is odourless, sulphur compounds have to be added for safety reasons. In accordance to the main provider of NG in São Paulo, COMGÁS (2015a), Table 1 shows the typical composition of NG in São Paulo.
Table 1 – Typical natural gas composition in São Paulo
COMPONENT VOLUME (%) MOLAR MASS
(g/mol) MASS (%) LHV (kJ/kg)
CH4 88.68 16.04 77.09 50,023*
C2H6 5.84 30.07 9.52 47,508*
C3H8 2.34 44.10 5.59 46,330*
C4H10 0.77 58.12 2.43 45,348*
C5H12 0.13 72.15 0.50 44,974*
C6H14 0.03 86.16 0.12 44,742*
CO2 1.62 44.01 3.85 –
N2 0.59 28.01 0.90 –
Total 100.00 18.45 100.00 47,053
Source: (COMGÁS, 2015a). *from EES
2.3 BIOMASS
The term biomass describes all organic matter (biological material from living or dead organisms), the largest part of it being vegetable plants, and is the only renewable carbon-containing energy source. All these biological materials contain chemical energy – plants store this energy by withdrawing CO2 from the atmosphere during photosynthesis. Therefore, biomass is considered to have a CO2-neutral lifecycle, as the same amount of CO2 is released back into the atmosphere through e.g. burning of biomass (BOERRIGTER; RAUCH, 2005). Biomass can be converted into varies forms of biofuels through biological, chemical and thermochemical processes – making it usable for different applications. Only a very small part of all the biomass on earth is available for human use, and an even smaller fraction is used to produce fuel. In the context of fuels and energy production, the vegetable biomass can be divided into three groups: lignocellulosic biomass composed of carbohydrate polymers (e.g. wood and straw), biomass with a high sugar content (e.g. sugar cane, wheat and maize) and oleaginous biomass (e.g. sunflower, soya and rapeseed). Furthermore, other common sources to produce biofuels are industrial, animal and municipal wastes and residues including the sludge produced in wastewater treatment plants (WWTP). The production of biofuels from wastes is especially environmentally friendly, as this potential was previously not taken advantage of and would otherwise simply be lost. According to Silva et al. (2013), besides the mentioned environmental advantages, the use of biofuels can also offer major economical advantages, as their lower cost can reduce the operational costs despite their small LHV.
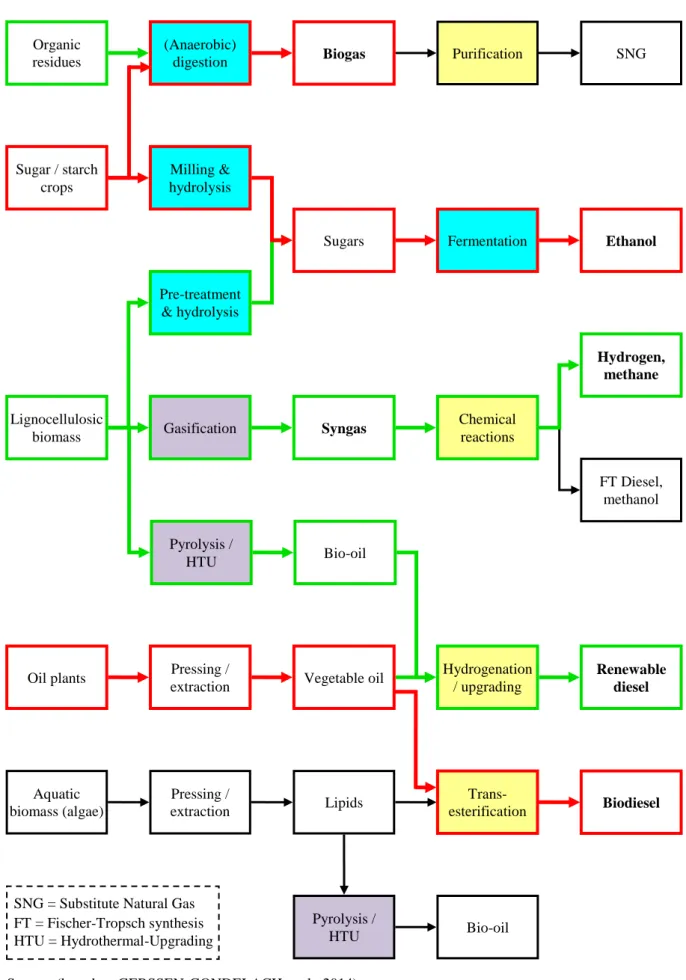
The largest percentage of energy obtained from biomass is still the traditional combustion of wood or other plants for heating and cooking purposes. This especially takes place in developing countries. In industries, on the other hand, biomass is converted into varies forms of biofuels through processes such as anaerobic digestion (biogas), gasification (syngas), fermentation (ethanol), transesterification (biodiesel) and others. Figure 4 gives an overview of the biomass to bio-fuel conversion processes.
Source: (based on GERSSEN-GONDELACH et al., 2014).
Figure 4 - Schematic overview of biomass to bio-fuel conversion chains
Organic residues
Sugar / starch crops
Lignocellulosic biomass
(Anaerobic)
digestion Biogas Purification SNG
Milling & hydrolysis
Sugars Fermentation Ethanol
Pre-treatment & hydrolysis
Gasification Syngas Chemical reactions
Hydrogen, methane
FT Diesel, methanol
Oil plants Pressing /
extraction Vegetable oil
Hydrogenation / upgrading
Renewable diesel Pyrolysis /
HTU Bio-oil
Aquatic biomass (algae)
Pressing /
extraction Lipids
Trans-esterification Biodiesel
Pyrolysis /
HTU Bio-oil SNG = Substitute Natural Gas
2.4 BIOGAS
Biogas is obtained by anaerobic digestion (without the presence of air) of organic matter (biomass) and consists mainly of methane and carbon dioxide. There are many studies regarding its obtainment and there are various types of digesters around the world that use human or animal residues as well as sugar or starch crops for the production of the gas. Most of the time, the digesters are installed along with WWTP, which makes this a source of renewable energy (CORONADO, 2007). Other plant types are co-digestion plants, farm plants and landfills. The main sources of biomass are the sludge from WWTP, sugar and starch crops, industrial and agricultural wastes and residues as well as aquatic and marine based organisms such as kelps and algae. Theoretically, other sources could be food wastes and wastes from parks and gardens – but these are currently technically and economically not feasible.
The biogas composition varies dramatically depending on the organic matter used as feedstock. In accordance to Mkoma and Mabiki (2011) and Basu et al. (2010), the main components are methane with 50-70 vol% and carbon dioxide with 20-45 vol%. Further components can be smaller amounts of hydrogen and nitrogen, as well as traces of hydrogen sulphide and oxygen. The most common composition is approximately 65 vol% methane and 35 vol% carbon dioxide. Due to the corrosive nature of the acid and incombustible gases like CO2 and H2S, biogas is very limited in terms of compressing and transporting it over longer distances. Therefore, its use is mostly limited to the location of the digesters. Furthermore, H2O in particular needs to be filtered out of the biogas, before it can be effectively used in turbines or other engines.
(hydrolysis) as well as lipases (acidogenesis) and others. Figure 6 illustrated an anaerobic digester from a technical point of view.
Figure 5 - Anaerobic biogas digestion process
Figure 6 - Anaerobic biodigester
Source: (DAHL, 2015).
Table 2 gives an overview of different biogas compositions found in the literature (BRIZI et al., 2014; BASU et al., 2010; MKOMA; MABIKI, 2011; CAMERETTI; TUCCILLO; PIAZZESI, 2013; KANG et al., 2014).
Table 2 - Literature comparison of biogas compositions
REFERENCE: Brizi et al. Basu et al. Mkoma and Mabiki
Cameretti et al. & Kang et al.
CH4 (vol.%) 62.7 55-60 50-75 65
CO2 (vol.%) 2.4 38-40 25-50 35
H2S (vol.%) 14.1 smaller amounts 50-6000 ppmv –
N2 (vol.%) 13.4 traces 0-5 –
CO (vol.%) 5.0 – – –
H2O (vol.%) 2.4 – 0-1 –
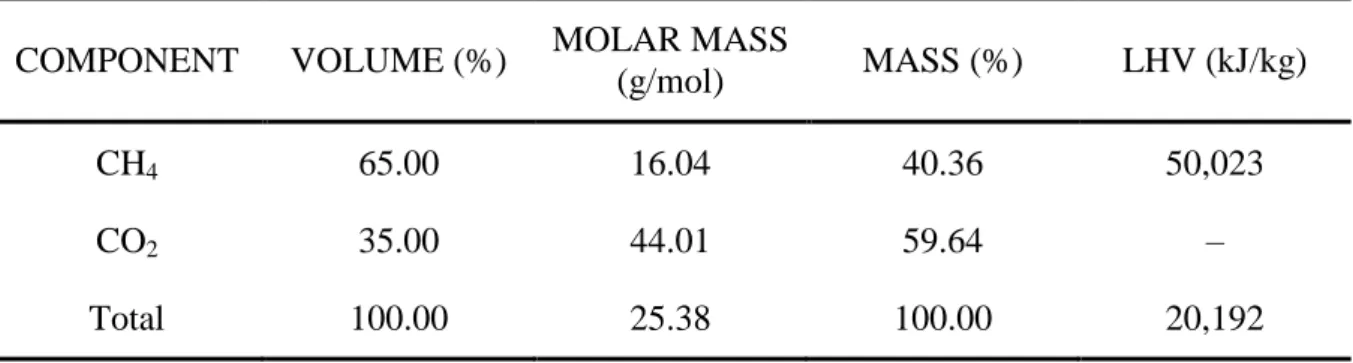
After the production process, the biogas needs to be filtered and cleaned to remove the highly corrosive hydrogen sulphides and siloxanes. The desulphurisation can be achieved through biological or chemical methods. Because the MGT Capstone C200 requires the fuels to be dry and hydrogen-sulphide-free, the biogas composition is adopted in accordance with Table 2 and is shown in Table 3.
Table 3 - Adopted biogas composition (anaerobic digestion of lignocellulosic biomass)
COMPONENT VOLUME (%) MOLAR MASS
(g/mol) MASS (%) LHV (kJ/kg)
CH4 65.00 16.04 40.36 50,023
CO2 35.00 44.01 59.64 –
Total 100.00 25.38 100.00 20,192
Source: Author himself.
2.5 SYNGAS
Synthetic fuels are produced by thermochemical processes creating a petroleum-like fuel. Therefore, synthetic fuels, unlike biofuels, can often times be fed into traditional fuel distribution systems and used in machines like gas turbines without the necessity of any machine modifications. Generally speaking, synthetic fuels are produced by breaking down complex molecules into simple ones, like carbon monoxide, methane and hydrogen, and then rebuilding them into the desired fuel. The three main methods to produce synthetic biofuels are gasification, pyrolysis and liquefaction. Both pyrolysis and liquefaction produce a bio-oil that can be further processed into renewable diesel or other fuel products. Gasification, meaning partial oxidation of biomass or other solid fuels, produces gaseous (bio-) fuels. Usually, lignocellulosic biomass (e.g. wood or bagasse) is the feedstock chosen for gasification (DILTZ; PULLAMMANAPPALLIL, 2013).
consists of water reduction reactions (including oxygen, steam, carbon monoxide and hydrogen) and burning of the fuel at high temperature and under sub-stoichiometric conditions. According to Woolcock and Broer (2012), oxygen supply needs to be limited to about 25% of the amount required to fully combust the feedstock. As gasification is an endothermic (i.e. heat absorbing) process, part of the fuel, char or gases, depending on the reactor technology, need to be burned (fully oxidised) to maintain the desired gasification temperature (BOERRIGTER; RAUCH, 2005). The most common feedstocks for gasification are coal and carbonaceous biomass. Still according to Boerrigter and Rauch (2005), pyrolysis has a higher significance in biomass gasification, because biomass usually consists of more volatile components than coal.
According to Gerssen-Gondelach et al. (2014), if the gasification temperature is 900-1000°C, the obtained gas is called product gas. This is a mixture of hydrogen, carbon monoxide, carbon dioxide, water vapour, methane and tars. Furthermore, the product gas is diluted with large amounts of nitrogen, if the gasification is performed using air instead of pure oxygen. The application range of product gas can be increased by converting it into syngas, also known as synthesis gas, by catalytic or thermal cracking. Syngas contains mainly hydrogen, carbon monoxide, carbon dioxide and water vapour. It can also be produced directly from biomass, by gasification using almost pure oxygen at higher than 1500°C. Generally, the process including product gas and ensuing conversion into syngas is economically more feasible, due to the necessity of much higher temperatures and pure oxygen for direct syngas gasification (GERSSEN-GONDELACH et al., 2014).
Before being effectively usable in most applications, product gas as well as syngas must pass through cleaning and filtering processes. This is due to impurities in the feedstock such as sulphur, alkalis and chlorine which are also gasified and need to be removed. Furthermore, some products of the gasification process itself, like tar, ash and char need to be filtered out to obtain clean syngas. Syngas gasification and cleaning processes are illustrated in Figure 7.
Figure 7 - Syngas gasification and cleaning processes
Source: (WOOLCOCK; BROER, 2012).
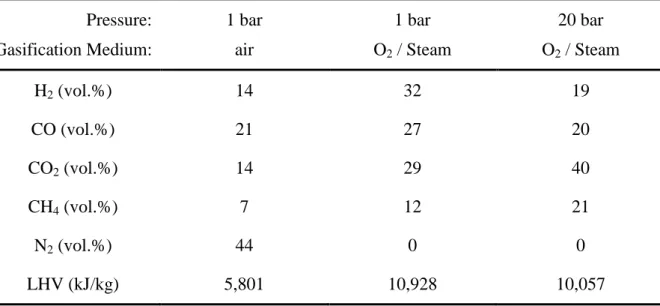
The mainly industrially used gasification reactors are fixed bed, fluidized bed and moving bed. According to Gerssen-Gondelach et al. (2014), the most commonly used is atmospheric circulating fluidized bed (CFB) gasification. Table 4 gives an overview of different syngas compositions achieved through lignocellulosic biomass gasification at 850°C and various conditions.
Table 4 - Typical syngas compositions of CFB gasification of lignocellulosic biomass Pressure:
Gasification Medium:
1 bar air
1 bar O2 / Steam
20 bar O2 / Steam
H2 (vol.%) 14 32 19
CO (vol.%) 21 27 20
CO2 (vol.%) 14 29 40
CH4 (vol.%) 7 12 21
N2 (vol.%) 44 0 0
LHV (kJ/kg) 5,801 10,928 10,057
Table 5 shows the syngas composition selected for this study in accordance to Boerrigter and Rauch (2005): CFB gasification of lignocellulosic biomass at 1 bar using oxygen and steam. This production process was selected, because it offers a good compromise between low production cost and high LHV of the syngas. According to Kang et al. (2012), a LHV smaller than 10,000 kJ/kg can reduce the surge margin of the gas turbine’s compressor so significantly, that the compressor operation becomes highly unstable.
Table 5 - Selected syngas composition (CFB gasification of lignocellulosic biomass)
COMPONENT VOLUME (%) MOLAR MASS
(g/mol) MASS (%) LHV (kJ/kg)
H2 32 2.02 2.82 119,946*
CO 27 28.01 33.03 10,102*
CO2 29 44.01 55.74 –
CH4 12 16.04 8.41 50,023*
Total 100 22.98 100.00 10,928
Source: Author himself. *from EES
2.6 ADJUSTMENT OF GAS TURBINE DATA TO LOCAL CONDITIONS
To conduct an energetic analysis, the standard ISO condition gas turbine data (determined at sea level, 15°C, and 60% relative humidity) obtained from its manufacturer need to be adjusted to the local climatic conditions. If these adjustments cannot be performed using information and statistics given by the manufacturer, universal coefficients can be determined to give an estimate.
Figure 8 - Correctional coefficients for the local temperature
Source: (based on ANTUNES, 1999).
The local altitude also affects the performance of the micro gas turbine. Figure 9 shows the effect on the shaft power and exhaust gas flow, for altitudes between 200 and 2800 m above sea level:
Figure 9 - Correctional coefficient for the local altitude
Source: (based on ANTUNES, 1999).
Figure 10 - Correctional coefficient for the local humidity on the heat rate
Source: (based on ANTUNES, 1999).
Figure 11 - Correctional coefficient for the local humidity on the shaft power
Source: (based on ANTUNES, 1999).
a.) Correction of the power in the turbine shaft using universal coefficients cUe cAlt cT ISO shaft
shaft
W
f
f
f
W
,
(1)ger ,
elGT ISO shaftW
W
(2)1.06
004
.
0
0
T
f
cT (3)9816
.
0
0001
.
0
a
f
cAlt (4)001
.
1
1333
.
0
e cUeU
f
(5)%
100
622
.
0
a rel g ep
U
p
U
(6)0628
.
0
0523
.
0
10
5
10
6
5
03
4
02
0
T
T
T
p
g (7)1000
0a
g
p
p
air a
(8)b.) Correction of the heat rate using universal coefficients
cUe cT
ISO
f
f
HR
HR
(9)97
.
0
002
.
0
0
T
f
cT (10)9975
.
0
3795
.
0
ecUe
U
f
(11)c.) Correction of the exhaust gas flow using universal coefficients
cAlt cT ISO cg
cg
m
f
f
m
,
(12)1.07
006
.
0
0
T
f
cT (13)9816
.
0
0001
.
0
a
3 MATERIAL AND METHOD
The analyses in this dissertation are conducted using the principles of ideal gases for the air and the combustion gases and assuming steady state system operation. Additionally, all processes are considered adiabatic and it is assumed that the MGT is available in specific versions (modified fuel injection system) for the combustion of NG, biogas and syngas, and that all three versions have the same price and operational data.
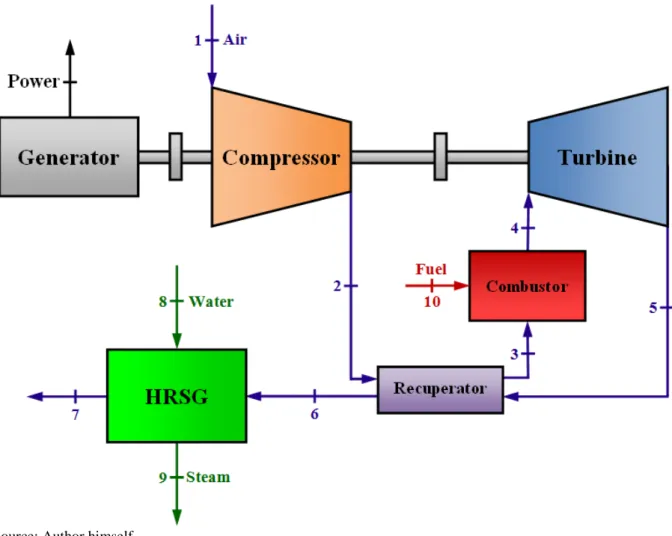
Moreover, it is assumed that the plant operates in thermal match mode, which is more efficient than power match mode. The points Ti with i = 1 ... 10 refer to Figure 12. Operation mode of the proposed MGT cogeneration system is described using Figure 12:
Figure 12 - Schematic overview of the cogeneration plant using a Capstone C200
Incoming air (point 1) is compressed (point 2) and directed through the recuperator where it is pre-heated and then (point 3) mixed with the high-pressure fuel (point 10) in the combustor. After combustion, the high-temperature and -pressure gases (point 4) are expanded through the gas turbine, transferring part of their energy onto the turbine shaft. Typically, compressor, turbine and power generator are all mounted on the same shaft – part of the energy is used to drive the compressor, the rest is transformed by the generator into high-frequency AC and must be conditioned through power electronics to provide a usable DC power output. The exhaust gases exiting the turbine (point 5) pass through the recuperator to pre-heat the compressed air and therewith reduce the fuel consumption, hence improving the electrical efficiency of the turbine. Leaving the recuperator, the exhaust gases (point 6) are fed into the HRSG along with water (point 8) to generate steam (point 9). To avoid condensation and acid formation, the temperature of the exhaust gases leaving the HRSG (point 7) must not be too low and the pinch point has to be considered. In this study, a HRSG without supplementary heating is chosen.
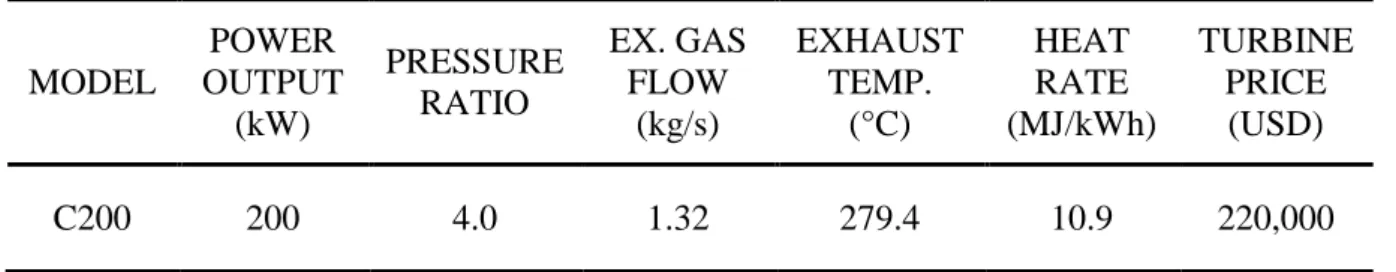
For the analyses relevant, nominal data of the MGT C200 is shown in Table 6: Table 6 - Nominal data of the Capstone C200 Micro Gas Turbine
MODEL
POWER OUTPUT
(kW)
PRESSURE RATIO
EX. GAS FLOW
(kg/s)
EXHAUST TEMP.
(°C)
HEAT RATE (MJ/kWh)
TURBINE PRICE
(USD)
C200 200 4.0 1.32 279.4 10.9 220,000
Source: (based on GAS TURBINE WORLD, 2011).
Table 7 - Important adopted and estimated values
SYMBOL DEFINITION VALUE REFERENCE
Cbio Biogas price 0.019 USD/kWh Brizi et al. (2014)
CM,cb Main. & op. cost conv. boiler sys. 0.008 USD/kWh Antunes (1999) CM,HRSG Main. and op. cost of HRSG 0.006 USD/kWh Kang et al. (2014)
CM,gts Main. and op. cost of MGT sys. 0.012 USD/kWh Barigozzi et al. (2015)
CNG NG price 0.063 USD/kWh COMGÁS (2015b)
Csyn Syngas price 0.070 USD/kWh Parajuli et al. (2014)
H Hours of operation per year 7000 h/year –
kciv Factor for civil engineering cost 1.3 Kang et al. (2014)
kimport Factor for import and tax cost 1.4 –
Pel Electric energy price 0.19 USD/kWh Bandeirante Energia
Poil Fuel oil price 0.093 USD/kWh Sun et al. (2015)
ps Process steam pressure 1.5 MPa –
Rair Gas constant of air 0.287 kJ/kg K –
T7ai Initially adopted exh. gas temp. 150°C –
T8 Steam temp. entering the HRSG 95°C –
T9 Steam temp. leaving the HRSG 250°C –
∆pcc Pressure losses in comb. chamber 0.05 Silveira et al. (2004)
∆pHRSG Pressure losses in HRSG 0.02 Capstone (2009)
∆pinlet Inlet pressure drop 0.5 kPa Capstone (2009)
∆prec Pressure losses in recuperator 0.03 Silveira et al. (2004)
ΔTpp Pinch point temp. difference 10°C Nadir et al. (2015)
ηcb Eff. of conv. boiler for st. gen. 0.85 Antunes (1999)
ηcc Energetic eff. of comb. chamber 0.99 Silveira et al. (2003)
ηger Energetic eff. of power generator 0.99 Silveira et al. (2003)
ηHRSG Energetic efficiency of HRSG 0.75 Balestieri (2002)
ηisoComp Isentropic eff. of compressor 0.82 Silveira et al. (2003)
ηisoGT Isentropic eff. of gas turbine 0.87 Silveira et al. (2003)
3.1 FIRST LAW OF THERMODYNAMICS ANALYSIS
This analysis is based on the First Law of Thermodynamics, the law of conservation of energy. This equation basically establishes an energetic balance for each process. Considering steady state and neglecting kinetic and potential energy variation, it is expressed as shown in equation (1.1):
in
in in out
out
out
h
m
h
m
W
Q
(1.1)with:
Q is the heat flow transferred through the analysed control volume, in kW.
Ẇ is the work per unit time transferred through the analysed control volume, in kW.
ṁ is the mass flow of energy steams (steam, gases, etc.), in kg/s. h is the enthalpy of the energy streams, in kJ/kg.
The First Law analysis is performed by applying equation (1.1) to control volumes for each component depicted in Figure 12. To conduct an energetic analysis, the standard ISO condition data (determined at sea level, 15°C, and 60% relative humidity) of the gas turbine C200 obtained from its manufacturer need to be adjusted to the local climatic conditions, in this case Guaratinguetá, Brazil. Thereafter, the important energetic data can be calculated for all the points of the system to obtain the energetic efficiencies of the single components as well as the system as a whole.
3.1.1 Adjustment of Capstone C200 data to local conditions
The performance data of the MGT are provided by the manufacturer for standard ISO conditions (sea level, 15°C and 60% relative humidity) and have to be adjusted to the local conditions. In case of this study, the conditions in Guaratinguetá are: ambient temperature T0 is 25°C, relative humidity Urel is 70% and altitude a is 620m.
Table 8 - Influence of ambient temperature on data of MGT C200 Ambient
Temperature (°C)
Net Power (kW)
Net Efficiency
(%)
Exhaust Temperature
(°C)
Exh. Mass Flow Rate
(kg/s)
Net Heat Rate (BTU/kWh)
-15 200.0 34.3 229.8 1.36 10,501
0 200.0 33.8 252.8 1.33 10,655
15 200.0 32.8 279.5 1.33 10,967
20 200.0 32.5 287.7 1.33 11,075
25 196.4 32.1 294.7 1.32 11,208
30 186.9 31.7 299.0 1.30 11,372
Source: (based on CAPSTONE TURBINE CORPORATION, 2009).
The data determined using Table 8 is:
Net Power E’el is 196.4 kW. Net Efficiency η’GT is 32.1 %. Exhaust Temperature T’6 is 294.7 °C. Exhaust Mass Flow Rate ṁ’cg is 1.32 kg/s.
Next, the net power output has to be adjusted to the ambient temperature as well as the local altitude. This is done using Figure 13:
Figure 13 - Influence of ambient temp. and pressure on power output of Capstone C200
The local altitude in Guaratinguetá is 2034 ft (620 m). From Figure 13: E’’el (T = 25°C; a = 1500 ft) ≈ 185 kW
E’’el (T = 25°C; a = 3000 ft) ≈ 174 kW Interpolation: E’’el (T = 25°C; a = 2034 ft) ≈ 181 kW
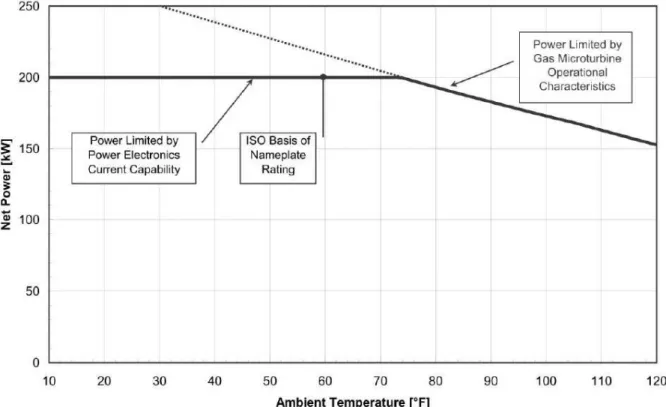
The reason why the net power output of the C200 MGT is constant at low temperatures and small altitudes is that, in these cases, power output is not limited by the ambient conditions, but regulated by power electronics. This is illustrated in Figure 14:
Figure 14 - Net power output of Capstone C200 limited by power electronics
Source: (CAPSTONE TURBINE CORPORATION, 2009).
Table 9 - Influence of inlet pressure drop on power output and efficiency of MGT C200 Inlet Pressure Drop
(Inches of Water)
Correction Factor for Power (CFinlet,P)
Correction Factor for Efficiency (CFinlet,Eff)
0.0 1.000 1.000
1.0 0.994 0.998
2.0 0.987 0.995
3.0 0.981 0.993
4.0 0.974 0.990
5.0 0.968 0.988
6.0 0.961 0.986
7.0 0.955 0.983
8.0 0.949 0.981
9.0 0.942 0.978
10.0 0.936 0.976
Source: (CAPSTONE TURBINE CORPORATION, 2009).
In accordance to Table 9 the correction factors for an inlet pressure drop of 0.5 kPa are determined as follows:
CFinlet,P is 0.987 and CFinlet,Eff is 0.995.
According to Capstone Turbine Corporation (2009), the maximum allowable exhaust back pressure for a Capstone C200 MGT is 8 inches of water (2 kPa). This limits the HRSG to pressure losses of no more than 2%. The influence of back pressure is shown in Table 10. In accordance to Table 10 the correction factors for a back pressure of 2 kPa (8 inches of water) are determined as follows:
Table 10 - Influence of back pressure on power output and efficiency of MGT C200 Back Pressure
(Inches of Water)
Correction Factor for Power (CFback,P)
Correction Factor for Efficiency (CFback,Eff)
0.0 1.000 1.000
1.0 0.996 0.998
2.0 0.992 0.995
3.0 0.988 0.993
4.0 0.985 0.990
5.0 0.981 0.988
6.0 0.977 0.985
7.0 0.973 0.983
8.0 0.969 0.981
Source: (CAPSTONE TURBINE CORPORATION, 2009).
The net power output and the net efficiency can now be adjusted to the inlet pressure drop and the back pressure:
inletP backPel NG
el E CF CF
E , T=25°C;a=2034ft , , (1.2)
inletEff backEffGT NG
GT,
T=25°C;a=2034ft CF , CF ,
(1.3)Eel,NG = 173.1 kW
ηGT,NG = 31,3 %
The adjusted heat rate is calculated using the adjusted net efficiency:
GT
HR
3600
(1.4)HRNG = 11501
1000 ] [ a 005 . 0 1 ] . [
] [
ft 0 = a 25°C; =
T ft
level sea E
elevation E
m m
el el cg
cg
(1.5)
ṁcg = 1.25 kg/s
In accordance to Capstone Turbine Corporation (2009), the impacts of specific humidity on heat rate and power output are not considered.
3.1.2 Adjustment of gas turbine performance for biogas and syngas operation
According to the South America sales manager of Capstone Turbine Corporation, Vescovo (2015), the adjusted values of exhaust temperature, exhaust mass flow rate and power output are not impacted by the fuel and are therefore adopted as valid for all three fuels and turbine versions. Furthermore, in accordance to Somehsaraei et al. (2014), while the power output is constant, electric efficiency of a 100 kW MGT declines with decreasing methane content in the biogas. In other words, the electric efficiency of MGTs declines with decreasing LHV of the fuel. This behaviour is shown in Figure 15:
Figure 15 - Influence of the LHV on electric efficiency of a 100 kW MGT
For the purpose of this study, it is adopted that the efficiency factors depending on the LHV shown in Figure 15 can be applied to the MGT Capstone C200 operating on biogas as well as syngas. The correction factors for the proposed biogas composition (CFBIO) and the proposed syngas composition (CFSYN) are determined to be 0.994 and 0.980, respectively.
Moreover, in case of low pressure fuels (biogas and syngas), a gas booster (compressor) is necessary to generate the pressure to inject the fuel into the combustion chamber. The gas booster recommended for the C200 MGT is the COMPEX MT11, with a maximum absorbed power of 11 kW (CAPSTONE TURBINE CORPORATION, 2009). The gas booster further
reduces the plant’s electric efficiency. Therefore, the electric efficiency and the power output for biogas and syngas operation can be expressed as follows:
GB NG
el BIO
el E W
E , , (1.6a)
GB NG
el SYN
el E W
E , , (1.6b)
NG el BIO el BIO NG GT BIO GT E E CF , , , ,
(1.7a) NG el SYN el SYN NG GT SYN GT E E CF , , , , (1.7b)3.1.3 Calculation of the percentage of excess air
The amount of excess air used in the combustion process is calculated as follows:
100
1
%
as am
m
EA
(1.8) with:%EA is the amount of excess air, in percent.
ma is the mass of the combustion air per mass of fuel, in kgAIR/kgFUEL.
mas is the mass of the stoichiometric combustion air per mass of fuel, in kgAIR/kgFUEL. The air and fuel flows in the MGT are determined by the efficiency of the turbine:
fuel cg
air
m
m
m
(1.10)LHV
E
m
fuel
fuel (1.11)GT el fuel
E
E
(1.12)The LHVs of NG, biogas and syngas can be taken from Tables 1, 3 and 5, respectively. The stoichiometric combustion air, also known as theoretical air, is determined using stoichiometric combustion equations for each fuel considering zero excess of air (complete combustion). As all fuels are mixtures of different gases, the stoichiometric relations are developed for each gas component (e.g. methane) and then weighted by their mole fractions to obtain the multi-component equation. Air is assumed to consist of 21% oxygen and 79% nitrogen and dissociation in the combustion process is not considered. Therefore, a general stoichiometric combustion equation for a hydrocarbon fuel (CαH O ) with air is:
2 2 2 2 2