www.atmos-chem-phys.net/6/4687/2006/ © Author(s) 2006. This work is licensed under a Creative Commons License.
Chemistry
and Physics
Implementation and testing of a desert dust module in a regional
climate model
A. S. Zakey1, F. Solmon2, and F. Giorgi2
1Department of Chemistry Atmospheric Science Goteborg University SE- 412, 96 Goteborg, Sweden
2The Abdus Salam International center for Theoretical Physics, Physics of Weather and climate section, Strada Costiera 11, 34100 Trieste, Italy
Received: 15 November 2005 – Published in Atmos. Chem. Phys. Discuss.: 10 March 2006 Revised: 17 July 2006 – Accepted: 12 September 2006 – Published: 19 October 2006
Abstract. In an effort to improve our understanding of aerosol impacts on climate, we implement a desert dust ule within a regional climate model (RegCM). The dust mod-ule includes emission, transport, gravitational settling, wet and dry removal and calculations of dust optical properties. The coupled RegCM-dust model is used to simulate two dust episodes observed over the Sahara region (a northeastern Africa dust outbreak, and a west Africa-Atlantic dust out-break observed during the SHADE “Saharan Dust Exper-iment”), as well as a three month simulation over an ex-tended domain covering the Africa-Europe sector. Com-parisons with satellite and local aerosol optical depth mea-surements shows that the model captures the main spatial (both horizontal and vertical) and temporal features of the dust distribution. The main model deficiency occurs in the representation of certain dynamical patterns observed during the SHADE case which is associated with an active easterly wave that contributed to the generation of the dust outbreak. The model appears suitable to conduct long term simulations of the effects of Saharan dust on African and European cli-mate.
1 Introduction
Atmospheric aerosol direct and indirect radiative effects play an important role for climate and the environment, therefore it is important to include the description of aerosol processes in climate models (Penner et al., 2001). In particular, desert dust is the main aerosol component in many arid and semi-arid regions of the world, such as the Sahara and Sahel in Africa or the desert regions of central Asia. Desert dust is emitted through suspension, saltation and creeping pro-cesses associated with wind erosion (Bagnold, 1941). Dust
Correspondence to:F. Solmon ([email protected])
emission mostly occurs in episodic events determined by threshold near-surface wind conditions (Gillette and Hanson, 1989). The finer dust particles can be lifted up to high al-titudes, where they are transported long distances from the source regions, often thousands of kilometers (Mahowald et al., 2002). As a result, the effects of desert dust can be felt not only locally but also in regions far from the sources.
A number of efforts have been made to simulate the desert dust cycle in climate models, particularly at the global scale (Joussaume, 1990; Cakmur et al., 2004, 2005; Miller et al., 2004, 2006; Zender et al., 2004; Luo et al., 2003). Fewer studies are available on the inclusion of dust processes in re-gional climate models (RCMs) (Gong et al., 2003; Song and Carmichael, 2001; Nickovic et al., 2001). Dust radiative ef-fects on climate are likely to be especially important at the regional scale. Thus RCMs can be particularly useful tools to investigate the regional climatic effects of dust.
Based on these premises, we describe here the implemen-tation and testing of a dust module within the regional cli-mate modeling framework RegCM (Giorgi et al., 1993a, b; Giorgi and Mearns, 1999; and Pal et al., 2005). The model includes processes of dust emission by wind erosion, trans-port by resolvable scale winds, turbulent diffusion and deep convection, removal by wet and dry processes and gravita-tional settling. The dust particle size distribution is repre-sented by size bins and the dust emission term includes the effects of both wind intensity and surface characteristics.
The first test simulation we consider is a dust episode which occurred on 13–16 March 1998, when a dust storm swept across northeastern Africa (through Algeria, Lybia, Sudan and Egypt) and reached the eastern Mediterranean and Middle East countries. For this case, the model sim-ulation is validated with aerosol indices obtained from To-tal Ozone Mapping Spectrometer (TOMS) satellite maps. The second test case is a Western Sahara – Atlantic out-break that occurred during 20–29 September 2000 between the coasts of West Africa and the Cabo Verde Islands. Dur-ing this period the Saharan Dust Experiment (SHADE) was conducted using a combination of in-situ, photometer, li-dar and satellite measurements (Tanr´e et al., 2003). The SHADE dataset offers a unique opportunity to validate dif-ferent aspects of our aerosol model. The third simulation is for the period June–July–August (or JJA), 2000, and is validated against Multi-angle Imaging Spectro-radiometer (MISR) satellite data. This third test case provides a val-idation of the model for “climate mode” type experiments (i.e. experiments longer than the several day time scale char-acteristic of individual synoptic events), and is particularly relevant in view of our objective to use the coupled model for climate applications. This set of test experiments thus al-lows us to evaluate the model performance from the scale of individual episodic events to the long temporal scale.
Although the final goal of our model development effort is to simulate the climatic effects of aerosols, the dust cal-culated in the present simulations does not radiatively inter-act with the RegCM. To fully assess the climatic effects of aerosols requires long term multi-year simulations which are beyond the purpose of this paper. We also emphasize that the present modeling effort is placed within the broader effort of modeling natural and anthropogenic aerosols for regional cli-mate applications initiated by Qian et al. (2001) and Solmon et al. (2006).
In Sect. 2 we first present a description of the dust module along with a brief description of RegCM and the three test cases. Results from the simulations are then validated using observations in Sect. 3, while Sect. 4 presents our summary and concluding remarks.
2 Dust parameterization in the RegCM
2.1 The RegCM model
The RegCM has been developed for the last decade or so at the National Center for Atmospheric Research (NCAR) and later at the Abdus Salam International Centre for The-oretical Physics (ICTP) (Giorgi et al., 1993a, b; Giorgi and Mearns, 1999; Pal et al., 2005). It is a hydrostatic, sigma vertical coordinate model whose dynamics is essentially the same as the hydrostatic version of the mesoscale model MM5 (Grell et al., 1994). Typical horizontal resolutions for cli-mate application range from 20 to 80 km. Radiative transfer
processes are from the NCAR global model CCM3 and are described by Kiehl et al. (1996). The boundary layer pro-cesses follow the non-local parameterization of Holtslag et al. (1990), while the scheme of Grell (1993) is used to de-scribe moist convection and the parameterization of Pal et al. (2000) represents non-convective precipitation. Land sur-face processes are described via the Biosphere-Atmosphere Transfer Scheme (BATS, Dickinson et al., 1993). As de-scribed below, the BATS interface provides most of the vari-ables used to couple the dust emission scheme. Over the years, the RegCM has been used for a wide range of applica-tions (e.g. Giorgi and Mearns, 1999).
2.2 Dust emission parameterization
The representation of dust emission processes is a key ele-ment in a dust model and depends on the wind conditions, soil characteristics and particle size. Following Marticorena and Bergametti (1995) and Alfaro and Gomes (2001), here the dust emission calculation is based on parameterizations of soil aggregate saltation and sandblasting processes. The main steps in this calculation are: The specification of soil aggregate size distribution for each model grid cell, the cal-culation of a threshold friction velocity leading to erosion and saltation processes, the calculation of the horizontal saltating soil aggregate mass flux, and finally the calculation of the vertical transportable dust particle mass flux generated by the saltating aggregates. In relation to the BATS inter-face, these parameterizations become effective in the model for cells dominated by desert and semi desert land cover. At present, we do not account for sub-grid fractional desert cover, that is a grid point is considered to be either totally covered by desert or with no desert cover.
2.2.1 Soil aggregate distribution
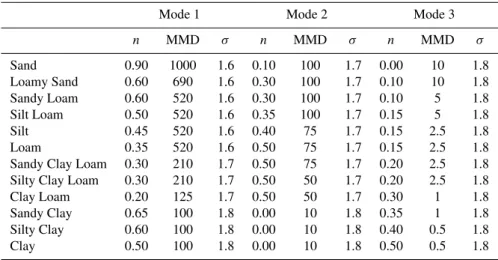
Table 1. The 12 basic USDA soil texture indices and corresponding soil aggregate size distribution parameters. Soil aggregate sizes are distributed according to a 3 mode lognormal distribution (i referring to the mode):
dn(Dp)
d logDp = 3
X
i=1
ni
logσi√2π
exp
"
− log(Dp/MMDi)2
2(logσi)2
#
wheren(Dp)is the cumulative aggregate number distribution in cm−3, MMD is the geometric mean diameter andσ the standard deviation
inµm,ni is the relative weight of each mode, and logσiis a measure of aggregate polydispersity.
Mode 1 Mode 2 Mode 3
n MMD σ n MMD σ n MMD σ
Sand 0.90 1000 1.6 0.10 100 1.7 0.00 10 1.8
Loamy Sand 0.60 690 1.6 0.30 100 1.7 0.10 10 1.8
Sandy Loam 0.60 520 1.6 0.30 100 1.7 0.10 5 1.8
Silt Loam 0.50 520 1.6 0.35 100 1.7 0.15 5 1.8
Silt 0.45 520 1.6 0.40 75 1.7 0.15 2.5 1.8
Loam 0.35 520 1.6 0.50 75 1.7 0.15 2.5 1.8
Sandy Clay Loam 0.30 210 1.7 0.50 75 1.7 0.20 2.5 1.8
Silty Clay Loam 0.30 210 1.7 0.50 50 1.7 0.20 2.5 1.8
Clay Loam 0.20 125 1.7 0.50 50 1.7 0.30 1 1.8
Sandy Clay 0.65 100 1.8 0.00 10 1.8 0.35 1 1.8
Silty Clay 0.60 100 1.8 0.00 10 1.8 0.40 0.5 1.8
Clay 0.50 100 1.8 0.00 10 1.8 0.50 0.5 1.8
2.2.2 Minimum threshold friction velocity and horizontal saltating mass flux
Soil aggregates can be mobilized if the wind shear at the surface, represented by the wind friction velocity, is suffi-ciently strong. Marticorena and Bergametti (1995, 1997a, b) showed that the mobilization of a given aggregate size Dpbecomes effective above the minimum threshold friction velocityu∗
t(Dp). Assuming that the aeolian shear stress is almost completely transferred to the erodible soil fraction, u∗t(Dp)is calculated from the equation:
u∗t(Dp)=u∗t s(Dp)·feff·fw (1) whereu∗ts(Dp)represents an ideal minimum threshold fric-tion velocity and is determined according to the empirical parameterization of Marticorena and Bergametti (1995): u∗t s(Dp)=
(
0.129·K·1−0.0858·exp{−0.0617·(Re−10)}Re>10
0.129·K
(1.928·Re0.092−1)0.50.03< Re≤10 (2) whereRe=aDpx+bandK=
r
2·g·ρp·Dp ρa ·
h
1+ρp·g0.006·(2·Dp)2.5 i
. In whichDp is the soil radius particle,ρp is the aggre-gate density taken to 2.65 g/cm3,ρais the surface air density calculated by the model,gis the gravitational acceleration. The Reynolds numberReis parameterized according to Mar-ticorena et al. (1997a, b), and b and x are dimensionless pa-rameters.
The term feff in Eq. (1) is a correction factor account-ing for the effect of surface roughness. Accordaccount-ing to Mar-ticorena and Bergametti (1995),feffis determined from the partition of wind energy between the erodible surface and the non erodible elements, and is expressed as:
feff=1−
lnzm z0s
ln
0.35z10 0s
0.8
(3)
whereZ0s is a roughness length characteristic of a smooth surface (assumed to be 10−3cm) and Zm is the grid cell effective roughness length, determined from the land cover specification and the BATS surface scheme.
Finally,fwin Eq. (1) is a factor that accounts for the effect of soil moisture content on the threshold friction velocity. It is parameterized according to F´ecan et al. (1999) as:
fw = ( h
1+A· w−w′Bi0.5
f orw > w′ 1f orw < w′
(4)
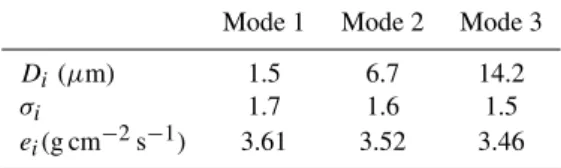
Table 2. Dust emission lognormal size distribution parameters and binding energy (ei)attached to each mode (After Alfaro et al.
1998).
Mode 1 Mode 2 Mode 3
Di(µm) 1.5 6.7 14.2
σi 1.7 1.6 1.5
ei(g cm−2s−1) 3.61 3.52 3.46
2.2.3 The horizontal saltating aggregate flux
The size-dependent expression of the threshold friction ve-locity is used to calculate the vertically integrated horizontal flux of saltating aggregates. This parameterization accounts for the selective mobilization of the soil aggregates accord-ing to their size. The horizontal flux associated to a given saltating aggregate of sizeDpis given by:
dHF(Dp)=E· ρa
g ·u
∗3
· 1+R(Dp)
·1−R2(Dp)
·dSrel Dp
(5) whereEis the ratio of erodible to total surface,dSrel(Dp)is the relative surface of soil aggregate of diameterDp to the total aggregate surface, determined from the above defined soil aggregate distribution. FinallyR(Dp)is the ratio of the threshold friction velocity defined in Eq. (1) to the friction velocityu∗, calculated within each grid cell from the model prognostic surface wind and the surface roughness height. The total horizontal particle flux is then obtained by the inte-gration of Eq. (5) overDp.
2.2.4 The vertical mass flux of dust transportable particles In the sandblasting process, the fine dust transportable par-ticles are released either from saltating soil aggregate disin-tegration or from surface bombardment by aggregates. Size distributions of such emitted transportable dust particles have been studied by Alfaro et al. (1998). In the model, the emit-ted dust distribution is fixed according to a three mode log-normal “emission distribution”. The corresponding parame-ters (Table 2) have been taken from Alfaro and Gomes (2001) and are based on specific studies of Saharan aerosols. The dust emission flux corresponding to each emission mode is then calculated as follows.
For a given saltating soil aggregate of diameterDp, the dust production depends on the individual kinetic energy of this aggregate. The corresponding kinetic energy flux dFkin(Dp) is proportional to the horizontal saltation flux (Gillette and Stockton, 1986, 1989; Alfaro et al., 1997; Al-faro and Gomes, 2001) as follows:
dFkin(Dp)=β·dHF(Dp) (6)
withβ=16 300 cm s−2anddHF t(Dp)is given in Eq. (5).
Table 3. Transport bin sizes considered in the model standard ver-sion. fcis the fraction of aerosol assumed to be incorporated in
cloud droplets,αextare the bin specific extinction coefficients
ob-tained from Mie calculations and characteristic of the 350–640 nm model spectral band. For this band, a refractive index of 1.55– 0.0055ias well as a representative size distribution are considered (see text).
Transport bin sizes (µm) 0.01–1 1–2.5 2.5–5 5–20
fc 0.3 0.15 0.05 0.05
αext(m2g−1) 2.85 0.86 0.37 0.13
According to Alfaro and Gomes (2001) the elementary vertical dust particle number flux produced by the aggregate of size Dp within the emission modeiis given by:
dNi Dp=dFkin Dp·pi(Dp)/ei (7) Whereei is a binding energy attached to the emission mode i(cf. Table 2), andpi(Dp)is a fraction of the kinetic energy of the saltating aggregate used to release dust particle in the ith emission mode. Pi(Dp)is calculated by comparing the individual aggregate kinetic energyec(Dp)calculated from Eq. (8) to theith mode binding energyeiaccording to Alfaro and Gomes (2001).
ec(Dp)=ρp·(π/12)· Dp 3
· 20·u∗2
(8) Finally the mass emission flux corresponding to each emis-sion mode is obtained by :
Fdust,i(Dp)= π
6
·ρp·Di3·Ni (9) WhereNi is obtained by the integration of Eq. (7) over the soil aggregate size range, andDi is the median diameter as-sociated to theith mode (cf. Table 2).
2.3 Transport, gravitational settling and wet removal of dust particles
The above defined dust emission flux is partitioned in a num-ber of size bins that are effectively transported by the model. In the basic configuration adopted in this work this number has been set to 4 (Table 3) to reduce computational costs in view of the model application to climate experiments. Each transport-bin is considered as a distinct tracer and is trans-ported according to the tracer transport equation defined in Solmon et al. (2006). This includes transport by resolvable scale winds, sub-grid scale turbulence and deep convection, along with wet and dry removal processes.
contained in cloud water, which can eventually be precip-itated, has been fixed as specified in Table 3. These val-ues represent an intermediate hypothesis between purely hy-drophobic or purely hydrophilic assumptions found in the lit-erature (e.g. Zender et al., 2003). The values offc, decrease with the bin size as the small particles are more likely to form cloud condensation nuclei.
A new feature of the model in comparison to that de-cribed by to Solmon et al. (2006) is the addition of a size-dependant particle gravitational settling term and a dry depo-sition scheme including turbulent transfer in the surface layer and surface interception as a function of land cover character-istic. The dry deposition velocities are calculated as a func-tion of particle size and density and include the contribufunc-tions of turbulent transfer, Brownian diffusion, impaction, inter-ception, gravitational settling and particle rebound (Giorgi, 1986; Zhang et al., 2001). At the present stage, there is no large scale forcing for dust aerosol and boundary conditions are defined as open.
2.4 Dust specific extinction coefficient
Although the dust is not radiatively active in the experiments described here, the dust optical properties need to be calcu-lated for model validation in terms of Aerosol Optical Depth (AOD). These optical properties are computed for each size bin and each spectral band of the RegCM radiation scheme (18 wavelength bands, Kiehl et al., 2001) using Mie the-ory. Refractive indices which vary for the different bands have been taken from the OPAC database (Hess et al., 1998). For the band 350–640 nm, centered around 500 nm and used hereafter in model/satellite comparisons, the refractive in-dex is equal to 1.55–0.0055i. The above defined three mode emission distribution has been considered as the sub-bin par-ticle size distribution for Mie calculation: Median diameter and standard deviation are listed in Table 2. However, the rel-ative amplitude of each emission mode depends on local and instantaneous wind conditions, soil type and humidity and as do the optical parameters. To estimate representative optical properties, a Mie scattering code has been used considering a set of 16 typical emission particle distribution represent-ing different arid soil component/wind speed combinations. These combinations, and the log-normal parameters are de-tailed in Alfaro and Gomes (2001). The different extinc-tion coefficients obtained from each of these combinaextinc-tions range, for example, from 1.87 m2g−1for a friction velocity of 35 cm s−1over alumino-silicated silts to 2.99 m2g−1for a friction velocity of 80 cm s−1over coarse sand. “Climatic” extinction coefficients have been obtained by averaging the results of the 16 different combinations for each of the trans-port bins and retrans-ported in Table 3.
Specific extinction coefficient are combined with bin con-centrations fields to determine the AOD. In reality, dust op-tical parameters may vary depending on source region (min-eral composition), particle coating and possibly other
param-eters (Formenti et al., 2003; Haywood et al., 2003). In the present standard configuration of the dust scheme, this com-plexity is not accounted for.
3 Results
As mentioned, our validation strategy aims at evaluating the model from the episodic to the long temporal scale. The lat-ter is the most critical from the point of view of climate appli-cation, but evaluation of individual dust events is a necessary step in order to assess the realism of emission and transport processes. In this section, we validate the three test cases mentioned in Sect. 2 against available observations, using typical grid horizontal resolution for regional climate appli-cations (40 and 60 km).
3.1 The Northeast Africa case
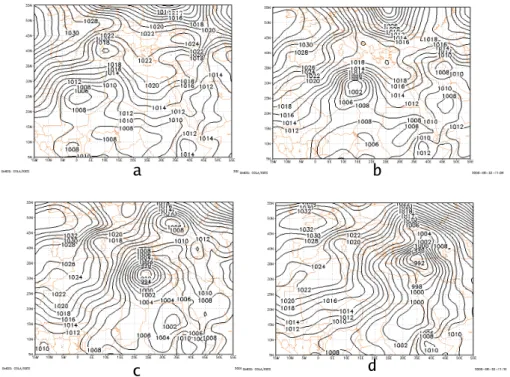
During 13 to 16 March 1998, a particularly intense sand storm (Khamasin storm) occurred over northeastern Africa. The main synoptic features of this event are shown in Fig. 1a–d. On 13 March 1998, an anticyclone was cen-tered over the Atlantic Ocean and extended to western Eu-rope, while a cold front associated with a deep depression was located over Algeria. This synoptic low pressure system deepened and moved rapidly along a northeastward trajec-tory towards the southern Mediterranean coasts, generating strong pressure gradients and surface winds. On 15 March the depression deepened further and swept over northwest-ern Egypt to eventually cross the eastnorthwest-ern Mediterranean and reach the Middle East coasts and Syria on 16 March.
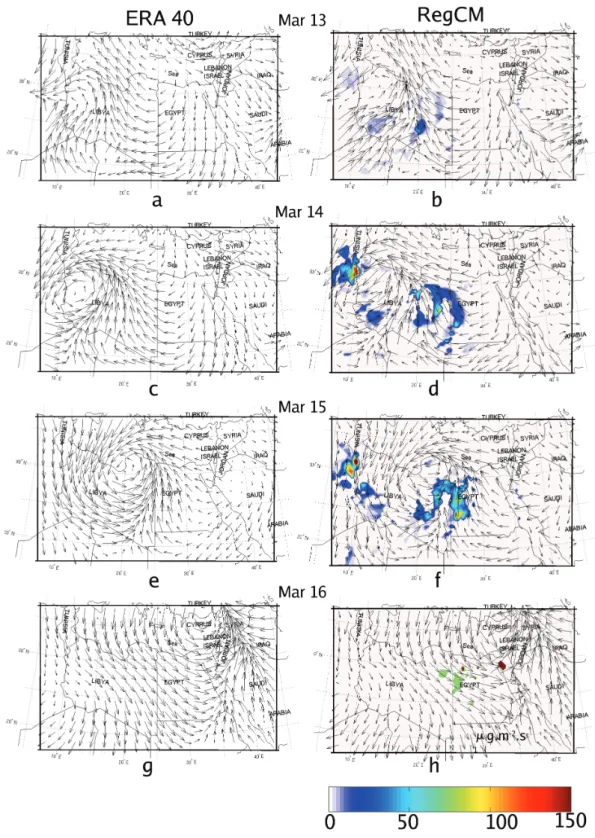
This dust event was simulated with the coupled RegCM-dust module using the North African domain shown in Fig. 2 with a horizontal grid spacing of 40 km, which is typical for RegCM. The simulation started on 11 March, 00:00 UTC and ended on 17 March, 00:00 UTC and the results are presented from 13 March to 17 March during the storm event. There were no significant dust emission during the spin-up period from 11 to 13 March. The initial and lat-eral meteorological boundary conditions necessary to run the RegCM were obtained from ERA40 re-analyses of observa-tions (http://www.ecmwf.int/research/era/).
a
c
b
d
Fig. 1.Synoptic situation during the North African test case. Surface sea-level-pressure charts (mb) from NCEP reanalysis for 12:00 UTC, 13–16 March 1998.
intense dust source is located over the western Lybia/Tunisia border and is activated by a strong northeasterly current on 13 and 14 March.
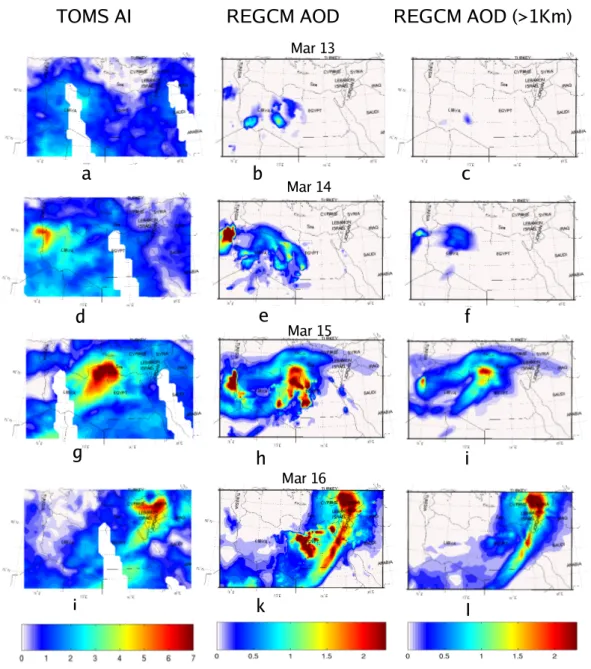
Dust detection in the near UV is possible using the TOMS aerosol index (AI) (Herman et al., 1997; Torres et al., 1998), which is a measure of the change of spectral contrast in the near UV due to radiative transfer effects of aerosols in a Rayleigh scattering atmosphere. At a first approximation, the TOMS AI can be considered to be proportional to the dust burden and optical depth, so it is a good indication of the dust spatial pattern, and as such it can be used for model validation by comparison with the simulated AOD. This ap-proximation tends to be more valid for aerosols located above 1000 m altitude (Torres et al., 1998). Therefore we compare to the TOMS AI both the total simulated AOD and the con-tribution to the AOD deriving from dust above 1000 m.
Figure 3 shows the TOMS AI, the full model AOD and the AOD from dust above 1000 m for 13–16 March over the model domain. The TOMS AI shows the development of a dust plume over Lybia which essentially follows the trajectory of the low pressure system (Fig. 3). The simu-lated dust plume moves from west to east across northeastern Africa during 13–15 March. On 16 March the plume starts to move northeastward following the movement of the depres-sion cell. On 15 March, dust-laden air in the Egypt/Libya border moves counter-clockwise following the low-pressure vortex and reaches the northeastern Mediterranean and Syria on 16 March. On 15 March, the observed dust plume shows its maximum intensity over Egypt.
Comparing observed AI and simulated AOD, we notice that 13 March is characterized by relatively low TOMS AI over the analysis area, but moderate plumes over central Ly-bia can nevertheless be observed in both the simulation and the TOMS observations. On 14 March the TOMS AI shows the development of a plume over the Algeria/Lybia border. Consistent with this pattern, the maximum simulated AOD is obtained close the northern Algeria/Lybia border, imme-diately south of Tunisia and is linked to local sources in the area (Fig. 3d). The simulated dust source is very efficient there, as shown by the large instantaneous optical depths. Most of the simulated particles are however located in the 0–1000 m near-surface layer as shown by the comparison of Figs. 3e and f. Compared to the AI, we note that this sim-ulated plume is slightly shifted to the west, which may be the result of a misplacement of the source area or differences between simulated and observed local surface winds in the vortex. Also note that part of this local simulated plume gen-erated by northeasterly flow is advected out of the domain and will not be recycled into the domain during the follow-ing days.
Fig. 2.Comparisons between the RegCM simulated winds at the bottom model level (∼25 m) and 40 km resolution and the ERA40 reanalysis. Instantaneous source magnitude for the first dust bin (inµg m−2s−1)are also displayed for the period 13–16 March 1998.
detected by TOMS. In terms of spatial patterns and loca-tion of the maximum dust front, the simulated AOD above 1000 m appears more consistent with the TOMS AI than the total AOD (Figs. 3h, i). A strong local source and AOD close
TOMS AI
REGCM AOD
REGCM AOD (>1Km)
a
b
c
d
e
f
g
h
i
j
k
l
Mar 13
Mar 14
Mar 15
Mar 16
Fig. 3.Comparisons between the simulated total AOD (model band 350–640 nm), simulated AOD at height greater than 1000 m and TOMS aerosol index during the period 13–16 March 1998.
On 16 March both the TOMS AI and the simulated AOD show a comma-shaped plume extending from Syria to north-eastern Egypt. This is produced by the intense cyclonic vor-tex shown in Figs. 2g, h, and is thus the result of both source and transport processes, thereby showing good model perfor-mance in both these features. On 16 March the model also shows large total AOD over central-western Egypt (Fig. 3k). This maximum is not found in both the TOMS AI and the simulated AOD for dust above 1000 m (Figs. 3j, l), and there-fore it is most likely related to local sources of large parti-cles that are not transported above the near-surface layer and away from the source region.
A further measure of dust dispersion is the so called “ven-tilation index” (Eagleman, 1996; Hsu, 2003; Rao, 2003), which is defined as the product of the boundary-layer height and a representative boundary-layer horizontal wind speed. The higher these two factors, and thus the ventilation in-dex, the more pronounced the vertical and horizontal dust dispersion. In RegCM the boundary layer height is diagnos-tically calculated through an iterative technique (Holtslag et al., 1990). As a measure of boundary layer wind we take the wind at the lowest model level, since we are mostly in-terested in near-surface dust dispersal. Instantaneous values of the ventilation index at 12:00 UTC for 13–16 March 1998, are shown in Fig. 5. This time of day corresponds to the max-imum of combined boundary layer height, wind speed and dust burden. Dispersion forecast categories related to atmo-spheric ventilation (Eagleman, 1996) are reported in Table 4. Not surprisingly, Fig. 5 shows that the overall spatial and temporal variations in the ventilation index are similar to those found for the dust burden and AOD (see Fig. 3). The maximum ventilation index at 12-h GMT increases from roughly 4000 m2s−1 to 9000 m2s−1 which corresponds to “good” and “excellent” dispersion categories in Table 4. The corresponding values of boundary layer height vary from about 3.4 km on 13 March to 3.7 km on 15 March and 2.5 km on 16 March (not shown). Therefore, the proportionally larger variations in the ventilation index are attributed to changes in average surface wind speed.
Summarizing the results of this northeast Africa dust out-break simulation, the model was quite successful in repro-ducing both the synoptic conditions that lead to the event and the temporal and spatial evolution of the dust plume. Disper-sion due to strong surface winds and vertical transport lead to significant dust amounts reaching the upper troposphere and being carried out long distances from the main source regions into the eastern Mediterranean and Middle East areas.
3.2 The SHADE case
The second test case we present in this paper is the SHADE experiment which occurred during 20 to 29 September 2000 between the coast of west Africa and the Cabo Verde Islands. During this experiment a detailed study of a dust outbreak, occurring on 25 and 26 September was performed using a combination of in-situ measurements, photometer, lidar and satellite measurements (Tanre et al., 2003; Haywood et al., 2003; Myrhe et al., 2003; Leon et al., 2003; Formenti et al., 2003). For the SHADE period, we performed two 10 day simulations, at 60 km and 40 km horizontal grid resolu-tion, starting from 20 September 00:00 UTC and ending on 30 September 00:00 UTC over the domain depicted in Fig. 6. The model was forced by 6 hourly ECMWF ERA40 reanaly-sis. Here we focus on the special observing period including the 25 and 26 September dust outbreak.
Sep 16 1998, 12:00 UTC
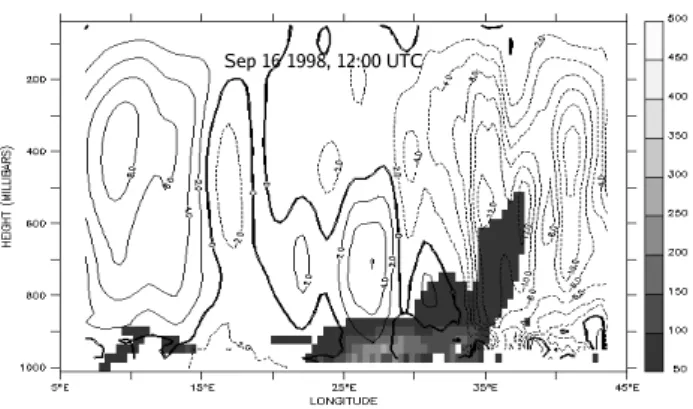
Fig. 4. The longitude-height cross section of dust mixing ra-tio (µg kg−1) and the vertical velocity on 16 March 1998 at 12:00 UTC. Ascending velocities are materialized by dot lines and descending by plain lines.
Table 4. Pollution dispersion forecast categories related to atmo-spheric ventilation (after Hsu, 2003, and Eagleman, 1996, based on the air pollution dispersal index used by the State of Colorado Dep. of Health, Denver, CO).
Pollution dispersion Ventilation (m2s−1)
Bad Fair Good Excellent
0–2000 2001–4000 4001–6000 6001 or more
3.2.1 Simulated horizontal AOD distribution
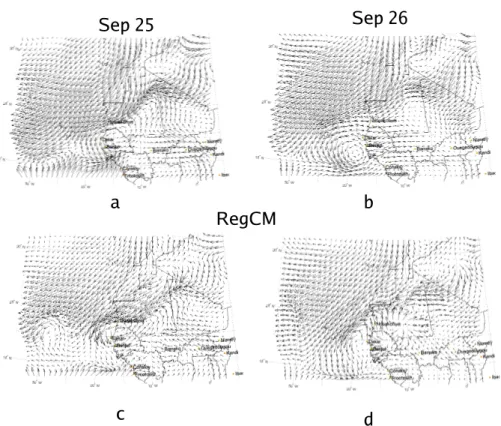
Figure 6 shows the TOMS AI, the total AOD estimated from the Moderate Resolution Imaging Spectroradiometer (MODIS, Tanr´e et al., 1999) satellite at 550 nm and the to-tal simulated AOD at 60 and 40 km over the domain. The satellite acquisition is around 13:00 UTC for MODIS and the model data are shown for 15:00 UTC. To aid the discus-sion, simulated winds at 40 km and winds from the ECMWF ERA40 reanalysis at 12:00 UT and 850 hp are also presented in Fig. 7. Figure 8 displays the evolution of daily averaged Aerosol Robotic Network (AERONET, Holben et al., 1998) AOD measurements and simulated AOD at M’Bour (Dakar) and Sal Island for the period of 23–27 September.
a
c
d
b
Fig. 5.Ventilation index (m2s−1)during the dust storm event 13–16 March 1998.
The simulated AOD (Figs. 6e, g) at both 40 km and 60 km resolution is maximum over west Mauritania and is generally consistent with the TOMS AI. We note that remote sources over south Algeria and Mali are also well captured. However, the southwest Saharan maximum visible in the TOMS data (Nouadhibou inland region) is not accurately reproduced, be-ing less intense and more localized in the model than in the TOMS data. This underestimation could be due to a less intense simulated north-eastern circulation over the Western Sahara region as illustrated in Figs. 7a and c. Another pos-sible reason for this underestimation is the soil texture rep-resentation over this region, which determines the threshold friction velocity. This point will be further discussed below.
The comparison with the MODIS AOD shows that the simulated AOD magnitudes are relatively well represented over the west Mauritania/Nouakchott coastal area. The com-parison of observed and analyzed wind patterns upwind of Nouakchott shows that the model reproduces quite well the intensity and direction of the winds there. The simulated AODs over the sea in the Nouakchott outflow region reach a magnitude of 1.5 and are comparable to the MODIS AOD. This indicates that the model is able to realistically represent the Mauritanian dust sources activated by the flow both at 60 and 40 km resolution.
However, the southward extension of the plume over the northwestern Senegal coast is not accurately reproduced by the model at 40 km resolution. A comparison between anal-ysed and simulated wind fields shows that the simulated wind field below 15 N (Figs. 7b, d) differs from the analy-sis. More specifically, the cyclonic vortex adjacent to the Senegal coasts on 25 September and visible in the ERA40 reanalysis is slightly shifted to the north in the simulation. Consequently, the dust burden resulting from the Maurita-nian plume advection and the local dust production in north-ern Senegal is underestimated on 25 September. This result is particularly visible when comparing the simulated AOD with the local M’Bour AERONET measurements evolution (Fig. 8b).
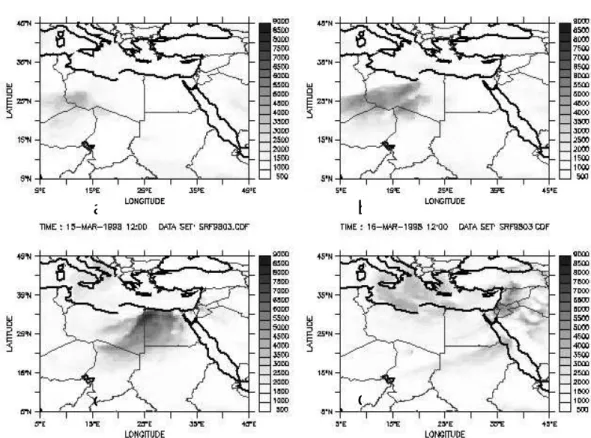
Fig. 6. TOMS aerosol index, MODIS Aerosol optical depth at 550 nm and RegCM simulated Aerosol optical depth (model band 350– 640 nm) on 25 and 26 September 2000 successively at 60 km resolution (e, f) and 40 km resolution (g, h). Model vertical cross sections presented in Fig. 9 and corresponding to flight track during the SHADE experiment are materialized on picture (e) and (f).
westward extension of the plume up to 30 W is more pro-nounced in the 40 km simulation, reflecting a dust production and transport more intense than in the 60 km resolution, and agreeing reasonably well with the MODIS observation. To the contrary, the 60 km shows a more consistent structure in the region between the Mauritania coast and 20 W.
(i) For both resolutions, significant differences compared to observations are found: The Mauritanian outflow im-mediately north of Nouakchott is quite well captured, but the western Sahara southern sources are still
ERA40
c
d
a
b
RegCM
Sep 25
Sep 26
Fig. 7.ERA 40 vs. RegCM wind fields for the 40 km resolution simulation (12:00 UTC) at 850 hpa for 25 and 26 September 2000.
Daily AOD ( 500 nm)
AERONET (light gray) /REGCM 23-27 sept 2000
Sal, Cabo Verde
16 43' 58'' N, 22 56' 06'' W
M’Bour / Dakar, Senegal
14 23' 38'' N, 16 57' 32'' W
a b
Fig. 8. AERONET vs. RegCM daily AOD (model band 350– 640 nm) at Sal and M’Bour location for the period 23 to 27 Septem-ber. For Sal AERONET values are missing on 24 SeptemSeptem-ber. For M’Bour, AERONET value are missing on 23, 26 and 27 September.
dependant as illustrated by the difference of simulated AOD over the Nouadibou spot (Figs. 6f, g). Uncertain-ties in the BATS specification of roughness length over desert regions might also play a role in this regard. The underestimation of the western Sahara sources affects directly the magnitude of the simulated AOD over the sea when compared to the MODIS AOD.
a
b
c
d
Sep 25
Sep 26
Lidar
Attenuated backscattering coefficient
RegCM
Extinction profilesFig. 9.Lidar attenuated backscattering coefficients measured during SHADE experiment on(a)25 September and(b)26 September (taken from L´eon et al., 2003). Simulated RegCM dust extinction profiles on(c)25 September and(d)26 September. The vertical cross sections were performed along the tracks materialized on Fig. 6.
3.2.2 Vertical structure of the dust plume in the outflow re-gion
The SHADE experiment provided data for the characteriza-tion of the vertical structure of the dust outbreak by use of lidar measurements along plane trajectories as well as lo-cal drop sound measurements (L´eon et al., 2003; Tanr´e et al., 2003). Here, we compare simulated vertical cross sec-tions of extinction to lidar back scattering coefficients taken from L´eon et al. (2003). The lidar measurement is linked to the aerosol extinction as described by L´eon et al. (2003). As a first order approximation, we assume that both the li-dar and modeled extinction profiles are proportional to the actual amount of dust in a given atmospheric layer. Rather than assessing the absolute magnitude, we instead focus on the relative magnitude and position of the simulated vs. ob-served dust layers. The simulated values at 40 km resolution have been interpolated from the original sigma level grid to a regular height grid for comparison. Note that the model was run at its standard configuration (targeted for climate appli-cations) which includes 18 vertical sigma levels with a mid-tropospheric resolution of about 90 hPa. This is admittedly a relatively coarse vertical resolution.
Figures 9a, b and 9c, d compare the simulated and lidar cross sections along the track of the M20 airplane between Dakar and the Cabo Verde islands (the cross section traces are shown in Figs. 6g and h). Both the model and the obser-vations reproduce the presence of a dust layer over the marine boundary layer. L´eon et al. (2003) and Tanr´e et al. (2003) point out the existence of a first dust layer located at around 1000–1500 m (visible in Fig. 9a, b) originating from western Mauritania and northern Senegal. Between 17.5 and 20 W, the model does produce a first continuous layer of dust start-ing from about 1000 m around 18 W, then thickenstart-ing slowly in the westward direction. This simulated layer corresponds well with the observed Mauritanian layer. The very thick dust layer observed at low levels at 17.5 W (i.e. close to the coast) in Fig. 9a is not reproduced by the model. The reason for this lies in the above discussed dust burden underesti-mation and misrepresentation of sources in the west Senegal region on 25 September.
Fig. 10.RegCM (model band 350–640 nm) vs. MISR seasonal average of aerosol optical depth for JJA 2000. Vertical cross section presented in Fig. 12 are materialized on picture (a).
Fig. 11. Seasonal comparison of daily model AOD (model band 350–640 nm, bar) and AERONET AOD (averaged of the 440 nm and 670 nm photometer band, line) at Cabo Verde for JJA 2000.
merge progressively, a feature not found in the lidar cross section and likely due to the relatively coarse model verti-cal resolution. Also on 25 September the lidar cross sec-tion shows a dust layer above 3000 m between 17 and 20 W. The model reproduces the presence of this layer, although its magnitude appears underestimated.
On 26 September the lidar cross section between Nouadi-bou and Sal Island (Fig. 6d) reveals a deep aerosol layer lo-cated between 2000 and 3000 m west of 17.5 W. Close to the coast, a thin dust layer located around 1000 m is also still observable. At a higher altitude, a layer from remote Alge-rian sources is also observed (Tanr´e et al., 2003). Figure 9d presents the simulated vertical extinction cross section along a similar, but somewhat extended, flight path. Compared to the lidar cross section, the model misses the layer observed between 18 W and 21 W, mainly because of the discrepancies
in the plume dynamical evolution described above: referring to the horizontal AOD, we find that the vertical cross section does not intercept the dust plume as it does in the SHADE experiment. However, the simulated outflow layer maximum above the Cabo Verde Islands (22–24 W) is located between 2500 and 3500 m, which is consistent with the observed out-flow height. Again, due to the relatively coarse vertical grid resolution, the model does not capture precisely the observed strong stratification of this layer.
Close to the coast area (around 17 W in Fig. 9b, d) both the model and the observations show the evidence of thick low level dust layers close to the sources. In the simulation, the Nouadibou dust plume is particularly visible. Around 4000 m altitude and between 17 and 20 W, some relative maxima linked to remote sources are visible in the model cross section. This result appears consistent with the upper level dust layer observed in the lidar cross section.
In summary, although this test case is negatively affected by errors in the simulation of the cyclonic vortex off the Senegal coasts on 26 September and by the relatively coarse model vertical resolution, the model is able to reproduce a number of the observed features of the dust plume develop-ment for the SHADE case, concerning both its horizontal and vertical structure.
3.3 The “climate mode” simulation
emis-RegCM Dust (JJA 2000)
extinction profiles
b
a
Fig. 12.RegCM simulated seasonal extinction profile along a(a)East-West cross section and(b)North-South cross-section for JJA 2000.
sion events but on the aggregate dust amounts in the simula-tion period.
Figure 10 presents a comparison of satellite AOD data in-ferred from the MISR (Martonchick et al., 1998) satellite sensor and the corresponding simulated AOD. Following a method similar to Schulz et al. (1998), a composite seasonal average of model AOD has been created for this comparison by screening model daily output with coincident daily MISR observations over JJA 2000.
In JJA, the emission of carbon aerosols from biomass burning is minimum over the Sahel region (Liousse et al., 1996), so that the aerosol AOD over this region in the MISR data is dominated by the contribution of desert dust. In sub equatorial Africa, most of the AOD detected by MISR is re-lated to biomass burning aerosols, which are not included in the present simulation and won’t be discussed further.
In the satellite observations, major dust regions are located across a belt encompassing Mauritania, Mali, central Niger, central-eastern Chad and northern Sudan. We also note the dust plume transported across the eastern Atlantic and the high dust loads along the Red Sea, which are tied to flow con-vergence and related transport from the surrounding desert. The model generally captures all these features of the ob-served dust distribution, albeit with some differences com-pared to the measurements: the simulated dust plume appears more concentrated than observed over the Mauritania-Mali region and the dust load is underestimated over north-eastern Sudan. The dust outflow into the Atlantic is well captured by the model. The southern extent of the dust plume over the Sahel, limited by the mean African Monsoon flux in JJA, is well captured. This feature is encouraging in view of the application of the model to study dust-monsoon interactions at climatic time scales.
Figure 11 present a seasonal local comparison between simulated AOD and AERONET data at Cabo Verde situated in the Saharan outflow. AOD data show a strong temporal variability linked to specific dust events. This variability is also present in model outputs. Overall, the average AOD
magnitude and evolution is consistently reproduced by the model (cf. Fig. 11). Some of the specific events are also cap-tured. However as illustrated in the SHADE test case, sim-ulated plume trajectories can deviate from observations, and getting an adequate local representation of each event is still difficult.
Figure 12 shows an east-west and a north-south cross sec-tion of average JJA simulated dust amounts (performed with-out specific screening) across the tracks indicated in Fig. 10, where the main dust regions are located. In both cross sec-tions we see the tendency of the model to produce different dust layers, one close to the surface source and one in the mid-troposphere, between 2000 and 5000 m, caused by verti-cal convective and large sverti-cale transport. A high layer, result-ing from deep convective transport and/or remote sources, is also simulated. This layer structure appears consistent with what has been observed, for example in the SHADE case. The east-west transect shows that the dust reaching the mid-troposphere is mostly transported in a westward direction by the equatorial easterlies, contributing to the Atlantic outflow. Conversely, the north-south transect suggests a weak merid-ional transport from the Sahel, with the dust plume being mostly confined between 15 N and 25 N. The descending mo-tion associated with the Saharan sub-tropical high inhibits large scale meridional transport, and Saharan dust flow into the Mediterranean and European regions is mostly associated with episodic synoptic scale events (as illustrated for exam-ple in our northeast Africa case).
Beside the south Sahara source and Saharan outflow re-gions, the large dust amounts over the Red Sea are captured but slightly overestimated (Fig. 10). In the simulation, we note that the simulated dust slightly affects the AOD over Western Europe and that seasonal AOD in southern Mediter-ranean and North Africa are a bit underestimated compared to MISR.
at a given grid cell depends on the prevalent soil and land cover type and is equal to either 1 or 0. This may lead to an underestimation in emissions in grid cells with low frac-tional dust generation areas (that are now neglected by the model) and an overestimation of emissions in grid boxes of large (but less than 1) fractional dust generation areas. As a result of this problem, the dust distribution in the model would show more patchy patterns than in the observations.
4 Discussion and conclusions
In this paper we implemented a dust aerosol scheme in-cluding emission, transport, gravitational settling, removal and optical property calculations within the regional climate model RegCM. As a first order validation, the model was applied to three test cases, covering temporal scales from episodic (few days), to seasonal (“climate mode”). The first test case focused on a northeast Africa dust storm, the sec-ond on the west Africa SHADE dust outbreak, and the third was a simulation of JJA 2000 for the extended Africa/Europe domain. Comparison with observations for the three cases leads to the following points of conclusion and discussion:
– The RegCM-Dust model is able to simulate the oc-currence of strong dust outbreaks in different regions and dynamical situations. Many observed features of the horizontal and vertical structure of the dust out-breaks over the eastern Mediterranean basin and the western Sahara, which are key regions in terms of re-gional aerosol climatic impacts (e.g. Lelieveld et al., 2002), are simulated well.
– The greatest model deficiency occurred in the SHADE case, when the model failed to reproduce the observed development of a cyclonic low on 26 September. This obviously affected the quality of the dust simulation, however the problems were essentially tied to the dy-namical part of the model and not the dust module. The simulation of the details of meso-scale systems associ-ated with African easterly waves is difficult in climate models (Jenkins et al., 1997), and may depend on many factors, such as model resolution as illustrated on the SHADE case, but also model physics and notably con-vection, model boundary forcing, model internal vari-ability etc. In the present experiments we used stan-dard model configuration and resolution for applica-tion to climate runs, without any specific regional op-timization. The model showed a better performance in simulating the dynamical evolution of the northeast-ern Africa outburst, which was primarily associated to a synoptic scale event. More generally, the performance in simulating details of specific events may not be a crit-ical issue within the context of climate simulations. – In the SHADE case, when the dynamics was captured
satisfactorily, the AOD magnitudes were consistent with
observations. This result indicates that the emission flux scheme produces reasonable dust burdens over the main source regions (west Mauritania, southwest Al-geria). A similar conclusion is drawn from the north-east Africa case. Some local misrepresentation of soil and surface characteristics, as well uncertainties in the emission scheme itself, may lead to a misrepresentation of local sources. This issue is likely to be resolution-dependent and we are planning to incorporate and test in the model a sub-grid representation of soil texture and vegetation types, as well as the use of alternative land use classifications.
– In the seasonal simulation the model captured the spa-tial distribution of the main dust load areas over the Sa-hel, along with the magnitude of the average AOD. The simulated distribution of dust areas was however more concentrated than in the observations, possibly as a re-sult of the above mentioned lack of sub-grid fractional dust emission parameterization in the model. The av-erage dust profile over the Sahel showed a typical two-layered structure, with one layer close to the surface in source regions and the other placed between 2000 and 5000 m. The aerosol seasonal vertical structure is im-portant to address semi-direct and indirect effects. In this regard, forthcoming observational campaigns (e.g. as AMMA) should provide necessary data sets to better validate this aspect of the model.
Overall, the simulations analysed here give encouraging indications concerning the use of our dust model for climate application. We are planning to conduct long term multi-year integrations including dust and other aerosols (Solmon et al., 2006) radiatively active within the RegCM to study the effects of the aerosol radiative forcing on the climate of Africa and the Mediterranean region.
Acknowledgements. We would like to thank I. Seidou Sanda for his work on RegCM and dust radiative properties. Thanks also to F. Dulac as well as the other anonymous reviewers for their constructive comments. Thanks to N. Elguindi for manuscript proofreading.
Edited by: Y. Balkanski
References
Alfaro, S. C., Gaudichet, A., Gomes, L., and Maille, M.: Mineral aerosol production by wind erosion: aerosol particle sixes and binding energies, Geophys. Res. Lett., 25, 991–994, 1998. Alfaro, S. C., Gaudichet, A., Gomes, L., and Maille, M.: Modeling
the size distribution of a soil 5 aerosol produced by sandblasting, J. Geophys. Res., 102, 11 239–11 249, 1997.
Bagnold, R. A.: The physics of Blown sand and Desert Dunes, 265 pp., Methuen, New York, 10, 1941.
Cakmur, R. V., Miller, R. L., and Torres, O.: Incorporating the effect of small scale circulations upon dust emission in an AGCM, J. Geophys. Res., 109, D07201, doi:10.1029/2003JD004067, 2004. Cakmur, R. V., Miller, R. L., Perlwitz, J., Koch, D., Geogdzhayev, I. V., Ginoux, P., Tegen, I., and 15 Zender, C. S.: Constrain-ing the global dust emission and load by minimizConstrain-ing the dif-ference between the model and observations, available at: http: //pubs.giss.nasa.gov/authors/rmiller.html, J. Geophys. Res., in press, 2006.
Dickinson, R., Henderson-Sellers, A., and Kennedy, P.: Biosphere-atmosphere transfer scheme (bats) version 1e as coupled to the NCAR community climate model, Technical report, 20 Na-tional Center for Atmos. Res., 1993.
Eagleman, J. R.: Air pollution meteorology, Trimedia Publishing Co., Lenexa, KS, 258 pp, 1996.
Fecan, F., Marticorena, B., and Bergametti, G.: Parameterization of the increase of aeolian erosion threshold wind friction velocity due to soil moisture for arid and semi-arid areas, Ann. Geophys., 17, 149–157, 1999,
http://www.ann-geophys.net/17/149/1999/.
Formenti, P., Elbert, W., Maenhaut, W., Haywood, J. M., and Andreae, M. O.: Chemical com- composition of mineral dust aerosol during the Saharan Dust Experiment (SHADE) airborne position campaign in the Cape Verde region, September 2000, J. Geophys. Res., 108(D18), 8576, doi:10.1029/2002JD002648, 2003.
Gillette, D. A. and Hanson, K. J.: Spatial and temporal variability of dust production caused by wind erosion in the United States, J. Geophys. Res., 94, 2197–2206, 1989.
Gillette, D. A. and Stockton, P.: Mass momentum and kinetic en-ergy fluxes of saltating particles, in: Aeolian Geomorphology, edited by: Nickling, W. G., Allen and Unwin, Winchester, Mass, 35–56, 1986.
Gillette, D. A. and Stockton, P.: The e ect of nonerodible parti-cles on wind erosin of erodible surfaces, J. Geophys. Res., 94, 12 885–12 893, 1989.
Giorgi, F. and Mearns, L. O.: Introduction to special section: Re-gional climate modeling revis-revisited, J. Geophys. Res., 104, 6335–6352, 1999.
Giorgi, F. and Chameides, W. L.: Rainout lifetimes of highly solu-ble aerosols and gases as inferred from simulations with a general circulation model, J. Geophys. Res., 91, 14 367–14 376, 1986. Giorgi, F. and Bi, X.: A study of internal variability of a regional
climate model, J. Geophys. Res., 105, 29 503–29 521, 2000. Giorgi, F.: A particle dry deposition parameterization scheme for
use in tracer transport models, J. Geophys. Res., 91, 9794–9806, 1986.
Giorgi, F., Marinucci, M., and Bates, G.: Development of a second generation regional climate 15 model (RegCM2). Part I: Bound-ary layer and radiative transfer processes, Mon. Wea. Rev., 121, 2794–2813, 1993a.
Giorgi, F., Marinucci, M., Bates, G., and DeCanio, G.: Develop-ment of a second generation regional climate model (RegCM2). Part II: Convective processes and assimilation of lateral bound-ary conditions, Mon. Wea. Rev., 121, 2814–2832, 1993b. Giorgi, F.: Two-dimensional simulations of possible mesoscale
e ects of nuclear war fires. I: Model description, J. Geophys. Res., 94, 1127–1144, 1989.
Gong, S. L., Zhang, X. Y., Zhao, T. L., McKendry, I. G., Ja e, D. A., and Lu, N. M.: Characteriza- Characterization of soil dust aerosol in China and its transport and distribution during 2001 ACE-Asia: 2. tion Model simulation and validation, J. Geophys. Res., 108, 4262, doi:10.1029/2002JD002633, 2003.
Grell, G. A., Dudhia, J., and Stauffer, D. R.: A Description of the Fifth-generation Penn State/NCAR Mesoscale Model (MM5), NCAR Technical Note, NCAR/TN-389+STR, 138 pp, 2004. Grell, G. A.: Prognostic evaluation of assumptions used by cumulus
parameterizations, Mon. Wea. Rev., 121, 764–787, 1993. Haywood, J., Francis, P., Osborne, S., Glew, M., Loeb, N.,
Highwood, E., Tanr ’ e, D., Myhre, G., Formenti, P., and Hirst, E.: Radiative properties and direct radiative e ect of Saharan 1774 dust measured by the C-130 aircraft during SHADE: 1. Solar spectrum, J. Geophys. Res., 108(D18), 8577, doi:10.1029/2002JD002687, 2003.
Herman, J. R., Bhartia, P. K., Torres, O., Hsu, C., Seftor, C., and Celarier, E.: Global distribu- distributions of UV-absorbing aerosols from Nimbus 7/TOMS data, J. Geophys. Res., 102, 16 911–16 922, 1997.
Hillel, D.: Introduction to soil Physics, 364 pp., Academic, San Diego, Calif, 1982.
Holben, B. N., Eck, T. F., Slutsker, I., Tanr’ e, D., Buis, J. P., Stezer, A., Vermote, E., Reagan, Y., Kaufman, U. J., Nakajima, T., Lavenu, F., Jankowiak, I., and Smirnov, A.: AERONET-A federated instrument network and data archive for aerosol char-acterization, Rem. Sens. Environ., 66, 1–16, 1998.
Holtslag, A., de Bruijn, E., and Pan, H.-L.: A high resolution air mass transformation model for short-range weather forecasting, Mon. Wea. Rev., 118, 1561–1575, 1990.
Hsu, S.-A.: Thermodynamic characteristics of the subcloud layer affecting haze dispersion along the West coast of Borneo., Pure Appl. Geophys., 160, 419–427, 2003.
Hess, M., Koepke, P., and Shult, I.: Optical Properties of Aerosols and Clouds: The Software 15 Package OPAC, Bull. Am. Soc., 79, 831–844, 1998.
Jenkins, G. S.: The 1988 and 1990 summer season simulations for West Africa using a regional climate model, J. Climate, 10, 1255–1272, 1997.
Joussaume, S.: Three-dimensional simulation of the atmospheric cycle of desert dust particles using a general circulation model, J. Geophys. Res., 95, 1909–1941, 1990.
Kiehl, J., Hack, J., Bonan, G., Boville, B., Breigleb, B., Williamson, D., and Rasch, P.: Descrip-Description of the NCAR community climate model (ccm3), Technical report, National Center for At-mos. Res., 1996.
Lelieveld, J., Berresheim, H., Borrmann, S., Crutzen, P. J., Den-tener, F. J., Fischer, H., et al.: Global air pollution crossroads over the Mediterranean, Science, 298, 794–799, 2002.
Liousse, C., Penner, J. E., Chuang, C., Walton, J. J., Eddleman, H., and Cachier, H.: A global three-dimensional model study of carbonaceous aerosols, J. Geophys. Res.-Atmos., 101, 19 411– 19 432, 1996.
Mahowald, N., Zender, C., Luo, C., Savoie, D., Torres, O., and del Corral, J.: Under- Understanding the 30-year Barbados desert dust record, J. Geophys. Res., 107(D21), doi:10.1029/2002JD002097, 2002.
Marticorena, B. and Bergametti, G.: Modeling the atmospheric dust cycle, I, Design of soil- soilderived dust emission scheme, J. Geophys. Res., 100, 16 416–16 430, 1995.
Marticorena, B., Bergametti, G., Gillette, D. A., and Belnap, J.: Factors controlling threshold friction velocity in semiarid ar-eas of the United States, J. Geophys. Res., 102, 23 277–23 287, 1997b.
Marticorena, B., Bergametti, G., Aumont, B., Callot, Y., N’Doume, C., and Legrand, M.: Modeling the atmospheric dust cycle, 2, Simulation of Saharan sources, J. Geophys. Res., 102, 4387– 4404, 1997a.
Martonchik, J. V., Diner, D. J., Kahn, R., Ackerman, T. P., Ver-straete, M. M., Pinty, B., and Gorbon, H. R.: Techniques for the retrieval of aerosol properties over land and ocean using multian-gle imaging, IEEE Trans. Geosci. Remote Sens., 36, 1212–1227, 1998.
Miller, R. L., Tegen, I., and Perlwitz, J.: Surface radiative forcing by soil dust aerosols and the hydrologic cycle, J. Geophys. Res., 109, D04203, doi:10.1029/2003JD004085, 2004.
Miller, R. L., Cakmur, R. V., Perlwitz, J., Geogdzhayev, I. V., Ginoux, P., Kohfeld, K. E., Koch, D., Prigent, C., Ruedy, R., Schmidt, G. A., and Tegen, I.: Mineral dust aerosols in the NASA Goddard Institute for Space Sciences ModelE at-mospheric general circulation model, J. Geophys. Res., 111, D06208, doi:10.1029/2005JD005796, 2006.
Moulin, C., Lambert, C. F., Dulac, F., and Dayan, U.: Control of atmospheric export of dust from North Africa by the North At-lantic oscillation, Nature, 387, 691–694, 1997.
Myhre, G., Grini, A., Haywood, J. M., Stordal, F., Chatenet, B., Tanr´e, D., Sundet, J. K., and Isaksen, I. S. A.: Modeling the radiative impact of mineral dust during the Saharan Dust Exper-iment (SHADE) campaign, J. Geophys. Res., 108(D18), 8579, doi:10.1029/2002JD002566, 2003.
Nickovic, S., Kallos, S., Papadopoulos, A., and Kakaliagou, O.: A model for prediction of desert 25 dust cycle in the atmosphere, J. Geophys. Res., 106, 18 113–18 129, 2001.
Penner, J. E., Andreae, M., Annegarn, M., et al.: Aerosol, their di-rect and indidi-rect effets, in: Climate Change 2001: The Scientific Basis. Contribution of Working Group I to the Third AsAssess-ment Report of the IntergovernAsAssess-mental Panel on Climate Change, edited by: Houghton, J. T., Ding, Y., Griggs, D. J., et al., Cam-bridge Univ. Press, New York, chap. 5, 291–336, 2001.
Qian, Y., Giorgi, F., Huang, Y., Chameides, W. L., and Luo, C.: Simulation of anthropogenic sulfur over East Asia with a re-gional coupled chemistry-climate model, Tellus B, 53B, 171– 191, 2001.
Rao, S. T., Ku, J.-Y., Berman, S., Zhang, K., and Mao, H.: Sum-mertime characteristics of the atmospheric boundary layer and relationships to ozone levels over the Eastern United States, Pure Appl. Geophys., 160, 21–55, 2003.
Sokolik, I. N., Toon, O. B., and Bergstrom, R. W.: Modelling the ra-diative characteristics of air- airborne mineral aerosols at infrared wavelengths, J. Geophys. Res., 103, 8813–8826, 1998.
Solmon, F., Giorgi, F., and Liousse, C.: Aerosol modeling for re-gional climate studies: Appli- Application to anthropogenic par-ticles and evaluation over a European/African domain, Tellus B, 58(1), 51–72, 2006.
Song, C. H. and Carmichael, G. R.: A three-dimensional modeling investigation of the evolution processes of dust and sea-salt par-ticles in east Asia, J. Geophys. Res., 106, 18 131–18 154, 2001. Schulz, M., Balkanski, Y., Guelle, W., and Dulac, F.: Role
of aerosol size distribution and source location in a three di-mensional simulation of a Saharan dust episode tested against satellite-derived measurements , J. Geophys. Res., 103, 10 579– 10 592, 1998.
Tanr´e, D., Remer, L. A., Kaufman, Y. J., Mattoo, S., Hobbs, P. V., Livingston, J. M., Russell, P. B., and Smirnov, A.: Retrieval of aerosol optical thickness and size distribution over ocean from 20 the MODIS airborne simulator during TARFOX, J. Geophys. Res., 104, 2261–2278, 1999.
Torres O., Bhartia, P. K., Herman, J. R., and Ahmed, Z.: Derivation of aerosol properties from satellite measurements of backscat-tered ultraviolet radiation. Theortical Basis, J. Geophys. Res., 103, 17 099–17 110, 1998.
Zender, C. S., Bian, H., and Newman, D.: Mineral dust
en-trainment and deposition 25 (DEAD) model: Description
and 1990s dust climatology, J. Geophys. Res., 108, 4416, doi:10.1029/2002JD002775, 2003.
Zender, C. S., Miller, R. L., and Tegen, I.: Quantifying mineral dust mass budgets: Terminology, constraints, and current estimates, Eos Trans. Am. Geophys. Union, 85, 48, 509–512, 2004. Zhang, L., Gong, S., Padro, J., and Barrie, L.: A size-segregated
particle dry deposition scheme 30 for an atmospheric aerosol module, Atmos. Environ., 35, 549–560, 2001.