FINANCIAL FUTURE PROSPECT INVESTIGATION USING BANKRUPTCY FORECASTING MODELS IN HUNGARIAN MEAT PROCESSING INDUSTRY
Dalma Pető1, Andrea Rózsa2
Cost accountant, JABIL Circuit Magyarország Kft., Tiszaújváros, Hungary
University of Debrecen, Faculty of Economics, Institute of Accounting and Finance, Debrecen, Hungary
Abstract:
Our main research topic is the analysis of leading companies in the Hungarian meat processing industry in terms of liquidity criteria. We examine this scientific subject by application of financial indicators and several important bankruptcy forecasting models. In our thesis the emphasis is placed on the presentation and evaluation of business failure models.
The topicality of the research subject is rooted in the economic crisis and recession, which made solvency a key issue. Maintaining the competitive position in the market and the ability to stay in competition depend on the capability to generate an appropriate level of net operative cash flow.
The most important research questions are the following. Which financial methods can be used to predict and estimate the situation when a company is facing bankruptcy? Do bankruptcy forecasting models provide accurate forecasts and what conclusions can be drawn based on these results?
In our study we present the actual economic situation and the main problems of the sector, select the sample companies, calculate and compare the applied financial ratios and the most relevant bankruptcy forecasting models. On the basis of annual reports concerning 2010-2013 interval we investigate the financial position of leading pork processing companies. We make a comprehensive and comparative analysis concerning capital structure, liquidity, and profitability; consequently identify risky processes and companies having high probability of insolvency. Finally, we demonstrate and evaluate the results of three traditional bankruptcy forecasting models (Altman, Springate, and Fulmer) and four modern models (DA, LR, industrial DA and industrial LR).
Keywords: financial analysis, bankruptcy models, meat processing industry, Hungary
JEL classification: G30; G33; M21; L66
1. Introduction and research question
The main research topic of this paper is comprehensive and comparative analysis of leading companies in the Hungarian meat processing industry in terms of liquidity criteria. This scientific subject is examined by using specially selected financial indicators and the most relevant (traditional, modern and industrial) bankruptcy forecasting models. The topicality and novelty of the research field and applied methods can be substantiated by the fact that solvency became a key issue during economic crisis and recession. Maintaining the competitive position in the market and the ability to stay in competition depend on the firms’ capability to generate an appropriate level of net operative cash flow. The most important research questions are the following:
· Which financial methods can be used to predict and estimate the situation when a company is facing bankruptcy?
special field of Hungarian food-processing industry suffering from several insolvency problems?
· Do business failure models provide accurate forecasts, and what conclusions can be drawn based on these results?
First of all, we review the major economic and financial process in this industry. Special problems of Hungarian pork meat industry is analysed in detail by Bartha (2012). The study lists four main points as the sources of the problems: lack of capital and marketing, separation of land ownership and farming and continuous changes in consumer habits. She points at weak creditworthiness, solvency and financing problems. Consequently, this sector is in a situation where there is no possibility for investment, product development and innovation. High VAT (27%) effective up till January 2014, the official fees and compliance with animal welfare and environmental standards together caused the formation of the sector's black economy. Additional problems are caused by the decrease of pork population. According to the Hungarian Central Statistical Office Journal, so-called Statistical Mirror, the pig population in 2014 is approximately only 70% of the 2004 level (Statistical Mirror, 2014. Volume VIII., Issue 15., Figure 2). Other problems are the reduced domestic demand, and the one-year Russian export ban put into force in 6 August, 2014. These processes mean economic and industrial background that is essential to assess the financial performance of the selected companies.
The database was defined on the basis of the main activity of companies. Among the activity codes of Hungarian Central Statistical Office we selected the "1011'08 Meat Processing and Preserving (Main activity)" code of NACE. Currently, 325 companies are listed for this industry in the so-called Opten corporation information database. We used annual reports of all the 325 companies in order to calculate industry rates for applying modern industrial bankruptcy forecasting models.
We selected the research sample according to the following criteria: same activity (pork processing and trade), similar product structure (salami, chitterlings, ham and bacon, etc.), annual report format, and average revenue level over 1 billion HUF. Based on these filter conditions we identified nine market leader companies – which have the largest revenue – as research sample, and denoted them as follows (according to revenue level of 2012): 1,2,3,4,5,6,7,8,9.
Table 1: Revenue, operating profit and net profit of 2012 concerning the sample
Data/Company 1 2 3 4 5 6 7 8 9
Revenue 17655 13657 11148 5505 4944 4781 4126 2204 1048 Operating profit -1756 -1281 362 -1183 -566 420 20 49 -73 Net profit -2260 -1795 241 -1214 -614 446 0,6 52 -74 Source: own data collection from www.e-beszamolo.kim.gov.hu and Opten corporation information database (data in million HUF)
models able to provide additional information in this industry or does they simply confirm the probability of insolvency situation derived from the comprehensive financial analysis concerning the riskiest firms of the sample?
2.Methodology and literature review
During the first phase of the research complex financial analysis was performed. To select the indicators and to verify the further analyses methodology of Droj (2012), studies of Rózsa and Tálas (2012), Rózsa (2014a and b) and book of Virág and Fiáth (2010) were used. These research projects also apply complex financial analysis methodology in sectoral approach by using well-selected index series. These publications fulfil comparative financial analysis based on combined analysis of capital structure, balance sheet-based and cash flow-based liquidity position, and traditional and/or modern indicators of profitability.
Firstly, we investigated the risks in balance sheet and capital structure: we calculated indebtedness ratios, and analysed the proportion and content of short-term liabilities; so the financial risks were identified. Then the financial solvency situation was analysed on the basis of Tarnóczi and Fenyves (2011) and the above mentioned publications. After that the overall liquidity ratio, the quick ratio and change of operating cash flow/ short-term liabilities values were examined. Finally, we calculated profitability indicators such as return on sales (ROS), return on assets (ROA), and return on equity (ROE) which are uniform in the domestic and international literature. By comprehensive and comparative analysis of these companies we identified the riskiest ones. We focused on the corporations, where all of the main types of indicators signed a potential of insolvency situation.
During the second phase of the research we had to select from the bankruptcy forecasting models. Thereinafter, we describe the types and development of the different bankruptcy forecasting models forming the basis of this research. Imre (2008) examined 126 models, and classified them according to their methodology and developmental periods. Bellovary et al. (2007) also chronologically compared the main bankruptcy models from 1930 to 2007. According to the authors four stages can be distinguished in the development of the evolution models:
0. The period of conception of bankruptcy research (1931-67)
This period did not result in bankruptcy model in modern sense; it was more the examination of the bankruptcy as an economic forecasting event; so this period can be regarded as an initial stage.
Studies of Ramser, Foster, Fitzpatrick, Winakor, Smith as well as Merwin and Beaver belong to this stage.
1. The period of discriminant analysis (1968-79)
According to Imre (2008), this period can be characterized by the name of Altman (the first model developer) and by spread of discriminant analysis. Although univariate analysis still occurred, discriminant analysis clearly became the dominant methodology. The most remarkable researchers of this period are: Altman and co-authors, Deakin, Blum, and Edmister.
2. The period of logistic regression penetration (1980-1989)
3. The period of appearance of artificial intelligence (from 1990 to our days)
The artificial intelligence is represented by neural network technology in bankruptcy literature. In 1990 Odom and Sharda introduced this technology, and today it is the most important topic in methodological research of bankruptcy models. Most of the research suggests that results and predictive power of neutral networks is better than that of the models which use former methods. Models based on neural networks have been developed for example by Odom and Sharda, Coats, Fant, Back and co-authors, Olmeda, Fernandez, Kiviluoto, Laitinen (Rácz, 2012).
Some important studies concerning practical applications of the bankruptcy models have to mentioned, too. Imanzadeh et al. (2011) reviewed business failure literature since the 1930s. The authors compared the Altman model variants and logistic regulations, and finally they used the Springate and Zmijewski model for the selected firms of the Tehran Stock Exchange. After a comprehensive literature review, Pervan et al. (2011) applied discriminant analysis (DA) and logistic regression (LG) methods by using canonical discriminant function coefficients for Croatia’s 156 companies. Boritz et al. (2007) emphasized that most of the experts generally prefer business failure models of Altman (1968) and Ohlson (1980). However, Altman and Ohlson models were developed using US data thus data fitting problems occurred for Canadian researchers working with domestic data. Moreover, the business environment in US and Canada has changed in the more than twenty-five years since the Altman and Ohlson models were estimated. Boritz and his co-authors applied three Canadian bankruptcy prediction models made by Springate (1978), Altman and Levallee (1980), and Legault and Veronneau (1986). Results of these models were compared to that of Altman and Ohlson models to express the robustness of all models over time and to investigate applicability of the Altman and Ohlson models in the Canadian economic circumstances (Boritz et al., 2007). Finally, Fenyves and Nagy (2014) examined the importance of business failure models in controlling accounts toolbars from theoretical point of view.
3.Results
3.1. Analysis of financial indicators
Before investigating the results of bankruptcy forecasting models it is important to examine the financial situation. First, capital structure of the company is investigated, and then we analyse the liquidity situation using balance sheets and cash flow statements. Concerning property investigation, we analysed asset and capital structure including main group of balance sheet/total assets or sources and internal structure. We focused on the indicators of total liabilities/total assets (Debt/Assets) and short-term liabilities/liabilities (STL/Debt). We considered a company to be risky if its indebtedness ratio is high (over 70%) and if the short term credits ratio is also high.
According to these criteria, we concluded that the control group (firms 2 and 5) and the companies 1, 3 and 4 are the riskiest ones on the basis of the capital structure.
Table 2: Capital structure of the control group concerning selected indicators
Companies 2 5
Year 2010 2011 2012 2010 2011 2012
Debt/Assets 88% 96% 79% 65% 70% 166%
Table 3: Capital structure of other risky firms of the sample
Companies 1 3 4
Year 2010 2011 2012 2013 2010 2011 2012 2013 2010 2011 2012 2013
Debt/Assets 75% 75% 73% 62% 21% 34% 49% 70% 75% 123% 74% 75%
STL/Debt 84% 90% 80% 81% 100% 100% 100% 88% 81% 45% 100% 81%
Source: calculated by the authors using annual reports
After examining the capital structure we focused on exploring the liquidity situation of these firms. Applying standard definitions of international literature we used the general liquidity ratio, the quick ratio, the loan-to-pointer and net working capital indicators, and then the ratio of operating cash flow (OCF) and short-term liabilities (STL).
Table 4: Liquidity situation of the control group concerning selected indicators
Companies 2 5
Year 2010 2011 2012 2010 2011 2012
Quick ratio 0,46 0,67 0,83 0,22 0,19 0,10
OCF/Short term liabilities 1,3% -13,1% 8,6% 11,4% -1,7% 5,6% Source: calculated by the authors using annual reports
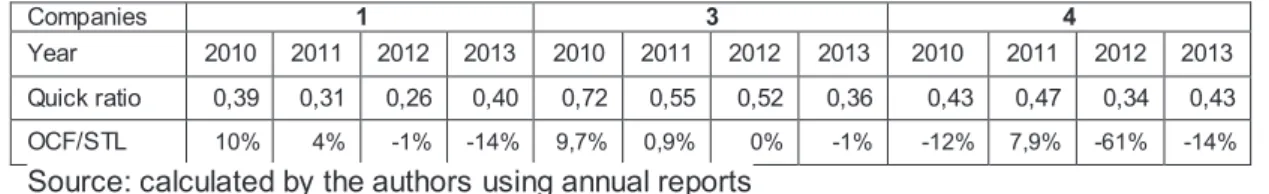
Table 5: Solvency situation of other risky firms of the sample
Companies 1 3 4
Year 2010 2011 2012 2013 2010 2011 2012 2013 2010 2011 2012 2013
Quick ratio 0,39 0,31 0,26 0,40 0,72 0,55 0,52 0,36 0,43 0,47 0,34 0,43
OCF/STL 10% 4% -1% -14% 9,7% 0,9% 0% -1% -12% 7,9% -61% -14%
Source: calculated by the authors using annual reports
In terms of liquidity the final conclusion is that companies 1, 2, 3, 4 and 5 are the riskiest ones according to balance sheet based indicators. Summarising the capital structure and solvency ratios it can be stated that the riskiest companies are the member of control group (companies 2 and 5) and firms 1 and 4. Moreover, we identified two companies of fluctuating financial risk. In our opinion company 3 may have serious solvency problems in the future, consequently, it is important to test the potential insolvency situation by using business failure models. In the case of firm 9 the selected indicators sign reasonable situation, so our expectation is that bankruptcy prediction models will suggest solvency situation.
According to the comprehensive and comparative financial analysis, our preliminary expectations concerning the expected results of seven different business failure models are the following.
· The control group (firms 2 and 5) will represent insolvency situation for every year by every model.
· In the case of companies 1 and 4 insolvency situations are also expected by the results of selected bankruptcy forecasting models.
· In our opinion, company 3 will probably show insolvency according to the three traditional bankruptcy models, but we think that modern models might indicate different results.
· In case of firm 9, in accordance with the advantageous capital structure and balance sheet based ratios, we expect that all of the models will show solvent situation.
3.2. Analysis of bankruptcy models
Altman created his model in 1968, and he determined this model’s cut of point at 1.23. It means that a cut-off point (Z) less than 1.23 indicates that the company is bankrupt; if the value of Z is between 1.23 and 2.90, the company faces to uncertain future; and if the value of Z higher than 2.90, the company is solvent (Virág et al., 2013). The riskiest firms where we expected insolvency on the basis of business failure models were companies 1, 2, 4 and 5. This hypothesis was confirmed except company 2 that were listed in the grey zone in all the three years. In case of company 3 we supposed insolvency according to the traditional models, however, according to Altman’s model this company was in grey zone at this time. Surprisingly, the company 8 was classified in uncertainty zone by Altman’s model, although it had not been expected on the basis of comparative financial analysis. All the companies not mentioned in this paragraph were classified in solvent category by the model. So thus company 9, too, about which we did not have definite expectation.
Using financial data of Canadian industry companies Gordon Springate created his bankruptcy forecasting model based on discriminant analysis in 1978 (Boritz and Kennedy-Sun, 2007). The model cut off point value is 0.862, consequently, if Z value is less than 0.862 the company is classified as insolvent. We expected insolvency for the control group (companies 2 and 5) and for companies 1 and 4. Our expectations were confirmed. For company 2, however, the model supported our assumption only in the year 2010. For company 9, which we defined uncertain and risky based on financial analysis, the model indicated insolvency in 2011 and 2012. Although Altman’s model did not show bankruptcy for this company, it noteworthy that it showed poor financial figure and ratios in last three years. But in case of company 3 – which can be regarded as disadvantageous on the basis of capital structure and liquidity – the model shows solvency in the examined three years. Another surprising conclusion is that the Springate model indicates insolvency in 2010 for company 8, although financial analysis produced excellent results for this firm in the whole investigated interval.
According to Virág et al. (2013) the Fulmer-model was finalized in 1984. This model uses 9 indicators. The model determines H value as the cut-off point; the company is solvent if it is higher than 0. Unfortunately, the model could not be run for several companies because of logarithmic formula could not be calculated in the case of negative operating income (concerning company 1, 2, 5, 7, 9). In accordance with the expectation company 4 was predicted to be insolvent by the model. However, company 8, which could not be considered to be risky on the basis of its capital structure or liquidity, is indicated as insolvent by the model. Because three models suggested at least a partly insolvency situation for company 8, contrary to the results of complex financial ratio investigation, it seems that even traditional bankruptcy forecasting models may provide additional information comparing to the conclusions derived from financial analyses.
The discriminant analysis model was made by Hajdú and Virág (1996) based on indicators deriving from balance sheet data of 1991. The cut-off point value is 2.61612, and the classification accuracy is 77.9%. Using this model, companies 1, 3, 4 and 8 could be considered to be insolvent. Results concerning companies 1 and 4 are in accordance with that of the other models; similarly, company 3 was proved to insolvent by the Fulmer and Altman models, respectively. In cases of company 2 and 5, however, where the financial analyses showed a high risk of capital structure and liquidity, results of the bankruptcy prediction model did not meet our expectations. Surprisingly, company 8 showed insolvency according to this model, too. This result also supports our earlier opinion that additional information can be obtained by using business failure models.
control group (Virág, 2004). Results coming from using this model results are very similar to that of the Fulmer model. It is not surprising, because both models based on logistic regression. According to this companies 1, 2, 4 and 5 are insolvent. Only this model indicated company 2 as insolvent. Company 5 was classified as insolvent by every model except the Fulmer model, and this confirms risks detected by the financial analysis. These results are supported by the fact that the company 5 is currently under liquidation in practice. The model indicated insolvency for companies 3 and 9, too. This model also showed insolvency for company 8 although it could not be considered to be risky on the basis of financial indicators.
Hungarian experts, Virág and Kristóf identified six indices for industry indicator adjusted discriminant analysis. The cut-off point is 1.06252. Using the industry average adjusted financial indicators in the equation a Z value can be obtained. If it is higher than 1.06252, the company is classified as insolvent, otherwise as solvent (Kristóf, 2005). We calculated the industry indexes considering the overall industry data series. Annual reports data of 325 companies were used, which were downloaded from the Opten system. Based on this model, number of the insolvent firms reduced, and companies 4, 5, and 8 would become insolvent in the future. It is noteworthy that results of company 8 is excellent on the basis of financial analysis concerning liquidity, however, the industry indicator adjusted discriminant analysis indicated insolvency for it. Furthermore, in the case of the company 1, contrary to most of the models, this one did not indicate insolvency. Similarly, neither company 3 nor company 9 did show bankruptcy, although these firms were generally uncertain.
Value of cut-off point of the industry indicator adjusted logistic regression model is 0.48; if this value is greater than 0.48, the company classified as solvent. Based on our calculation this model has proven to be the most permissive one because this model occurred least insolvency in results. The outcome of this model is the following: companies 2, 4, 5 show insolvency situation. Common result of the indicator adjusted models is that companies 1, 3, 6, 7, and 9 are solvent firms. In all cases the absolutely solvent one is firm 6, and firm 7 has also relatively safe operation.
4. Conclusions
Performing the detailed calculations of selected business failure models we concluded that companies 1, 4 and 5 have the highest probability of insolvency. Companies 2 and 3 are uncertain, and firms 6, 7 and 9 can be regarded as solvent.
Table 5: Results of bankruptcy predicition models
1 2 3 4 5 6 7 8 9
Altman Insolvent Uncertain Uncertain Insolvent Insolvent Solvent Solvent Uncertain Solvent
Springate Insolvent Solvent Solvent Insolvent Insolvent Solvent Solvent Solvent Insolvent
Fulmer Undefined Undefined Insolvent Insolvent Undefined Solvent Undefined Insolvent Undefined
DA Insolvent Solvent Insolvent Insolvent Solvent Solvent Solvent Insolvent Solvent
LR Insolvent Insolvent Insolvent Insolvent Insolvent Solvent Solvent Insolvent Insolvent
Industrial DA Solvent Solvent Solvent Insolvent Insolvent Solvent Solvent Insolvent Solvent
Industrial LR Solvent Insolvent Solvent Insolvent Insolvent Solvent Solvent Solvent Solvent
Source: own calculation using annual reports and total industrial data series downloaded from Opten corporation information system and www.e-beszamolo.kim.gov.hu
Our expectations deriving from the complex financial analysis were confirmed in the case of firms 1, 4 and 5. Bankruptcy prediction models supported the risk of insolvency situation revealed by ratio investigation as well. According to financial analysis we regarded insolvency situation as probable for firm 3, but we felt running down bankruptcy prediction models necessary to refining future prospects. According to our results, it is not obvious that firm 3 will bankrupt, thus the company fell into grey zone.
Moreover, our expectation was also verified in the case of company 9. However, we could not support our preliminary conception concerning company 2. The results of the bankruptcy forecasting models did not provide clear answer to the current insolvency, although the company is recently under liquidation. Thus, it is imaginable that company 2 can arrange a mutually acceptable payment condition for itself and its suppliers.
Finally, it can be stated, that bankruptcy forecasting models can provide additional information comparing to conclusions coming from comparative and comprehensive financial analysis. In one case, the results of models did not indicate the risks suggested by financial analysis (company 2); while in another case, the financial analysis indicated normal financial conditions, but majority of bankruptcy forecasting models referred to insolvency risk (company 8). Therefore, the bankruptcy forecasting models are also useful to identify short-term risks; consequently, they draw attention to the necessity of more efficient control of short-term solvency processes.
References
Bartha, A. (2012): A sertésvertikum stratégiai elemzése (Strategic analysis of pig farms and pork processing industry), PhD disszertáció, Ihrig Károly Gazdálkodás- és Szervezéstudományok Doktori Iskola, Debrecen.
Boritz, J. E. – Kennedy, D. B. – Sun, J. Y. (2007): Predicting Business Failures in Canada. School of Accountancy, University Waterloo, Canada.
http://papers.ssrn.com/sol3/papers.cfm?abstract_id=470803, Downloading date: 10-09-2014
Bellovary, J. – Giacomo, D. – Akers, M. (2007): A Review of Bankruptcy Prediction Studies: 1930-Present, Journal of Financial Education, 33: pp. 1-42.
Droj, L. (2012): Financial performance analysis based on the financial statements for the companies located in the Bihor-Hajdu Bihar Euroregion, Annals of Faculty of Economics, 1: (2) pp. 464-470.
Fenyves, V. – Nagy, S. (2014): Csődelőrejelzési modellek alkalmazásának jelentősége a controlling beszámolók eszköztárában, Controller Info, 2: (4) pp. 20.
Imanzadeh, P. – Maran-Jouri, M. – Sepehri, P. (2011): A Study of the Application of Springate and Zmijewski Bankruptcy Prediction Models in Firms Accepted in Tehran Stock Exchange, Australian Journal of Basic and Applied Sciences, 5: (11) pp. 1546-1550. Imre, B. (2008): Bázel II. definíciókon alapuló nemfizetés-előrejelzési modellek magyarországi vállalati mintán (2002-2006)(Bankruptcy prediction models based on Basel II definitions applying in the sample of Hungarian firms (2002-2006)), PhD disszertáció, pp. 1-157.
Kristóf, T. (2005): A csődelőrejelzés sokváltozós statisztikai módszerei és empirikus vizsgálata, Statisztikai Szemle, 83: (9) pp. 841-863.
Központi Statisztikai Hivatal (Central Statistical Office): Állatállomány (Stock of animal, flock of cattle) (01-06-2014), Statisztikai tükör 8: (15) pp. 1-5.
Rácz, Á. (2010): Tejipari vállalatok vizsgálata csődelőrejelző modellek segítségével (Investigation of significant companies in Hungarian dairy industry using bankruptcy forecasting models), Diploma dolgozat (MSc thesis), University of Debrecen, Debrecen, pp. 1-70.
Rózsa, A. – Tálas, D. (2012): Competitiveness analysis of leading companies in Hungarian dairy industry by liquidity indicators. Annals of the University of Oradea Economic Science, 21: (1) pp. 759-764.
Rózsa, A. (2014)a: Financial performance analysis and bankruptcy prediction in Hungarian dairy sector. Annals of the University of Oradea Economic Science, 23: (1) pp. 938-947. Rózsa, A. (2014)b: Financial position of building industry in Hajdú-Bihar county (E-Hungary) in the period of 2008-2012: Regional sectoral analysis based on economic performance ratios. International Review of Applied Sciences and Engineering 5: (1) pp. 67-77.
Tarnóczi, T. – Fenyves, V. (2011): Liquidity management and corporate risk. Annals of the University of Oradea Economic Science, 1: (1) pp. 530-536.
Virág, M. – Kristóf, T. – Fiáth, A. – Varsányi, J. (2013): Pénzügyi elemzés, csődelőrejelzés, válságkezelés (Financial analysis, bankruptcy prediction, crisis management). Kossuth Kiadó, pp. 1-301.
Virág, M. – Fiáth, A. (2010): Financial Ratio Analysis. AULA Kiadó, Budapest.
Virág, M. – Hajdu, O. (1996): Pénzügyi mutatószámokon alapuló csődmodell-számítások (Bankruptcy model calculations based on financial ratios), Bankszemle 5, pp. 42-53. Virág, M. – Hajdu, O. (2001): A Hungarian model for predicting financial bankruptcy. Society and Economy in Central and Eastern Europe 1-2., pp. 28-46.