Three-Dimensional Imaging of the
Intracellular Fate of Plasmid DNA and
Transgene Expression: ZsGreen1 and Tissue
Clearing Method CUBIC Are an Optimal
Combination for Multicolor Deep Imaging in
Murine Tissues
Shintaro Fumoto*☯, Koyo Nishimura☯, Koyo Nishida, Shigeru Kawakami*
Graduate School of Biomedical Sciences, Nagasaki University, Nagasaki, Japan
☯These authors contributed equally to this work.
*[email protected](SF);[email protected](SK)
Abstract
Evaluation methods for determining the distribution of transgene expression in the body and thein vivofate of viral and non-viral vectors are necessary for successful development ofin vivogene delivery systems. Here, we evaluated the spatial distribution of transgene expression using tissue clearing methods. After hydrodynamic injection of plasmid DNA into mice, whole tissues were subjected to tissue clearing. Tissue clearing followed by con-focal laser scanning microscopy enabled evaluation of the three-dimensional distribution of transgene expression without preparation of tissue sections. Among the tested clearing methods (ClearT2, SeeDB, and CUBIC), CUBIC was the most suitable method for determin-ing the spatial distribution of transgene expression in not only the liver but also other tissues such as the kidney and lung. In terms of the type of fluorescent protein, the observable depth for green fluorescent protein ZsGreen1 was slightly greater than that for red fluores-cent protein tdTomato. We observed a depth of ~1.5 mm for the liver and 500μm for other tissues without preparation of tissue sections. Furthermore, we succeeded in multicolor deep imaging of the intracellular fate of plasmid DNA in the murine liver. Thus, tissue clear-ing would be a powerful approach for determinclear-ing the spatial distribution of plasmid DNA and transgene expression in various murine tissues.
Introduction
The development of gene delivery systems requires methods to monitor transgene expression. Firefly luciferase is often employed as a reporter gene. It has high sensitivity and a relatively short half-life [1]. Thus, firefly luciferase is suitable for quantitative analysis of transgene
OPEN ACCESS
Citation:Fumoto S, Nishimura K, Nishida K, Kawakami S (2016) Three-Dimensional Imaging of the Intracellular Fate of Plasmid DNA and Transgene Expression: ZsGreen1 and Tissue Clearing Method CUBIC Are an Optimal Combination for Multicolor Deep Imaging in Murine Tissues. PLoS ONE 11(1): e0148233. doi:10.1371/journal.pone.0148233
Editor:Paul McNeil, Medical College of Georgia, UNITED STATES
Received:July 26, 2015
Accepted:December 1, 2015
Published:January 29, 2016
Copyright:© 2016 Fumoto et al. This is an open access article distributed under the terms of the Creative Commons Attribution License, which permits unrestricted use, distribution, and reproduction in any medium, provided the original author and source are credited.
Data Availability Statement:All relevant data are within the paper and its Supporting Information files.
expression. Fluorescent proteins, such as enhanced green fluorescent protein and Discosoma red fluorescent protein [2], can visualize transgene expression and are suitable for determining the distribution, number and type of transgene-positive cells [3]. In general, to observe fluores-cent proteins in tissues, it is necessary to prepare thin tissue sections because of the absorbance of excitation light, scattering, and autofluorescence. Delicate techniques are required to prepare fine sections of tissues. Reconstruction of a three-dimensional image after tissue sectioning is difficult because it is easy to lose the specimen during consecutive tissue sectioning. Two-pho-ton excitation microscopy [4] can overcome this problem. It can observe a depth of ~700μm
within intact tissues. However, multicolor imaging by two-photon excitation microscopy is rel-atively difficult compared with confocal laser scanning microscopy (CLSM), because two-pho-ton excitation wavelengths are highly dependent on fluorochromes and often overlap with each other [5].
In addition to transgene expression, the biodistribution of vectors is an important issue. The use of radioisotopes has enabled quantification of the amount of vector in each tissue [6–8]. Moreover, the sensitivity of radioisotopes is extremely high compared with fluorescent probes. In contrast, fluorescence has several advantages to determine the cellular distribution and intracellular fate of the vector because of multicolor staining. However, it is also necessary to prepare thin tissue sections for observation of the vector.
Here, we applied tissue clearing methods [9] to observe fluorescence in whole tissue speci-mens without the need to prepare tissue sections. Several tissue clearing methods have been developed, especially for the brain in neuroscience [10–16]. Among the fluorescent protein-compatible methods, we applied ClearT2[10], SeeDB [11], and CUBIC [12,13] because of their simplicity (i.e. immersion in clearing solutions). In this study, we compared these methods to determine the optimal approach to observe three-dimensional transgene expression in tissues. Among the variety of fluorescent proteins, we chose bright fluorescent proteins ZsGreen1 [17] and tdTomato [18,19] as green and red fluorescent proteins, respectively, to compare their effectiveness for deep imaging. We simultaneously delivered two plasmid DNAs encoding ZsGreen1 and tdTomato by hydrodynamic injection into mice. To test the applicability of the tissue clearing method, transgene expression was evaluated in not only the liver, but also other tissues including the heart, kidney, spleen, lung, stomach, and small and large intestines. More-over, we applied the method to elucidate thein vivointracellular fate of plasmid DNA in the liver after hydrodynamic injection.
Materials and Methods
Reagents
Paraformaldehyde, formamide, fructose, urea, 2,20,2@-nitrilotriethanol, and sucrose were
pur-chased from Wako Pure Chemical Industries, Ltd. (Osaka, Japan). Polyethyleneglycol (PEG; molecular weight: 4,000) and Triton X-100 were purchased from Nacalai Tesque (Kyoto, Japan).N,N,N0,N0-tetrakis(2-hydroxypropyl)ethylenediamine andα-thioglycerol were pur-chased from Tokyo Chemical Industry Co., Ltd. (Tokyo, Japan). 40
,6-Diamidino-2-phenylin-dole dihydrochloride (DAPI) was purchased from Sigma-Aldrich Co. Llc. (St. Louis, MO, USA). Tetramethylrhodamine (TMR)-labeled dextran (molecular weight: 10,000; lysine fix-able) was purchased from Molecular Probes, Inc. (Eugene, OR, USA).
Plasmid DNA
The pCMV-luciferase vector encoding firefly luciferase under the control of the cytomegalovi-rus promoter was constructed previously [20]. Plasmid DNAs pZsGreen1-N1 encoding green fluorescent protein ZsGreen1 and ptdTomato-C1 encoding red fluorescent protein tdTomato
were purchased from Clontech (Takara Bio inc., Shiga, Japan). Plasmid DNA was amplified in Escherichia colistrain DH5α, isolated, and purified using an EndoFree1Plasmid Giga Kit (Qiagen GmbH, Hilden, Germany). Plasmid DNA was stored at−20°C prior to experiments.
TMR- or Cy5-labeled plasmid DNAs were prepared using a Label IT Nucleic Acid Labeling Kit (Mirus Co., Madison, WI, USA).
Animals
Male ddY mice (5 weeks old, 25.5–28.5 g) were purchased from Kyudo Co., Ltd. (Kumamoto, Japan). They were housed in an air-conditioned room and maintained on a standard labora-tory diet (MF, Oriental Yeast, Co., Ltd., Tokyo, Japan) and waterad libitum. All animal experi-ments were carried out in accordance with the Guide for the Care and Use of Laboratory Animals, as adopted and promulgated by the U.S. National Institutes of Health, and the Guide-lines for Animal Experimentation of Nagasaki University. The protocol was approved by the Animal Care and Use Committee of the Nagasaki University (Permission number:
1304171055). Surgeries were performed under sodium pentobarbital anesthesia, and all efforts were made to minimize suffering.
In vivo
gene transfer
A high-volume solution of plasmid DNAs (10μg/2.5 mL in saline) was rapidly injected (within
5 s) into the tail vein of mice. In some experiments, TMR-dextran (250μg/mL) was co-injected
with plasmid DNA. At 24 h after injection, the mice were subjected to luciferase assay or perfu-sion fixation under anesthesia with pentobarbital. For perfuperfu-sion, a 26 G needle connected to a tube was passed through the left ventricle. The perfusates were 10 mL of phosphate-buffered saline (PBS) containing 10 U/mL heparin, 50 mL PBS, 200 mL of 4% paraformaldehyde in PBS, and 50 mL PBS in this order. After perfusion fixation, tissue samples were collected from mice and subjected to tissue clearing.
Tissue clearing
Tissue clearing was performed according to the original methods reported elsewhere [10–13]. Depending on the method, fixed tissues were immersed in a tissue clearing solution(s) for sev-eral days. For ClearT2, immersion times were 1, 1 and 24 h for 25% formamide/10% PEG, 50% formamide/20% PEG, and 50% formamide/20% PEG, respectively. For SeeDB, immersion times were 4–8, 4–8, 4–8, 12, 12 and 24 h for 20%, 40%, 60%, 80%, 100% and 115% (weight per volume) fructose with 0.5%α-thioglycerol, respectively. For CUBIC, fixed tissues were immersed in reagent 1 (25%N,N,N0,N0-tetrakis(2-hydroxypropyl)ethylenediamine, 25% urea,
and 15% Triton X-100) for 5 days (the solution was changed every day), soaked in PBS for 1 day, and then immersed in reagent 2 (10% 2,20,2@-nitrilotriethanol, 25% urea, 50% sucrose,
and 0.1% Triton X-100) for 4 days. For nuclear staining, 5μg/mL DAPI was added to each
reagent. As a control, tissues were immersed in PBS for 1 day.
CLSM
WD: 0.21 mm), long distance 40× water-immersion lens (C Apochromat, NA: 1.10; WD: 0.62 mm), and 63× oil-immersion lens (Plan-Apochromat, NA: 1.4; WD: 0.19 mm). Z-intervals for these lenses were set to 2.118, 0.600, 0.800, and 0.366μm, respectively.
Luciferase assay
To detect firefly luciferase activities, the tissues were washed twice with saline and homoge-nized in lysis buffer consisting of 0.1 M Tris-HCl (pH 7.8) containing 0.05% Triton X-100 and 2 mM EDTA. The volume of lysis buffer added was 4μL/mg of tissue. The homogenates were
centrifuged at 15,000 ×gfor 5 min. Twenty microliters of supernatant were then mixed with 100μL of luciferase assay substrates (PicaGene1, Toyo Ink Mfg. Co., Ltd., Tokyo). The light
produced was measured immediately using a luminometer (MiniLumat LB 9506; Berthold Technologies, Bad Wildbad, Germany). Luciferase activities were indicated as the relative light units (RLU) per gram of tissue.
Photostability assay
To check the photostabilities of ZsGreen1 and tdTomato, the tissues were washed twice with saline and homogenized in PBS (4μL/mg of tissue). The homogenates were centrifuged at
15,000 ×gfor 5 min, and then the supernatants were mixed with equal volumes of 4% parafor-maldehyde in PBS. At 2 hours after fixation, residual paraforparafor-maldehyde was removed by pass-ing through a PD-10 desaltpass-ing column (GE Healthcare Bio-sciences Corp, Piscataway, NJ, USA). Fifty microliters of the sample were mixed with 2 mL PBS or CUBIC reagent 2. Changes in the fluorescent intensities of ZsGreen1 (emission 510 nm) and tdTomato (emission 570 nm) in PBS or CUBIC reagent 2 by consecutive irradiation of the excitation light (488 or 543 nm, respectively) were monitored using a spectrofluorophotometer (RF-1500, Shimadzu Corp., Kyoto, Japan).
Results
Comparison of clearing methods
To determine an optimal method for three-dimensional imaging of whole tissue, we compared the observable depths using ClearT2, SeeDB, and CUBIC protocols. Because transgene expres-sion in the liver is the highest among all tissues after hydrodynamic injection, the liver was cho-sen for comparisons. To increase the cho-sensitivity in deep regions, the master gain of the
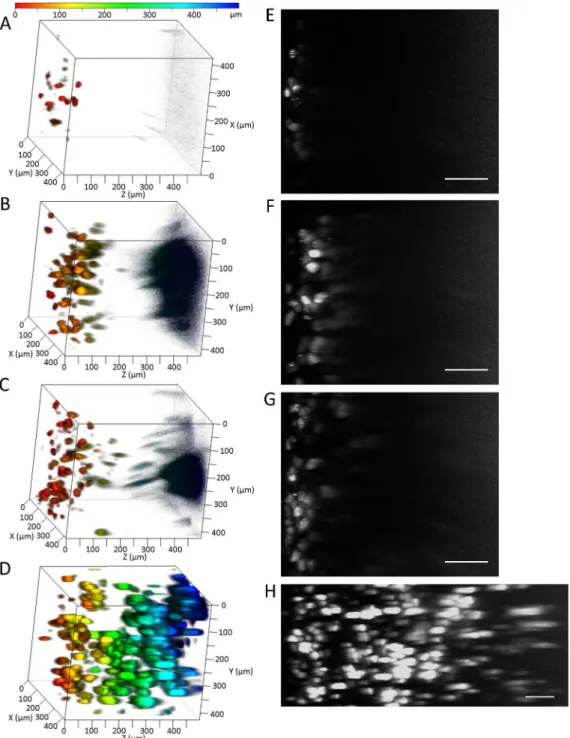
photomultiplier tube in CLSM was adjusted linearly. Among the clearing methods, CUBIC was optimal for deep imaging of ZsGreen1 transgene expression in the liver (Fig 1). The results of CLSM were consistent with those of transmitted images of the liver (i.e. the liver immersed in CUBIC reagents was the most transparent) (Fig 2). Because the master gains were near maxi-mal at a depth of 500μm using PBS, ClearT2, and SeeDB, we observed extensive noise in deep
regions. In contrast, the master gains using CUBIC at depths of 500μm and 1 mm were about
67% and 93%, respectively. The observable depths without sectioning the liver were approxi-mately 70, 200, 240, and 1000μm using PBS, ClearT2, SeeDB, and CUBIC, respectively.
Pro-longing the immersion times of ClearT2and SeeDB did not improve transparencies (Figure A inS1 File) or observable depths (Figure B inS1 File).
Comparison of fluorescent proteins
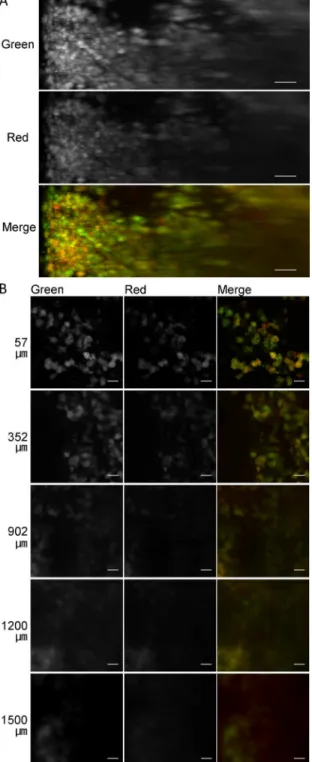
master gains but also the laser outputs were linearly adjusted in the next experiment (Fig 3). After simultaneous hydrodynamic injection of two plasmid DNAs encoding ZsGreen1 and tdTomato, both ZsGreen1 and tdTomato were successfully visualized in deep regions (Fig 3A) and mostly expressed in the same cells (Fig 3B). Increasing the laser output improved the observable depth of ZsGreen1 (1500μm). The observable depth of tdTomato (1200μm) was
Fig 1. Comparison of tissue clearing methods.(A, E) PBS, (B, F) ClearT2, (C, G) SeeDB, and (D, H) CUBIC. ZsGreen1 expression in the liver was detected by CLSM. (A–D) Depth coding. The color chart indicates depth on the Z-axis. (E–H) Maximum intensity projection (X–Z plane). Scale bar: 100μm.
Acquisition conditions: lens, 20× dry; laser, 488 nm; output, 5%; emission, 492–540 nm; master gain, (A, E) 432–1200, (B, F) 433–1129, (C, G) 405–1129,
and (D, H) 492–1115.
slightly lower than that of ZsGreen1. In addition, ZsGreen1 was more photostable than tdTo-mato in CUBIC reagent 2 (Figure C inS1 File). When plasmid DNA encoding tdTomato was hydrodynamically injected into mice, a small amount of fluorescence was observed in the green channel with 488 nm laser excitation (Figure D inS1 File). Thus, ZsGreen1 was more suitable for deep imaging than tdTomato. Subsequently, we used ZsGreen1 as the transgene for the following experiments.
Three-dimensional observations of transgene expression in various
tissues
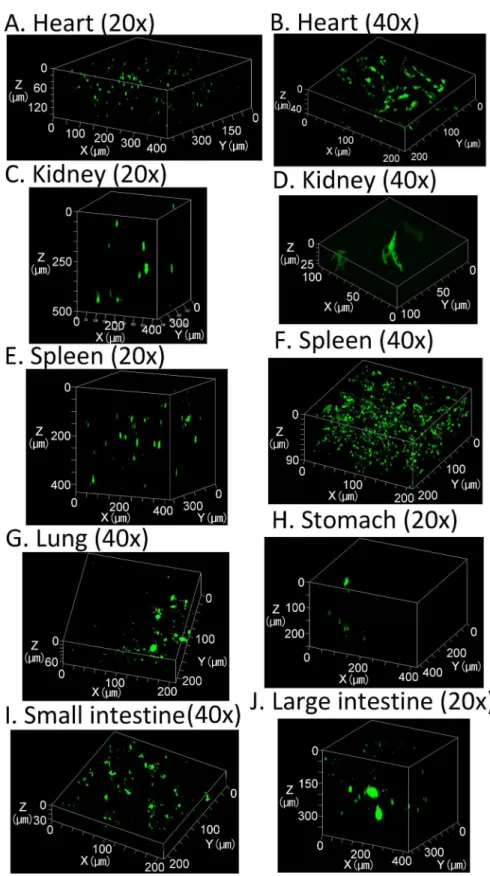
While the highest transgene expression is observed in the liver, about 4–6 orders of magnitude lower transgene expression can also be detected in other tissues including the heart, kidney, spleen, lung, stomach, and the small and large intestines (Figure E inS1 File). Thus, we evalu-ated transgene expression in other tissues to test the efficiency of CUBIC for three-dimensional observations of transgene expression. Transmitted images showed that other tissues also become transparent following CUBIC treatment (Fig 4). In particular, the stomach, and small and large intestines were almost colorless. The blood flow in these tissues is relatively low com-pared with that in the liver and kidney. Less blood flow would result in less erythrocytes in the tissues, which contribute to residual color. In terms of transgene expression, although the mas-ter gains for other tissues in CLSM were 1.7–2.2-fold higher than that for the liver, ZsGreen1 expression in other tissues was still detectable (Fig 5).
Intracellular fate of plasmid DNA
The intracellular fate of plasmid DNA, such as nuclear localization, is an important factor to determine transfection efficiency. Here, to test the capability of tissue clearing to reveal the intracellular fate of plasmid DNA, we delivered plasmid DNA to the liver via hydrodynamic injection and observed the cellular localization of plasmid DNA in transgene-positive cells of the liver. The macromolecular marker dextran was co-delivered with the plasmid DNA (Fig 6A). Punctate distribution of dextran might indicate fluid-phase endocytosis. However, both Fig 2. Transmission color images of the liver after tissue clearing.(A) PBS, (B) ClearT2, (C) SeeDB, and (D) CUBIC. Each lattice indicates 4×4 mm.
nuclear plasmid DNA and cytosolic dextran were localized in transgene-positive cells. Next, plasmid DNA encoding ZsGreen1, and TMR- and Cy5-labeled plasmid DNAs were co-deliv-ered to the liver (Fig 6B). In transgene-positive cells, both TMR- and Cy5-labeled plasmid Fig 3. Comparison of the observable depth with fluorescent proteins ZsGreen1 (green) and tdTomato (red) in the liver treated with CUBIC.(A) Maximum intensity projections (X–Z plane). Scale bar: 100μm. (B)
Single plane images at the indicated depth (μm) from the liver surface. Scale bar: 50μm. Acquisition
conditions: lens, 20× dry; laser, 488 nm (output, 1%–12%; emission, 492–540 nm; master gain, 480–766)
and 543 nm (output, 5%–100%; emission, 550–670 nm; master gain, 600–906).
DNAs were co-localized in the nucleus, suggesting that several molecules of plasmid DNA were transferred together. This synchronized cellular distribution of plasmid DNA was consis-tent with the synchronized expression of the two plasmid DNAs encoding ZsGreen1 and tdTo-mato (Fig 3). In addition, we performed deep imaging of plasmid DNA (Figure F inS1 File). Observable depths of Cy5-labeled plasmid DNA were 62, 64 and 200μm using ClearT2, SeeDB
and CUBIC, respectively. Overall, CUBIC was the best tissue clearing method for multicolor deep imaging.
Discussion
In this study, using tissue clearing methods, we achieved consecutive observations of transgene expression in the liver and other tissues without preparation of tissue sections. We compared tissue clearing methods to determine the optimal approach for detection of transgene expres-sion. Among the tested methods, CUBIC was optimal for the observable depth. The maximum depth observed for ZsGreen1 was about 1.5 mm from the liver surface using CLSM with a 20× dry lens (NA: 0.5) (Figs1and3). Although the transgene expression in other tissues was much lower than that in the liver, it was also possible to observe ZsGreen1 expression in other tissues Fig 4. Transmission color images of each tissue treated with CUBIC.Each lattice indicates 4×4 mm.
Fig 5. Observations of ZsGreen1 expression in various tissues treated with CUBIC.Three-dimensional maximum intensity projection. Acquisition conditions: lens, 20× dry (A, C, E, H, and J) or 40× oil-immersion (B, D, F, G, and I); laser, 488 nm; output, 5%; emission, 493–589 nm; master gain, (A) 951–1130, (B) 1081–
1110, (C) 887–1152, (D) 732, (E) 823–977, (F) 732, (G) 1081–1110, (H) 1081–1110, (I) 1081–1110, and (J)
978–1146.
(Fig 5). It is thought that the observable depth is dependent on the NA, magnification, WD, and transgene expression level. Certain approaches can be employed to improve the observable depth, such as using a higher performance lens and/or two-photon excitation microscopy. Importantly, CUBIC could determine the distribution of not only the transgene expression but also fluorescently labeled plasmid DNA. From this viewpoint, we succeeded in simultaneous observation of nuclei, transgene expression, the macromolecular marker dextran, and plasmid DNA in deep regions using the multicolor setting (Fig 6and Figure F inS1 File).
Zhu et al. [9] have described the mechanisms of tissue clearing methods in detail. Reflective indices and light scattering in tissues are major factors. High light scattering due to lipids and extracellular matrices such as collagen fibers can be reduced by adjustment of reflective indices. Fig 6. Intracellular fate of plasmid DNA in transgene expression-positive cells of the liver treated with CUBIC after hydrodynamic injection.Three-dimensional maximum intensity projections and enlarged planes. Scale bar: 5μm. Nuclei (blue), ZsGreen1 (cyan), Cy5-plasmid DNA (red), (A) TMR-dextran (green),
and (B) TMR-plasmid DNA (green). Acquisition conditions: (A) lens, 63× oil-immersion; laser, 405 nm (output, 12.5%; emission, 425–460 nm; master gain, 781–862), 488 nm (output, 0.5%; emission, 503–533 nm; master
gain, 580), 543 nm (output, 3.0%; emission, 548–627 nm; master gain, 1153) and 633 nm (output, 4.0%;
emission, 639–748 nm; master gain, 1150); (B) lens, 63× oil-immersion; laser, 405 nm (output, 12.5%;
emission, 414–480 nm; master gain, 752–815), 488 nm (output, 0.4%; emission, 525–531 nm; master gain,
525–531), 543 nm (output, 5.0%; emission, 585–647 nm; master gain, 1150), and 633 nm (output, 4.0%;
emission, 639–690 nm; master gain, 1132).
Dehydration during tissue clearing is also an important factor. Among the tissue clearing methods, CUBIC [12,13] uses a detergent, whereas ClearT2[10] and SeeDB [11] do not. Thus, ClearT2and SeeDB are compatible with blood vessel staining using carbocyanine dyes such as 1,1'-dioctadecyl-3,3,3'3'-tetramethylindocarbocyanine perchlorate. However, the performance of ClearT2and SeeDB was insufficient, probably because of autofluorescence. Heme from resid-ual erythrocytes in tissues largely contributes to color and autofluorescence. Aminoalcohols in CUBIC can remove heme from hemoglobin and successfully decolorize various tissues [13]. The decolorization efficiency of CUBIC might be different among tissues, mainly because of residual erythrocytes. Not only hemoglobin in erythrocytes but also other proteins including myoglobin and cytochrome P450 contain heme. In terms of the immersion time for tissue clearing, CUBIC requires a longer time than ClearT2and SeeDB. Although heme could not be sufficiently removed at 1 day after immersion in CUBIC reagent 1, the transmission images indicated that CUBIC reagent 1 already cleared the liver more effectively than ClearT2and SeeDB (Figure A inS1 File). In addition, prolonging the immersion times for ClearT2and SeeDB had negligible effects on the observable depths(Figure B inS1 File). CLARITY can effectively clear the brain by removing lipids during electrophoresis [14]. However, specialized equipment is required for electrophoresis. Thus, we recommend CUBIC for observation of transgene expression in multiple tissues.
The observable depth was highly dependent on not only the tissue clearing method but also the microscope objective lens. A long distance type of high magnification lens enabled us to perform deep imaging of the intracellular fate of plasmid DNA. However, even using CUBIC, the observable depth of Cy5-labeled plasmid DNA (200μm) was lower than that of ZsGreen1
and DAPI (at least 500μm) (Figure F inS1 File). This result was probably due to the density
of fluorochromes because signals from relatively large clusters of plasmid DNA were detectable at a depth of 500μm from the surface. We considered that a depth of 200μm would be
suffi-cient to image thein vivointracellular fate of plasmid DNA.
Among the types of fluorescent proteins, we tested two bright fluorescent proteins, ZsGreen1 and tdTomato. The relative quantum yields and extinction coefficients are 0.91 and 43,000 M-1cm-1for ZsGreen1 and 0.69 and 138,000 M-1cm-1for tdTomato, respectively. Thus, the brightness of tdTomato is 2.4-fold higher than that of ZsGreen1. However, in terms of the observable depth, ZsGreen1 was better than tdTomato. The half-lives of ZsGreen1 and tdTo-mato are sufficiently long [17,18]. Thus, any differences would not be due to the amount of fluorescent proteins. The reason is still unclear, but major possibilities are laser output and mis-match in the excitation wavelength. One-hundred percent output of a 543 nm laser is equal to 3.3% output of a 488 nm laser. The excitation maximum of tdTomato (555 nm) is somewhat far from the laser excitation wavelength (543 nm), whereas that of ZsGreen1 (492 nm) is close to the laser excitation wavelength (488 nm). Photostability of ZsGreen1 was higher than that of tdTomato (Figure C inS1 File). In addition, fluorescent crosstalk of tdTomato in the green channel was not negligible (Figure D inS1 File). Taken together, ZsGreen1 might be more suitable for evaluating the spatial distribution of transgene expression than tdTomato, espe-cially in multicolor settings.
It has been reported that positron emission tomography (PET) can be applied to imaging the spatial distribution of transgene expression [21]. Using PET, living subjects are observable. However, PET imaging and CLSM have resolutions at tissue and single cell levels, respectively. Thus, tissue clearing methods can determine the spatial distribution of transgene expression at the cellular level. In fact, cell-to-cell variability in transgene expression was obvious (Figs1,3,
PET imaging. For multiple signals, the combination of tissue clearing and CLSM can theoreti-cally determine the type of transgene expression-positive cells by immunofluorescence.
Tissue clearing methods are compatible with mechanistic studies. Here, we analyzed the intracellular fate of plasmid DNA. Transgene expression-positive cells were merged with cyto-solic dextran. It has been reported that hydroporation (i.e. a transient pore created by hydrody-namic injection) is a mechanism of high transfection efficiency [22]. Our results were
consistent with the properties of hydroporation. A different distribution of cytosolic dextran indicated cell-to-cell variability in hydroporation, which might be one of the reasons for the cell-to-cell variability in transgene expression. Furthermore, nuclear membranes are thought to be barriers of transfection. As a mechanism of nuclear importation of plasmid DNA, it has been reported that transcription factors containing nuclear localization signals can deliver plas-mid DNA to the nucleus [23–25].We found that several molecules of plasplas-mid DNA were co-delivered to the nucleus (Fig 6), suggesting complex formation by several molecules of plasmid DNA with biological components such as cytosolic transcription factors and histones. In the case of liposomal vectors, the dissociation of the plasmid DNA from liposomes is a limiting step in transfection [26]. In hydrodynamic injection, naked plasmid DNA is more efficient than liposomal vectors, probably because dissociation is not needed for naked plasmid DNA.
Conclusions
We applied tissue clearing methods to elucidate the spatial distribution of transgene expression and the intracellular fate of plasmid DNA in various murine tissues after hydrodynamic injec-tion, including the liver, heart, kidney, spleen, lung, stomach, and the small and large intestines. Because more information can be obtained simultaneously without tissue sectioning by apply-ing tissue clearapply-ing methods underin vivoconditions, we believe that this method would be use-ful for evaluation of gene delivery systems [27–33]. Therefore, three-dimensional and multi-color imaging methods for determining the spatial distribution of plasmid DNA and transgene expression in murine tissues may provide valuable information for the development of gene delivery systems.
Supporting Information
S1 File. Supporting figures.(DOCX)
Author Contributions
Conceived and designed the experiments: SF SK. Performed the experiments: SF K. Nishimura. Analyzed the data: SF K. Nishimura K. Nishida. Contributed reagents/materials/analysis tools: SF K. Nishimura. Wrote the paper: SF K. Nishida SK.
References
1. Koksharov MI, Ugarova NN. Approaches to engineer stability of beetle luciferases. Comput Struct Bio-technol J. 2012; 2:e201209004. PMID:24688645. doi:10.5936/csbj.201209004
2. Shaner NC, Steinbach PA, Tsien RY. A guide to choosing fluorescent proteins. Nat Methods. 2005; 2 (12):905–9. PMID:16299475.
3. Picconi JL, Muff-Luett MA, Wu D, Bunchman E, Schaefer F, Brophy PD. Kidney-specific expression of GFP by in-utero delivery of pseudotyped adeno-associated virus 9. Mol Ther Methods Clin Dev. 2014; 1:14014. PMID:26015958. doi:10.1038/mtm.2014.14
5. Mütze J, Iyer V, Macklin JJ, Colonell J, Karsh B, Petrášek Z, et al. Excitation spectra and brightness
optimization of two-photon excited probes. Biophys J. 2012; 102(4):934–44. PMID:22385865. doi:10.
1016/j.bpj.2011.12.056
6. Kawakami S, Hashida M. Glycosylation-mediated targeting of carriers. J Control Release. 2014; 190:542–55. PMID:24915504. doi:10.1016/j.jconrel.2014.06.001
7. Kawakami S, Fumoto S, Nishikawa M, Yamashita F, Hashida M. In vivo gene delivery to the liver using novel galactosylated cationic liposomes. Pharm Res. 2000; 17(3):306–13. PMID:10801219.
8. Fumoto S, Nakadori F, Kawakami S, Nishikawa M, Yamashita F, Hashida M. Analysis of hepatic dispo-sition of galactosylated cationic liposome/plasmid DNA complexes in perfused rat liver. Pharm Res. 2003; 20(9):1452–9. PMID:14567641.
9. Zhu D, Larin KV, Luo Q, Tuchin VV. Recent progress in tissue optical clearing. Laser Photon Rev. 2013; 7(5):732–757. PMID:24348874.
10. Kuwajima T, Sitko AA, Bhansali P, Jurgens C, Guido W, Mason C. ClearT: a detergent- and solvent-free clearing method for neuronal and non-neuronal tissue. Development. 2013; 140(6):1364–8. PMID:
23444362. doi:10.1242/dev.091844
11. Ke MT, Fujimoto S, Imai T. SeeDB: a simple and morphology-preserving optical clearing agent for neu-ronal circuit reconstruction. Nat Neurosci. 2013; 16(8):1154–61. PMID:23792946. doi:10.1038/nn.
3447
12. Susaki EA, Tainaka K, Perrin D, Kishino F, Tawara T, Watanabe TM, et al. Whole-brain imaging with single-cell resolution using chemical cocktails and computational analysis. Cell. 2014; 157(3):726–39.
PMID:24746791. doi:10.1016/j.cell.2014.03.042
13. Tainaka K, Kubota SI, Suyama TQ, Susaki EA, Perrin D, Ukai-Tadenuma M, et al. Whole-body imaging with single-cell resolution by tissue decolorization. Cell. 2014; 159(4):911–24. PMID:25417165. doi:
10.1016/j.cell.2014.10.034
14. Chung K, Wallace J, Kim SY, Kalyanasundaram S, Andalman AS, Davidson TJ, et al. Structural and molecular interrogation of intact biological systems. Nature. 2013; 497(7449):332–7. PMID:23575631.
doi:10.1038/nature12107
15. Yang B, Treweek JB, Kulkarni RP, Deverman BE, Chen CK, Lubeck E, et al. Single-cell phenotyping within transparent intact tissue through whole-body clearing. Cell. 2014; 158(4):945–58. PMID:
25088144. doi:10.1016/j.cell.2014.07.017
16. Hama H, Hioki H, Namiki K, Hoshida T, Kurokawa H, Ishidate F, et al. ScaleS: an optical clearing pal-ette for biological imaging. Nat Neurosci. 2015; 18(10):1518–29. PMID:26368944. doi:10.1038/nn.
4107
17. Richards B, Zharkikh L, Hsu F, Dunn C, Kamb A, Teng DH. Stable expression of Anthozoa fluorescent proteins in mammalian cells. Cytometry. 2002; 48(2):106–12. PMID:12116372.
18. Gomme EA, Wirblich C, Addya S, Rall GF, Schnell MJ. Immune clearance of attenuated rabies virus results in neuronal survival with altered gene expression. PLoS Pathog. 2012; 8(10):e1002971. PMID:
23071441. doi:10.1371/journal.ppat.1002971
19. Morris LM, Klanke CA, Lang SA, Lim FY, Crombleholme TM. TdTomato and EGFP identification in his-tological sections: insight and alternatives. Biotech Histochem. 2010; 85(6):379–87. PMID:20109099.
doi:10.3109/10520290903504753
20. Kawakami S, Hirayama R, Shoji K, Kawanami R, Nishida K, Nakashima M, et al. Liver- and lobe-selec-tive gene transfection following the instillation of plasmid DNA to the liver surface in mice. Biochem Bio-phys Res Commun. 2002; 294(1):46–50. PMID:12054738.
21. Richard JC, Factor P, Welch LC, Schuster DP. Imaging the spatial distribution of transgene expression in the lungs with positron emission tomography. Gene Ther. 2003; 10(25):2074–80. PMID:14595380.
22. Zhang G, Gao X, Song YK, Vollmer R, Stolz DB, Gasiorowski JZ, et al. Hydroporation as the mecha-nism of hydrodynamic delivery. Gene Ther. 2004; 11(8):675–82. PMID:14724673.
23. Wilson GL, Dean BS, Wang G, Dean DA. Nuclear import of plasmid DNA in digitonin-permeabilized cells requires both cytoplasmic factors and specific DNA sequences. J Biol Chem. 1999; 274 (31):22025–32. PMID:10419528.
24. Dean DA, Dean BS, Muller S, Smith LC. Sequence requirements for plasmid nuclear import. Exp Cell Res. 1999; 253(2):713–22. PMID:10585295.
25. Vacik J, Dean BS, Zimmer WE, Dean DA. Cell-specific nuclear import of plasmid DNA. Gene Ther. 1999; 6(6):1006–14. PMID:10455402.
27. Hu Y, Haynes MT, Wang Y, Liu F, Huang L. A highly efficient synthetic vector: nonhydrodynamic deliv-ery of DNA to hepatocyte nuclei in vivo. ACS Nano. 2013; 7(6):5376–84. PMID:23647441. doi:10.
1021/nn4012384
28. Tamaru M, Akita H, Nakatani T, Kajimoto K, Sato Y, Hatakeyama H, et al. Application of apolipoprotein E-modified liposomal nanoparticles as a carrier for delivering DNA and nucleic acid in the brain. Int J Nanomedicine. 2014; 9:4267–76. PMID:25228805. doi:10.2147/IJN.S65402
29. Nomoto T, Fukushima S, Kumagai M, Machitani K, Arnida, Matsumoto Y, et al. Three-layered polyplex micelle as a multifunctional nanocarrier platform for light-induced systemic gene transfer. Nat Commun. 2014; 5:3545. PMID:24694458. doi:10.1038/ncomms4545
30. Fumoto S, Nakajima S, Mine T, Yoshikawa N, Kitahara T, Sasaki H, et al. Efficient in vivo gene transfer by intraperitoneal injection of plasmid DNA and calcium carbonate microflowers in mice. Mol Pharm. 2012; 9(7):1962–70. PMID:22670625. doi:10.1021/mp2006592
31. Shimizu K, Kawakami S, Hayashi K, Kinoshita H, Kuwahara K, Nakao K, et al. In vivo site-specific transfection of naked plasmid DNA and siRNAs in mice by using a tissue suction device. PLoS One. 2012; 7(7):e41319. PMID:22844458. doi:10.1371/journal.pone.0041319
32. Un K, Kawakami S, Suzuki R, Maruyama K, Yamashita F, Hashida M. Development of an ultrasound-responsive and mannose-modified gene carrier for DNA vaccine therapy. Biomaterials. 2010; 31 (30):7813–26. PMID:20656348. doi:10.1016/j.biomaterials.2010.06.058