American Journal of Environmental Sciences 4 (1):13-21, 2008 ISSN 1553-345X
© 2008 Science Publications
Corresponding Author: Sultan M.S. Al-Salem, Petrochemical Processes Program Element, Petroleum Research and Studies Center, Kuwait Institute for Scientific Research, P.O.Box 24885, Safat 13109, The State of Kuwait, Tel: +965-9677200
Primary Pollutants Monitoring and Modeling Using Chemical Mass Balance (CMB)
Around Fahaheel Residential Area
1S. M. Al-Salem, 2A.A. Al-Haddad and 3A.R. Khan
1Petrochemical Processes Program Element, Petroleum Research and Studies Center
Kuwait Institute for Scientific Research, P.O. Box 24885, Safat 13109, The State of Kuwait 2Chemical Engineering Department, College of Engineering and Petroleum, Kuwait University
P.O. Box 5969, Safat 13060, The State of Kuwait
3Costal and Air Pollution Department, Environment and Urban Development Division
Kuwait Institute for Scientific Research, P.O. Box 24885, Safat 13109, The State of Kuwait
Abstract: Four major sources of air pollution were identified and modeled using Chemical Mass Balance (CMB) around a residential area. The sources were identified as MAA refinery, downtown area, upstream facilities and main highway road. The sources were analyzed using a series of concentration roses (unfiltered and filtered) executed from the data collected. Data collected included primary and secondary pollutants levels as well as major metrological parameters. The model gave a 91% and 89% match at the receptor point for the identified sources in two different durations. Metrological conditions and chemical fingerprints were adapted into the model to minimize the error and mismatch. Seasonal variation analysis was established by choosing the two months that represent the seasonal distribution in the year. Local and international rules and regulations were cross referenced in order to evaluate the air quality of the area under investigation. A number of violations in terms of ambient levels of primary and secondary pollutants were found and reported in this study.
Key words: Metrological, fingerprints, concentration rose, chemical mass balance
INTRODUCTION
Fahaheel is considered one of five major areas in the state of Kuwait. It is located on the south of the coastal urban development of Kuwait city. The unique location of the area makes it a major point in work commuting and real estate ventures. The overly populated Fahaheel is adjacent to the largest in capacity oil refinery in the state (Mina Al-Ahamdi MAA). All the refineries including MAA refinery are located on the south side of the main Fahaheel shopping area (downtown). Petrochemical Industries, ammonia, urea, polyethylene and polypropylene plants and other private small cottage industries also exist on the south side of the area. Background concentrations are associated with the second largest oil field in the world (The Greater Burgan Field) which on the other hand is located somewhat on the west end of the area[1]. Human related activities summarized in restaurants, sporting establishments, shopping malls, car parking commercial complexes and auto mobile activities all contribute in terms of airborne pollutants to the selected receptor
point of this study. The objective of the current study is to determine the contribution by weight percent of the major air pollution sources around Fahaheel area using CMB modeling. No prior attempts to our knowledge has been executed in this area in the state of Kuwait or any other country with respect to downstream oil related industry air polluting sources.
In many previous studies, CMB model is often used to source encroachment and assessing the contribution of each source to the total pollution load of ambient air. Many researchers in their investigations have used CMB model to identify the predominant sources with respect to wind direction and their impact on to the ambient air quality. An initial study has been focused on this area to determine the total pollution load of the ambient air. Therefore, a proper inventory is an essential point of reference in these matters. A data set of 360 four hourly samples collected at 15 different locations of five different categories was the basis of Anjalis[2] study. These samples were used to source apportionment the area using CMB model. The feature that is unique in this study was dividing the model
Author Manuscrip
sourcing fitted equation into five categories that included residential, commercial, traffic, industrial and petrol dispensing stations in Delhi city, 2001. It was found that the major VOC's contributing source was the diesel combustion engines. Assuming that the sources were unknown and undergoing standard approach of CMB model, Christensen[3] has assessed the air quality in his research. Using a modified least square approach it was discovered that unknown sources affected the air shed in San Joaquin valley.
El-Fadel et al.[4] have determined the effects of industrial emissions and the threat ambient gases like Methane in posing global climate change in the previous decade. An inventory revealed that the industrial sector contributes about 29% to the total greenhouse emissions divided between industrial processes and energy requirements at 12 and 17%, respectively. They proposed the following correlation to estimate the green house effects and emissions:
Qi = A x qi (1)
Where:
Qi = the total process emission of gas i in gigagrams (109 g)
A = the production in tons for industrial processes or in TJ for the energy sector
qi = the emission factor for gas i in gigagrams/ton Jagovkina et al.[5] has developed a 3-D mesoscale tropospheric photochemical transport model of high spatial resolution and used for the assessment of the methane concentration and emissions in the West Siberian region of intensive mining of natural gas and oil deposits. The model was validated against the measurements of concentrations at the surface and in the lower troposphere collected in the year 1993 through 1996. It is well known that the relation between poor air quality and general welfare does exist. Airborne pollutants are associated with health problems such as asthma, cancer and general irritations of the different systems of the human body. Pollutants can cause cancer if classified as a carcinogen agent (e.g.: Benzene). Gennart et al.[6]have summarized the health effects of benzene exposure in his publication. Exposures of working populations to levels above 50 ppm are clearly associated with a significant risk of leukemia. Pollutants like NOx and SO2 are known of having great effects on the respiratory tract infection system of humans and cause all kinds of irritations to the eyes and throat.
MATERIALS AND METHODS
Ambient sampling and software: The data collected in this study included primary pollutants levels in the
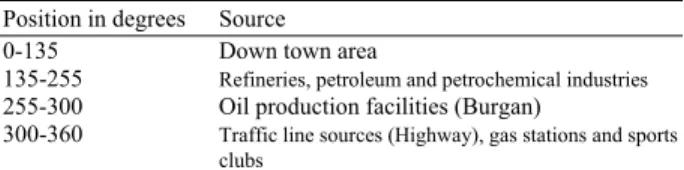
Table 1: Position distribution around outdoor data collection point. Position in degrees Source
0-135 Down town area
135-255 Refineries, petroleum and petrochemical industries
255-300 Oil production facilities (Burgan)
300-360 Traffic line sources (Highway), gas stations and sports clubs
ambient; collected from the central location main health center of Fahaheel from 15 meters height. The ambient air samples were drawn from a fixed probe (Group Tek. Model, 3-5 m, The State of Kuwait; Fixed Photolytic converter, Group Tek. Model, The Stat of Kuwait) located on top of the building and were analyzed by different primary pollutants analyzers (Whatman 41, Air sample Grasbey-Anderson Ltd.) all connected with central online data acquisition system managed and controlled by EnviDAS software. The program transformed the data into Microsoft Office 2003, EXCEL program spreadsheets and stored for consecutive three months raw data. The data were on two different spans; original five minute intervals and hourly average. The pollutants collected included methane (CH4), Benzene (C6H6), NOx, NO2, H2S, NO, O3, Total Reduced Sulfur (TRS) and total solid particulates, PM10. The data collected also included metrological parameters, which were; % relative humidity, ambient temperature, wind speed (m/s) and direction in degrees. The main health center was chosen as a receptor point for being adjacent to the MAA refinery as well as the main highway. This is the central location in Fahaheel area which has all major pollution sources of airborne pollutants around in 5 km circle. On the south side there are residential houses are very close to the refineries and petrochemical industries. In order to execute the source determining step, all potential sources must be referred to the receptor location and respective window of wind direction, influencing the measurements. Table 1 shows the sources with respect to corridor of wind direction. These sources stated are used in the modeling step in order to determine their weight contribution on the receptor point.
Collected Data were plotted and concentration roses using 15o spans of the unfiltered data points were drawn. Filtration procedure was preformed by discarding zero & span check points, source hiccup values. Equation 2 show the OX [1-7] relation used to filter the raw data points for NO and ozone titration. Any value contradicting NO and O3 or NOx and OX were discarded.
OX {[=] = ppb} = O3 + NOx –NO (2) Where:
OX = the concentration of oxides in the ambient in ppb; Methane concentrations points below 1.3 ppm were
Author Manuscrip
discarded due to malfunctioning of the instruments from particulate accumulation, photo oxidation rxn's, choking or OH- ion presence. The average measured values near the sources were considered chemical fingerprints of the sources under investigation. The chemical fingerprints were avarage readings of concetrations recorded on the sources location. The source determining step was performed by drawing the concentration and wind direction for the filtered data and using double axis plotting to relate wind speed and wind direction with the mean values of methane concentration on a 15o interval.
Modeling step: The source allocation was ascertained by analyzing the data points collected and observing the wind directions of peak pollutants concentration values. The high concentrations of primary pollutants emitted from the sources initially thought of being of major concern (Table 1). A Chemical Mass Balance model was used to determine the exact weight contribution of each of the four major sources under investigation. Various major airborne pollutants were present in the current pool of data. As can be seen in the schematic graph of the area (Fig. 1), the Fahaheel highway is a major line source adjacent to the monitoring location, resulting in high levels of certain pollutants (e.g. NOx and CO, non methane hydrocarbon, NMHC) depicting the heavy traffic influence. The downtown area has high concentration methane due to extensive use of bottled gas in fast-food, takeaway etc. and also had a great influence on all other types of pollutants. Based on the initial analysis and measured values of specified pollutants, the CMB model was setup in Microsoft office 2003 for Windows in Excel program. Non methane Hydrocarbons (NMHC), methane, carbon monoxide (CO), total hydrocarbons (HCT) and ozone concentrations were also used in execution of CMB model. The standard approach was applied for apportioning observed pollutant concentrations to their sources. The model implements a least square solution to a set of linear equations, expressing each source as a linear sum product of the source percent contribution with predominant wind sector.
The CMB equations are based on the assumption that the observed ambient quantity of a chemical speicies is the simple sum of the product of pollutants contributions affecting the airshed and fraction of the wind sector. CMB model uses the chemical and physical charactatristics of gases and particulate at a given receptor point to identify the presence of and/or quantify source contributions. Equation 3 is the basic relation corresponding to the selected receptor point.
This equation expresses the relation between the concentrations of the chemical speicies measured at the receptor point (Main health center of Fahaheel) and the chemicals emitted from the source.
∆Ci = Σ Fij – Si (3)
Where:
∆Ci = the difference in concentration of a chemical compound i at the receptor point.
Fij = the fraction of concentration of the species i starting from the source j.
Si = the concentration of pollutant i at the receptor point.
The total wind speed contribution must be calculated in order to get the percent wind speed contribution with respect to the desired range of wind directions; i.e: the source. Equation 4 was used to calculate the wind speed contribution with respect to each source.
%WSi = (ki / K) x 100 (4)
Where:
%WSi = the percent contribution of wind speed with respect to source i.
ki = the summation of wind speed points collected with rescpect to source i in ( m/s).
K = the total summation of wind speed points in (m/s) excluding calm period.
In order to match the concentrations at the receptor point, predefined linear functions were solved with an objective function. The objective function which is defined as the sum of squares of difference between measured and the sum of fractional concentrations of different sources chmical fingerprints including the influence of wind sector, is minimized The chemical fingerprints were average readings of concentrations reflecting the recorded inventories of the sources. Equation 5 is the one set to solve for the least linear square root. The linear function was introduced for the four major sources studied as well as, the recptor point, which represnts the total cummulative concentration of a pollutant to be matched.
m n n
i i i i i i j 1 i 1 i 1
LF C .WS .SC C .WS .SC
= = =
=
∑∑
−∑
(5)Where:
L.F. = the linear function set to match the percent contribution of each source
Ci = the concentration of airborne chemical i at a certain source or receptor point
%WSi = the percent wind speed contribution at a certain wind direction range for source i
%SCi = the percent source contribution for a source I & i represent pollutants and j sources
Author Manuscrip
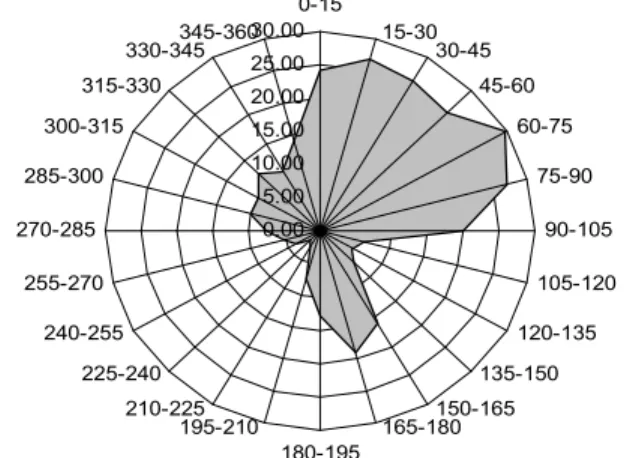
Preliminary analysis: Figure 1 is a 150 concentration rose for the month of July 2004 indicating MAA refinery (1350-2550) as the dominate source; in a blowing from option, pollution source related to the human activities from the housing area. The rose is drawn for methane gas using unfiltered data.
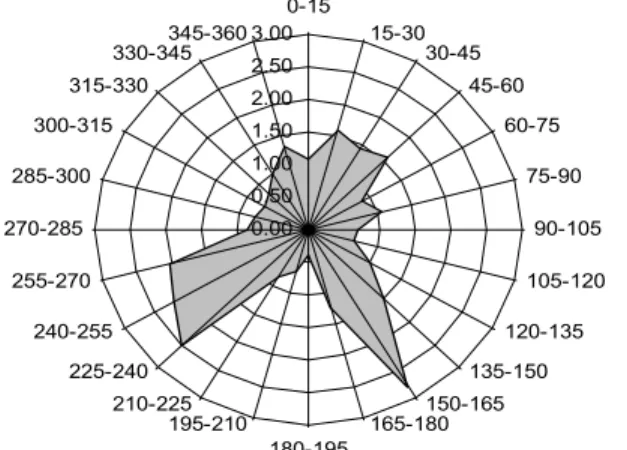
Figures 2 and 3 are concentration roses for SO2 and O3 chosen for the year 2005, for the month of January 2005. SO2 is mainly emitted from the refineries and is clearly showing 105-165 deg. Sector. The other industries as well contribute to the background concentrations of a variety of airborne pollutants. Ozone being the secondary pollutant was also monitored through out the study. The ozone precursor VOCs, NOx and sunlight result into the buildup of ozone concentration in the ambient air. In Fig. 4 the high concentration of ozone is established from the downtown side in a wide span due to the presence of its precursor concentrations and also being secondary pollutant. Cloud covers as well as NOx concentrations are the major influencing parameter for ground level ozone concentrations. Since NO neutralizes ozone as the concentration of NO builds up during combustion processes the concentration of ozone almost diminishes. In the filtration process, as mentioned in the receding sections, the NO concentration has a counter pattern of that of the ozone. This effect is commonly known as the titration effect. The NO is oxidized to NO2 in the presence of oxidizing agent like OH- and ozone. Therefore, ozone concentration is minimum in the presence of strong source of NO but NOx concentration is the true indication of the presence of combustion source. Fig. 4 shows the OX variation plotted against time (hours) for the duration of ten days from the 11th to the 20th of September 2004. It was also noticed that the OX is having similar pattern or response that could be very much similar to O3 pattern. That is explained by the OX having predominant ozone concentration term in its equation. The offset is mainly due to filtration process. The total percent of the filtered data recorded was about 97% which is considered a regular portion of data; i.e.: 3% of data points were discarded.
RESULTS AND DISCUSSION
A series of filtered concentration roses were drawn for the filtered data. The filtered roses gave a better perspective of the sources of air pollution. One can observe clearly the exact contribution of a pollutant in every month. The roses were plotted for duration of a month in a 15 degrees style. The months of July 2004 and January 2005 were focused on in this study. Both these months represent a season in Kuwait. July 2004
1.70 1.80 1.90 2.00 2.10 2.20 2.30
0-15 15-30
30-45 45-60
60-75
75-90
90-105
105-120
120-135
135-150 150-165 165-180 180-195 195-210 210-225 225-240 240-255 255-270 270-285
285-300 300-315
315-330 330-345
345-360
Fig. 1: Unfiltered concentration rose for the month of July 2004, methane gas
0.00 5.00 10.00 15.00 20.00 25.00
0-15 15-30
30-45 45-60
60-75
75-90
90-105
105-120
120-135
135-150 150-165 165-180 180-195 195-210
210-225 225-240 240-255 255-270 270-285
285-300 300-315
315-330 330-345
345-360
Fig. 2: Unfiltered concentration rose for the month of January 2005, SO2
0.00 5.00 10.00 15.00 20.00 25.00 30.00
0-15 15-30
30-45
45-60
60-75
75-90
90-105
105-120
120-135
135-150
150-165 165-180 180-195 195-210
210-225 225-240 240-255 255-270 270-285
285-300 300-315
315-330 330-345
345-360
Fig. 3: Unfiltered concentration rose for the month of January 2005, O3
recorded a variation and enormous activities in the area in terms of primary pollutants so did January 2005. Figure 5 is the rose for benzene in the month of
Author Manuscrip
2/7
0 10 20 30 40 50 60
12:00 AM 4:48 AM 9:36 AM 2:24 PM 7:12 PM 12:00 AM 4:48 AM O3 NO NOx Ox
Fig. 4: Ox relation plotted for the duration of ten days
0.00 20.00 40.00 60.00 80.00
0-15 15-30
30-45
45-60
60-75
75-90
90-105
105-120
120-135
135-150
150-165 165-180 180-195 195-210 210-225 225-240 240-255 255-270 270-285
285-300 300-315
315-330 330-345
345-360
Fig. 5: Filtered concentration rose for the month of December 2004, Benzene (C6H6)
December 2004. The primary source of benzene can be detected as the refinery side which is blowing exactly over the main housing area of Fahaheel through the receptor point. In the following month of January 2005, the source remains effective adding to it the downtown side accounting for the gasoline stations and the two sides of the industrial area (Fig. 6.).
The main difference noticed in the two chosen month that represents the two longest seasons in Kuwait can be seen in the previous roses. NO is present in a major proportion from the MAA side in both months. The main NO source in January 2005 was noticed to be downtown area beside the south side. PM10 is primary coming from the western side in both months. In the case of NOx, the main sources are considered to be the main highway of Fahaheel and the refinery area. Between 255 and 134 degrees it is safe to consider the concentration of NOx is blowing from the highway as can be detected from the previous graphs. arbon monoxide sources are almost equally distrusted around the area. The four major sources emit CO in different proportions, never the less they emit. Figure 7show that in almost all directions there is a trace of CO.
0.00 0.50 1.00 1.50 2.00 2.50 3.00
0-15 15-30
30-45 45-60
60-75
75-90
90-105
105-120
120-135
135-150 150-165 165-180 180-195
195-210 210-225 225-240 240-255 255-270 270-285
285-300 300-315
315-330 330-345
345-360
Fig. 6: Filtered concentration rose for the month of January 2005, Benzene (C6H6)
0.00 0.50 1.00 1.50 2.00
0-15 15-30
30-45
45-60
60-75
75-90
90-105
105-120
120-135
135-150
150-165 165-180 180-195 195-210 210-225 225-240 240-255 255-270 270-285
285-300 300-315
315-330 330-345
345-360
Fig. 7: Filtered concentration rose for the month of March 2005, CO
The CMB model presented the four sources analysis with 91% fit (July 2004) to the total measured concentrations while remaining concentations could be contibuted to the other masillineous sources. The remaining loss can be explained by the small number of unidentified sources that has not been considered due to lack of compositions of their emissions and the influence of the background concentrations. The refinary source gave a total contribution of 70% being in the immediate neighborhood of the receptor and the burgan oil filed being quite far, has the least contribution to the total pollutant load by only 2%. The CMB model devloped in this study was based on the measurements obtained in the month of July 2004, since it recorded variations of many airborne pollutants and had many maximum violations of the concentrations resulting from the sources under study
Author Manuscrip
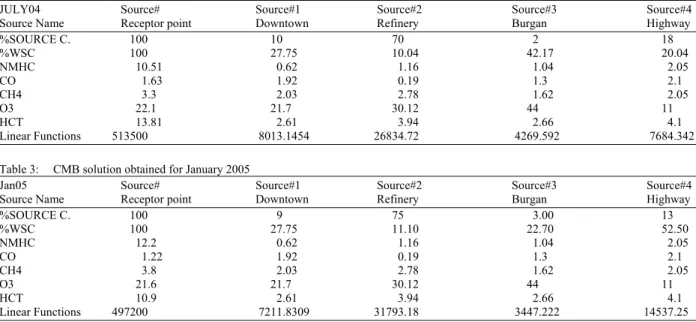
Table 2: CMB solution obtained for July 2004
JULY04 Source# Source#1 Source#2 Source#3 Source#4 Source Name Receptor point Downtown Refinery Burgan Highway
%SOURCE C. 100 10 70 2 18
%WSC 100 27.75 10.04 42.17 20.04
NMHC 10.51 0.62 1.16 1.04 2.05
CO 1.63 1.92 0.19 1.3 2.1
CH4 3.3 2.03 2.78 1.62 2.05
O3 22.1 21.7 30.12 44 11
HCT 13.81 2.61 3.94 2.66 4.1
Linear Functions 513500 8013.1454 26834.72 4269.592 7684.342
Table 3: CMB solution obtained for January 2005
Jan05 Source# Source#1 Source#2 Source#3 Source#4 Source Name Receptor point Downtown Refinery Burgan Highway
%SOURCE C. 100 9 75 3.00 13
%WSC 100 27.75 11.10 22.70 52.50
NMHC 12.2 0.62 1.16 1.04 2.05
CO 1.22 1.92 0.19 1.3 2.1
CH4 3.8 2.03 2.78 1.62 2.05
O3 21.6 21.7 30.12 44 11
HCT 10.9 2.61 3.94 2.66 4.1
Linear Functions 497200 7211.8309 31793.18 3447.222 14537.25
for primary pollutants. January 2005 was chosen to model the winter period in Fahaheel. Table 2 show the set of solutions obtained for the CMB equations with respect to each source studied.
The CMB model devloped in this study was based on the readings gathered in the month of July 2004 and January 2005 since both months recorded variations of many airborne pollutants and had many maximum readings of the concentrations resulting from the sources under study for major pollutants. The solution gave a match of 91% to the total concentrations measured. The 9% miss match or loss can be explained by the small number of sources that has not been considered due to unknown compositions of their emissions and the effect they have on background concentrations. The refinary source gave a total contribution of 70% and the burgan oil filed was the least contributing to the area by only 2%. The Table 2 and 3 show the set of solutions obtained for the CMB equations with respect to each source studied for the month of July 2004 and January 2005. These two months were chosen to represent the two longest seasons in Kuwait; summer and winter for being severe in their weathering conditions.
The solution obtained for Janury 2005, was pointing more to the MAA refinery side. A missmatch of 11% was exsisting for the model. The refinery side gave a total contribution of 75% to the receptor point. Highway, downtown and Burgan gave 13, 9 and 3 percent repectively. The winter times of course as usuall give a better chance for airborne pollutants to
accumulate in the ambient. The relatively slow winds in Kuwait are blowing in the winter times. This make pollutants dispense in a relatively slower fashion.
The objective function of CMB model has represented the four major sources contribution up to 91% match to the receptor point in July 2004. An 11% mismatch (i.e. 89% match) resulted in the January 2005 model. VOC's (Volatile Organic Compounds) are present in the ambient in an large proportion as compare to any European city due to generally oil related activities on oil production, transportation, refining, petrochemical industries, small solvent industries, fuel dispensing and road traffic[8]. The residents in the State of Kuwait have highest number of car per family in the world resulting into unprecedented emissions. The remaining mismatch is due to the other small or large sources that have not been identified and their inventories were not established[8,9]. The concentrations of other pollutants were monitored in a regular fashion every five minutes interval with high precision and was recorded continuously on a data acquisition system. The annual mean concentration of benzene was noticed to increase from the year 2004 (1.2 ppb) to the year 2005 (1.5 ppb). Toluene doubled in the period of study, from 1.5 ppb to 3 ppb. Xylenes had an annual mean of 0.4 ppb in the year 2004 increased to a mean value of 2.4 ppb in the year 2005. The main source of these compounds is known to be the oil refineries and petrochemical industries in the vicinity of this residential area[10,11]. Oil production, from oil wells to booster stations, gathering centers
Author Manuscrip
operations (desalting, dehydration, sweetening etc) results into pit fire and flares to dispose accumulation of heavy hydrocarbon waste. These all activities provide background high concentration of non-methane hydrocarbons. Other PAH's (Polycyclic Aromatic Hydrocarbons) were noticed to be increasing in the ambient due to the above-mentioned reasons. Another undesirable pollutant found in the ambient air was Chlorine (Cl2). The alarming threat these chemicals pose to the human health especially after the doubling of the annual mean (2004 was 0.1 ppm and in 2005 the annual mean was calculated to be 0.21 ppm). Chlorine is produced in salt and chlorine plant and is extensively used in desalination and water distribution system. Chlorine has extensive use in inoculation of tertiary treated wastewater from all wastewater treatment plants. There is also extensive application of chlorine and chlorine products in domestic clean and inoculation. Leukemia and lung cancer and other diseases concerning respiratory organs are direct result of exposure to such pollutants. Hydrogen Sulfide (H2S) had a similar trend in the study period. The annual mean was calculated to be 2.1 ppb in 2004 and 5.2 ppb in the following year. The overbearing influence of petroleum refineries and petrochemical industries are due to aging refining units those are either being phased out or upgraded. The phase out of the oldest refinery in the state of Kuwait demands extra working conditions from the one under investigation in this study. Never the less, the H2S is emitted from many sources from the south side of Fahaheel. Gas plant, sweetening process, sulphur recovery plants (mainly in Shuiabah industrial area) and all the hydro-desuphurization units in refineries are the main contributors of sulphur compounds in the ambient air.
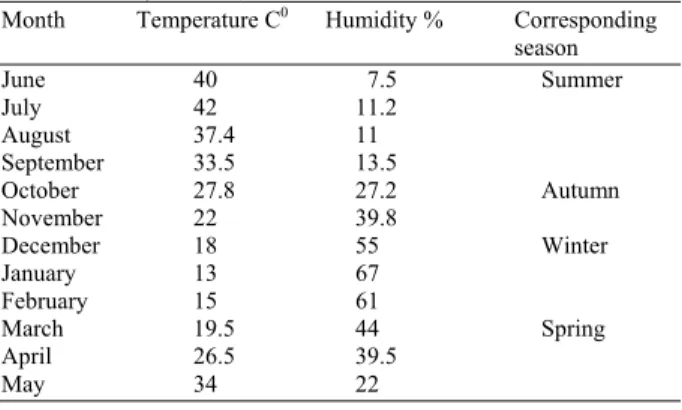
The trends and annual means concentrations lead to a seasonal analysis of all different continuously monitored pollutants in the area. Kuwait is located at the north eastern corner of Arabian Peninsula and is known for its arid climate. Table 4 shows the year’s seasonal distribution and Table 5 shows the summer of 2004 mean concentrations of some major pollutants measured in the area.
One can notice that the summer of 2004 indicate a rise in almost all of primary pollutants ambient levles. The hourly means recorded and the hourly maximum were compared to KUEPA standards for resedential area. Three major violations were found out during the course of this study. SO2, NO2 and O3 all excedded the limits (Table 5) on hourly maximum basis. The SO2 concentration was almost doubel the standard limit of KUEPA. Table 6 is a sample of KUEPA standards and regulation for resedential area.
Table 4: Seasonal variation of temperature and % relative humidity in the state of Kuwait (Based on mean values obtained in the year 2005)
Month Temperature C0 Humidity % Corresponding
season June 40 7.5 Summer July 42 11.2
August 37.4 11 September 33.5 13.5
October 27.8 27.2 Autumn November 22 39.8
December 18 55 Winter January 13 67
February 15 61
March 19.5 44 Spring April 26.5 39.5
May 34 22
Table 5: 2004 summer mean concnetrations
Pollutant Season mean Hourly Maximum Units
O3 37.37 221 ppb
NO2 39.86 149 ppb
DUST 263.41 36983 µg/m3
CH4 1.92 5.66 ppm
H2S 2.17 59.6 ppb
SO2 4.67 254.9 ppb
NMHC 0.7 8.27 ppm
Table 6: Sample of KUEPA standards for resedential areas in the state of Kuwait
Pollutant Hourly mean (ppb) Daily mean (ppb)
SO2 170 60
H2S 140 30
NO2 100 50
CO 30000 8000
O3 80 -
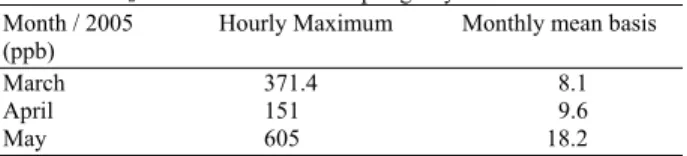
In summer periods, the temeprature reaches 50oC and northerly strong winds results into many dusty events. Dispersion facilitiated by high temperature and strong convective winds and adsorption of different pollutants on to rising dust results into low concentration values in summer. The photo-chemical reaction also had a positive role in degrading many pollutants in the atmosphere and reduce their cocncentrations. In winter the intensity of solar radiation is low resulting into lower temepratures. Winds are not that strong and convective dispersion is insignificant as was the case in summer. H2S had a peak value of 4.1 ppb in the month of October 2004. It was noticed that H2S concnetration increased throughout the year. December 2004 and January 2005 had monthly means of 0.7 and 1.5 ppb respectively. In year 2005, H2S cocentration started incereasing throughout the spring period. Table 7 shows the monthly mean cocentrations of H2S in spring season, 2005.
The trend of Hydrogen Sulfide not only started increasing but more health and maximum levels
Author Manuscrip
Table 7: H2S concentration in the spring of year 2005
Month / 2005 Hourly Maximum Monthly mean basis (ppb)
March 371.4 8.1
April 151 9.6
May 605 18.2
Table 8: SO2 mean monthly values in the first half of the year 2005
Month / 2005 Monthly mean basis (ppb)
January 4.1 February 5.8 March 9.3 April 9 May 17.2 June 11
violations started to appear. The three months of the spring of 2005 had three violations against Fahaheel area, according to KUEPA standards (Table 6).
The trend of ammonia (NH3) is different than other pollutants. The major source is ammonia and urea production and storage facilities in the south in petrochemical industries. Due to hot climate, domestic waste also produces ammonia if not cleared in short times. In urea manufacturing, old prilling process has been replaced by the latest granular process to abate the high emission inventories of ammonia and particulate PM10 (urea particles). Ammonia concentration showed a decreasing trend in the ambient air around Fahaheel. Its peak value of 2004 was in the month of April about 31.2 ppb. The concentration of ammonia varied in the months of May, June July and August has mean values of 26.1, 27, 17.7 and 19.1 ppb respectively due to meteorological conditions. The ammonia concentration increased in winter season in Kuwait due to same reasons for the other pollutants discussed in detail in the receding sections. Ammonia is very stable compound and doesn’t break down in the atmosphere due to photo-oxidation and can persist for longer times. The ambient SO2 monthly mean values are reported in Table 8. The predominant source is discussed in earlier sections, pit fires and flares either oil production or refineries in the neighboring areas of this residential area while road traffic using diesel fuel and power and desalination industries contribute to the background concentration of sulphur dioxide.
The best way of giving a clear view of the total areas air quality is by showing not only the results of the monitoring data, but by also putting the results obtained for both months (July04 and January05) for the CMB model developed in a pie chart showing the exact contribution of the sources surrounding the area.
CONCLUSION
The location of this residential area in the vicinity of major petroleum refineries and petrochemical complex is major point of concern. Primary pollutants concentrations in the ambient air in this area are reported high. Four dominant sources, oil production facilities covering vast areas, petroleum and petrochemical industries, downtown activities and road traffic were used in CMB model to determine their contributions. The Chemical Mass Balance (CMB) model gave a 91% match at the receptor point for these four identified sources in the July 2004 fitted data. The January 2005 model representing winter periods in Kuwait gave a 89% match. Comparing between the two months results in the model, one can notice no significant change in the background concentrations of Burgan oil filed. Oil filed (Burgan) due to its relative far location and spread over vast areas showed the least influence about 2% contributions. The major influencing source was petroleum refineries and petrochemical industries that contributed more than 70% of the total contaminants load in the ambient air. In general all major pollutants are increasing in the areas due to aging industries and increased production. Annual means concentrations values have doubled for most of the pollutants within a year. KUEPA (Kuwait Environment Public Authority) has to get involved to force the regulations and rules for residential area and encourage the local industries to implement mitigation methods to reduce the emissions. Preventive maintenance and the latest technologies should be used to abate these alarming emissions of the neighboring industries. All sorts of emissions (vents, combustion, fugitive, flares etc.) and leaks are key elements in the refining processes that contribute to the deteriorating environmental conditions within the industrial areas and neighboring residential housing. Regular monitoring can indicate the environmental pollution stats in Fahaheel and similar areas in the state of Kuwait.
REFERENCES
1. Al-Salem, M. Sultan and A.R. Khan, 2006. Methane dispersion modeling and source determination around urban areas in Kuwait. Proc. of the 1st Intl. Conf. and Exhibition on Green Industry, Bahrain.
Author Manuscrip
2. Anjali, S., Sengupta and Dutta, 2005. Source apportionment of ambient VOCs in Delhi city. Sci. Total Environ., 343: 207-220.
3. Christensen, W.F., 2004. Chemical mass balance analysis of air quality data when unknown pollution sources are present. Atmosph. Environ., 38: 4305-4317.
4. El-fadel, M., M. Zeinatit, N. Ghaddar and T. Mezher, 1999. Uncertainty in estimating and mitigating industrial related GHC emissions. Energy Policy, 29: 1031.
5. Jagovkina, V., Karol, Zubov, Lagun, Restoklov and Rozantov, 2000. Reconstruction of the methane fluxes from the west Siberia gas fields by the 3-D regional chemical transport model. Atmosph. Environ., 34: 5319.
6. Gennart, J.P., J.T. Sanderson and B.J. Simpson, 1994. Exposure and health risks associated with non-5. occupational sources of benzene. Corp. Source Codes: 108224000, Report No.: CONCAWE-1/94.
7. Al-Salem, M. Sultan and Al-Haddad, Amir A., 2006. Pollutants monitoring and source determining: Effect of oil refineries on a residential area. Proc. of the 2nd Intl. Conf. from Scientific Computing to Computational Engineering.
8. Christensen, W.F. and R.F. Gunst, 2004. Measurement error models in chemical mass balance analysis of air quality data. Atmosph. Environ., 38: 733-744.
9. Samara, C., 2005. Chemical mass balance source apportionment of TSP in a lignite-burning area of Western Macedonia, Greece. Atmosph. Environ., 39: 6430-6443.
10. Al-Salem, S.M. and W.S. Bouhamrah, 2006. Ambient concentrations of benzene and other VOC's at typical industrial sites in Kuwait and their cancer risk assessment. Res. J. Chem. Environ., 10: 42-46.
11. Al-Hajraf, S., D. Al-Ajmi, A. Khan, H. Tang, A. Wahner and D. Klemp, 2005. Air quality assessment of Ali Sabah Al-Salem Urban Community, KISR Report EC031C.