Martinelli, LA.
a*, Pinto, AS.
b, Nardoto, GB.
c, Ometto, JPHB.
d,
Filoso, S.
e, Coletta, LD.
aand Ravagnani, EC.
aaCentro de Energia Nuclear na Agricultura – CENA, Universidade de São Paulo – USP, Av. Centenário, 303, CEP 13416-000, Piracicaba, SP, Brazil
bLaboratório de Ecologia de Ecossistemas, Departamento de Ecologia, Instituto de Ciências Biológicas, Universidade de Brasília – UnB, CP 04457, CEP 70919-970, Campus Universitário Darcy Ribeiro, Brasília, DF, Brazil
cFaculdade UnB Planaltina – FUP, Campus de Planaltina, Universidade de Brasília – UnB, Área Universitária, n. 1, Vila Nossa Senhora de Fátima, CEP 73345-010, Brasília, DF, Brazil
dInternational Geosphere - Biosphere Programme – IGBP, Brazilian Office, Instituto Nacional de Pesquisas Espaciais – INPE, Av. dos Astronautas, 1758, Jardim da Granja, CEP 12227-010, São José dos Campos, SP, Brazil
eChesapeake Biological Lab, University of Maryland Center for Environmental Science – UMCES, 1 Williams St., Solomons, MD 20688, United States of America
*e-mail: [email protected]
Received February 13, 2012 – Accepted April 16, 2012 – Distributed August 31, 2012
(With 5 figures)
Abstract
The main purpose of this study is to perform a nitrogen budget survey for the entire Brazilian Amazon region. The
main inputs of nitrogen to the region are biological nitrogen fixation occurring in tropical forests (7.7 Tg.yr–1), and biological nitrogen fixation in agricultural lands mainly due to the cultivation of a large area with soybean, which is an important nitrogen-fixing crop (1.68 Tg.yr–1). The input due to the use of N fertilizers (0.48 Tg.yr–1) is still incipient compared to the other two inputs mentioned above. The major output flux is the riverine flux, equal to 2.80 Tg.yr–1 and export related to foodstuff, mainly the transport of soybean and beef to other parts of the country. The continuous population growth and high rate of urbanization may pose new threats to the nitrogen cycle of the region through the burning of fossil fuel and dumping of raw domestic sewage in rivers and streams of the region.
Keywords: nitrogen balance, Amazon, biological nitrogen fixation, land use changes, urbanization.
Balanço de massa do nitrogênio na Amazônia Brasileira: uma atualização
Resumo
O principal objetivo deste estudo é realizar um balanço do nitrogênio em toda a Região Amazônica Brasileira. As
principais entradas de nitrogênio na região foram a fixação biológica do nitrogênio que ocorre nas florestas tropicais
(7,7 Tg.ano–1) e a fixação biológica do nitrogênio em terras agrícolas, que ocorre principalmente devido à existência de grandes áreas de cultivo de soja, uma importante cultura de fixação de nitrogênio (1,68 Tg.ano–1). A entrada em
razão do uso de fertilizantes nitrogenados (0,48 Tg.ano–1) ainda é incipiente em comparação com aquelas duas outras entradas mencionadas. Os maiores fluxos de saída foram o fluxo fluvial, que foi igual a 2,80 Tg.ano–1, e a exportação
relacionada aos gêneros alimentícios, principalmente a transferência de soja e carne para outras regiões do País. O
contínuo crescimento populacional e as elevadas taxas de urbanização podem representar novas ameaças sobre o ciclo do nitrogênio da região por meio da queima de combustíveis fósseis e do despejo de esgoto doméstico nos rios
e córregos da região.
1. Introduction
The Amazon basin encompasses an area of approximately
6.3 million km2; if the whole physiographic region is included, the area of the entire biome reaches approximately
7 million km2. The Amazon is recognized as one of the
most important biomes on Earth because it is the home to thousands of animal and vegetal species, and due to the size of it contiguous forest it is an important carbon storage and
also plays a key role in the regulation of world climate.
Globally the nitrogen cycle has been altered by several anthropogenic activities producing reactive nitrogen; among them, the most important are the production of nitrogen fertilizer, the burning of fossil fuel, and the cultivation
of nitrogen-fixing crops. Therefore, there is a clear link between the production of food and energy by humans
and interference in the natural nitrogen cycle.
The Amazon region has been facing a sharp socio-economic transformation since the middle of the 1970s. Among these transformations, rapid replacement of the natural vegetation by agricultural lands has been coupled
with intensification of agriculture, population growth and
rapid urbanization rates. These changes have the ability
to interfere with the nitrogen cycle of the Amazon basin in several ways. For instance, the burning of the forest
transfers nutrients locked in the vegetation to soils and the atmosphere, as is in the case of nitrogen. The most common replacement of the tropical forest is by pasture; in this landscape, as the pasture ages, there is a decrease in
the nitrogen cycle, and with time, these pastures become
an N-impoverished landscape. On the other hand, if a
soybean field replaces pasture, there is the potential of the
landscape to become N-rich again because the capability
of this crop to fix large amounts of nitrogen from the
atmosphere. Besides soybean, other crops, such as rice, are becoming cultivated in the Amazon region and, although the price of N fertilizers is still high in this region, as the transport infrastructure improves in the region, there is the
potential for widespread use of fertilizers. Additionally, as the population grows and urbanization increases, there is a tendency for people to expend more energy by burning
fossil fuel, releasing more nitrogen to the atmosphere.
Therefore, the Amazon region, which is well known for
having N-rich forests especially due to the high nitrogen
fixation occurring in these ecosystems, may also become
rich in reactive nitrogen produced by humans. In an earlier nitrogen mass balance survey carried out in the region,
biological nitrogen fixation by natural vegetation was by
far the most important source of nitrogen to the Amazon
(Filoso et al., 2006). However, although much lower, the biological nitrogen fixation by nitrogen-fixing crops such as soybean, was the second most important N source (Filoso et al., 2006), which raises the following salient questions: How has the rapid and vigorous expansion of
soybean cultivation in the region affected the nitrogen
sources balance in the region? How much did consumption of nitrogen fertilizer increase with agricultural expansion and intensification? What are the consequences of the rapid
population growth and increase in urbanization rates in
the Amazon on the nitrogen cycle?
The main objective of this study is to investigate how land use changes and population growth are affecting the
nitrogen cycle in the Amazon basin.
1.1. Brazilian Legal Amazon – demographic and land cover/use information
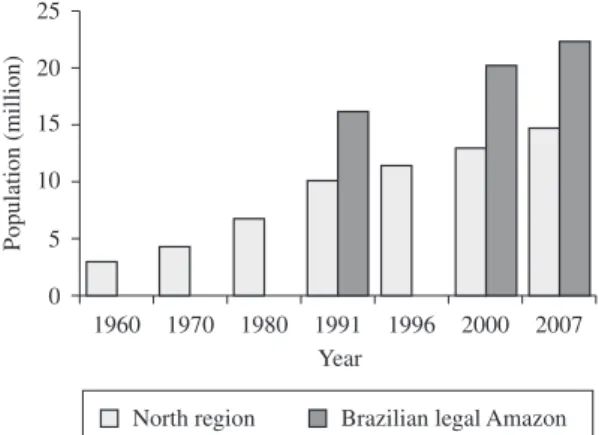
The Brazilian Legal Amazon in 2007 had an estimated
total population of near 23 million people (IBGE, 2007) (Figure 1). This region had an above average population growth in relation to the country, especially in the 1980s and 1990s. This population growth was followed by a
process of urbanization, and today more than 70% of the population lives in large cities such as Belém and Manaus
(Figure 2).
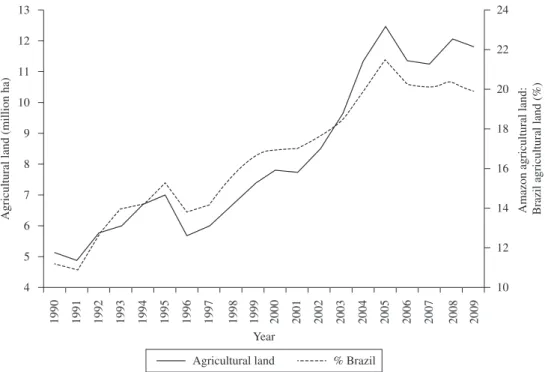
The arable land area of the Amazon region is
approximately 12 million ha, which is equivalent to approximately 20% of the arable land of the country (Figure 3). Soybean, maize and rice are the most important crops in terms of area (Table 1). However, the most
important single land use in the Amazon region is pasture
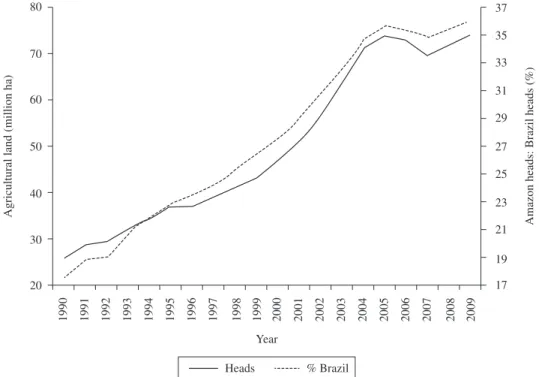
for livestock. In 2009 there were almost 75 million heads of cattle in the Amazon region, which is equivalent to 35% of the entire Brazilian herd (Figure 4). If we consider a
Figure 1. Population growth in the north region of Brazil and in the Brazilian Legal Amazon. Data source: www.
ipeadata.gov.br
stocking rate of one head per hectare, this would yield a pasture area of approximately 75 million ha. However,
this is probably an underestimate because stocking rates in the Amazon are mostly under one head per hectare
(Barreto et al., 2008).
One of the consequences of this land use change was
the removal of tropical forests, replaced mainly by pasture and then by crops. From 1988 to 2010, almost 40 million
ha of forest were lost, resulting in an average deforestation rate of almost 1.8 million ha per year (Figure 5).
2. Material and Methods
2.1. The nitrogen budget
We applied a nitrogen budget for large regions based on several other studies applying the same balance
(Howarth et al., 1996; Boyer et al., 2002; Filoso et al., 2003, 2006). The foundation of the budget is a nitrogen
input-output model.
Net N budget = ΣNINPUTS – ΣNOUTPUT (1)
where ΣNINPUT is the sum of natural and anthropogenic
N inputs (positive sign by definition) and ΣNOUTPUT is the sum of natural and anthropogenic N outputs (negative
sign by definition).
We considered the nitrogen fixed biologically (FFBN) by
natural occurring vegetation formations and by atmospheric electrical discharge (FAEL) as natural N inputs to the region. Both processes transform unreactive atmospheric N2 molecules to reactive nitrogen. On the other hand,
we considered nitrogen from applied fertilizer (FFERT), biologically fixed nitrogen in agriculture (FFBN-A), and import
of foodstuffs (FIMP) as anthropogenic N inputs to the region.
Atmospheric deposition (FATM) also was considered an N
input; however, it is difficult to attribute its origin: whether
it is a natural phenomenon or an enhanced deposition due to anthropogenic activities. We considered the nitrogen that leaves a region via riverine transport (FRIV) and losses
to the atmosphere by denitrification of nitrate (FDESN) as natural N outputs. We considered the export of foodstuff
from a region (FEXP) as anthropogenic outputs. Therefore,
the extended budget could be viewed as follow:
Net N budget = (FFBN + FAEL + FFBN–A+
FFERT + FIMP + FATM) – (FRIV + FDESN + FEXP) (2)
In such an N budget for large regions, it is important to mention that the N content of the soil and natural vegetation
are in a steady state, which means that N gains are equal
Figure 3. Growth of agricultural land (temporary + permanent plots) and the relative contribution of the Brazilian Legal Amazon in relation to the total agricultural land of the country. Source: www.ipeadata.gov.br
Table 1. Area and nitrogen inputs via biological nitrogen
fixation (BNF) and fertilizer consumption for major crops
cultivated in the Amazon.
Crop Area(ha) BNF Fertilizer kg N.ha–1.yr–1
Pasture 74,074,127 15 0
Soybean 6,476,521 170 10
Maize 2,371,381 100
Rice 1,016,483 100
Cassava 654,570 0
Beans 370,775 40 60
Sugarcane 304,873 33 80
to N losses, assuming that soil and vegetation nitrogen
stocks are constant. This assumption should be viewed with caution in such a large and dynamic landscape as the Amazon region (Filoso et al., 2006).
2.2. Data sources
The data source for this study was the same as those used by Filoso et al. (2006) with requisite time updates.
Briefly, we estimated FFBN by multiplying the area of natural vegetation by the rate of BNF provided by Cleveland et al.
(1999). We used the same distinction made by Filoso et al. (2006). For Ultisols and Oxisols covering approximately 70% of the basin, we assumed a nitrogen fixation rate of
15 kg.ha–1.yr–1 and for the remaining 30% that are more fertile soils, we assumed a nitrogen fixation rate of 25 kg.
ha–1.yr–1. We assumed the area of tropical forest in the
Figure 4. Growth of cattle heads and the relative contribution of the Brazilian Legal Amazon in relation to the total heads of the country. Source: www.ipeadata.gov.br
Brazilian Legal Amazon as equal to 3.500 million ha (Carreiras et al., 2006). We estimated the FFBN–A also by
multiplying the area of each fixing crop by the respective
rate of BNF obtained in the literature. We consider
soybean, beans, sugar cane and pasture as fixing crops in the Amazon region. Based on Filoso et al. (2006), we assumed the following fixation rates: 170 kg.ha–1.yr–1 for
soybean, 40 kg.ha–1.yr–1 for beans, 30 kg.ha–1.yr–1 for sugar
cane, and 15 kg.ha–1.yr–1 for pasture (Table 1). The area for each crop was for 2006 and these areas were obtained
from Table 1612 of the Perfil Agrícola Municipal (IBGE,
2009a). We estimated the FFERT by multiplying the area of the most important crops in the Amazon region in terms of area by the average N fertilizer consumption by each crop taken from the literature and also from information
from colleagues who work with each crop (Table 1). The
estimates of FAEL and FATM were assumed to be the same
values estimated by Filoso et al. (2006).
The riverine N output (FRIV) was estimated by multiplying the river discharge measured during nine periods from 1982 to 1984 at Óbidos by the CAMREX project multiplied by
the concentration of dissolved inorganic nitrogen (DIN), dissolved organic nitrogen (DON), and by the concentration of particulate nitrogen (PN) according to the following equation (Lewis et al., 1999):
FRIV = ΣQI* DINI + ΣQI* DONI + ΣQI* PNI (3)
where the subscript i represents each one of the nine
measurements made between 1982 and 1984.
The most problematic terms of equation (2) are the import and export N fluxes due to foodstuff and the N output fluxes due to denitrification. The denitrification
is not measured because it is impossible to estimate in large areas like the Amazon region. The anthropogenic
foodstuff fluxes are relatively easy to estimate in country
level studies. On the other hand, in a region such as the
Amazon, which encompasses several states, this task is more complicated. We propose here to estimate N fluxes related to import/export of foodstuff for certain staple
food items. The main purpose of such estimates is much more related to determining the order of magnitude
of these fluxes in relation to other fluxes of equation (2) than to produce an accurate N-food mass balance. Filoso et al. (2006) estimated that the N export by forest timber from the Amazon region was equal to 0.36 Gg. For comparison, we estimated the N export by beef export from the Amazon region. Barreto et al. (2008) estimated that the Amazon region produced approximately 2.8 million t of beef in 2005, and that 12% of this total was consumed in the Amazon and the rest exported outside the region.
Assuming that the average N content in cattle meat is
6%, we estimated the amount of N exported via beef. We assumed that most soybean produced in the Amazon
is not consumed in the region, but is exported either to
other regions of the country or abroad. We estimated the
amount of N exported via soybean by multiplying the amount of soybean harvested in Amazon municipalities, obtained from the Produção Agrícola Municipal (IBGE,
2009b), by the average content of nitrogen in the soybean assumed to be approximately 5.9% (Figueira, PhD thesis, data not published). Alternatively we also estimated the N exported via soybean by multiplying the N export of
200 kg.ha–1 by the area cultivated with soybean in 2009.
Both estimates produced similar results.
Regarding foodstuff export, using data from the Pesquisa de Orçamentos Familiares 2008-2009 (IBGE,
2009c) it was possible to estimate for the states of the Amazon Region (excluding Maranhão) that only 16% of
the caloric intake of the population is provided by food that is not produced in the region; these are: poultry, pork and
wheat (bread, pasta and flour). Although other important
products such as rice, beans, and cassava are produced in
the region, we do not know whether they are produced in sufficient amounts to support the population of the region. If we assume that this is the case, we can assume
that the food import to the region is negligible compared
to the food export due to the beef and soybean exports. Obviously, this assumption should be viewed with caution
and deserves further investigation.
2.3. Sources of uncertainty
There are several sources of uncertainty when a
nutrient budget survey is conducted in large areas such
as the Amazon region (Howarth et al., 1996; Boyer et al., 2002; Filoso et al., 2006). One of the uncertainties is the lack of accurate data on biological nitrogen fixation in tropical forests (Vitousek et al., 2002). Although
this process is crucial for the nitrogen cycle, especially
in tropical forests, very few estimates are available (Cleveland et al., 1999). The estimates of FFBN–A are based
on crop area and biological nitrogen fixation of the crop.
Although the IBGE and other governmental agencies are doing the best they can to estimate land use changes in Brazil, estimates of crop area based on census and even on remote sensing are subject to several errors. Additionally
there is interannual variability reflecting markets and
climatic conditions that cannot be captured in our budget. There is much more data available on biological nitrogen
fixation of commercial plants like soybean than for forests. However, these estimates varied widely as a function of
cultivars, climate and soil conditions. Therefore, the use of average estimates as used in this study also does not capture the inherent variability that characterizes such a process. This is particularly important regarding to N
fixation in pastures due to the large area that this land cover occupies in the Amazon region. In this case, we arbitrarily assumed, the lower end of the variability in estimates of biological nitrogen fixation due to phosphorus limitation
and overgrazing; and that only half of the pasture area
biological nitrogen fixation is taking place (Filoso et al., 2006). Atmospheric deposition was based on modelling by Filoso et al. (2003). This model was not updated for more recent years. Although we do believe that atmospheric deposition has not changed abruptly in recent years, we want to point out that we do not have the most updated
the same concern raised before also applies to this case. The
amount of fertilizer applied also varies widely depending
on cultivars, soil conditions and economic conditions. This
is especially true in the Amazon region where the cost
of transportation is higher than the rest of Brazil making
the cost of fertilizer even more expensive. The amounts that we use here are the average amounts established for
different crops according to several specialists. We believe
that the doses used in the Amazon region are lower than
this because the higher costs in this region. Additionally, most farmers in Amazonian states seem to use N fertilizer
infrequently (IBGE, 2006). Therefore, our estimates are
probably overestimates.
River N exports were estimated with data collected between 1982-1984 including sampling in nine different
periods. Although there is no reason to believe that these
fluxes have changed, the reality is that these estimates were done approximately thirty years ago and should be
conducted again for an update. Finally, the most problematic
estimates are those related to import and export of foodstuff because of the difficulty in tracking food consumption and food imports and exports for a large region inside a country. Several assumptions were made (described above) in order to have estimates of such fluxes, but as mentioned before, these estimates should be viewed as a preliminary attempt to understand this complex problem.
3. Results and Discussion
The largest input nitrogen flux was the one associated with biological nitrogen fixation occurring in tropical forests
(FFBN). This flux is responsible for approximately half of
the sum of the input and output fluxes (Table 2). The FFBN–A was the second largest input flux and was equivalent to
30% of the FFBN. Soybean was the crop contributing most
to this flux (Table 1). As there was a substantial increase
in soybean area in the region in the last decade, the FFBN–A
estimated in this study was more than two times higher the
FFBN–A estimated by Filoso et al. (2006) who used land use
data of 2000. Probably due to the same cause, there was a significant increase in the FFERT in relation to the estimate
made by Filoso et al. (2006).
It is important to emphasize that biological nitrogen
fixation, either in forests or crops, largely dominated
the N inputs to the regions. Together they contributed
to 67% of the sum of input and output fluxes (Table 2).
Although the arable land area increased vigorously in the last decade, the FFERT is still low compared to N inputs
related to biological nitrogen fixation. In part the FFERT remains relatively low because the most important crop in terms of area in the Amazon region is soybean, which fixes most of the nitrogen required by this crop (Hungria and Vargas, 2000; Alves et al., 2003).
The largest N output flux is FRIV, which is comparable
to FFBN–A (Table 2). The output flux of nitrogen via export of
foodstuff (FEXP), although not complete, was an important
component of output fluxes. According to our estimates, soybean export was by far the most important flux (1.30 Tg N.
yr–1), while N export associated with beef export was a
minor component (0.15 Tg N.yr–1).
The net nitrogen balance (input-output) was positive and equal to 6.01 Tg N.yr–1 (Table 2). The fact that the balance was positive indicates that nitrogen is accumulating in the basin. However, such balance must be viewed with
caution because our balance probably underestimated the FEXP and yet, more importantly did not estimate nitrogen
losses through the denitrification process. Therefore, more attention should be given to inputs and outputs fluxes than
to the balance itself.
The Amazon region is progressively being integrated in the economy of the country and this process has introduced several changes into the region. The nitrogen cycle has also
been affected by these changes, with several effects now
being observed. Although the dominant term of the nitrogen
budget of the Amazon region was the input of new nitrogen through the biological fixation of this element in tropical forests (Table 2), several changes introduced by human
related activities have been noticed in the nitrogen cycle. One of the most important of these changes is the
addition of new nitrogen in the system by the biological fixation on agricultural land especially due to the expansion
of soybean in the region. Soybean occupied almost
6.5 million ha in 2009, which is half of the arable land of the Amazon region (Figure 3). Approximately 85% of the
soybean cultivated in the Amazon region is in the State of Mato Grosso, the most important producer of soybean in the country. More surprising yet is that according to
the IBGE, there was no soybean before 1975 in this state.
In 1975, the IBGE recorded only 350 ha of soybean,
which increased to 1,000 ha in 1977, and then jumped to
70,000 ha in 1980, soaring to 1.5 million ha in 1990, and
then continued to surge from approximately 3.0 million ha
in 2000 to almost 6 million ha in 2009. This vigorous
expansion of soybean area has introduced new nitrogen to the system, growing from near zero in the 1970s up to
Table 2. Input and output nitrogen fluxes and relative contribution in relation to the sum of input and output fluxes.
Inputs Flux (Tg.yr–1) Percent1
FFBN 7.77 52
FAEL 0.26 2
FFBN–A 1.68 15
FFERT 0.48 3
FIMP 0.00 0
FATM 0.07 0
Total inputs 10.26
Outputs
FRIV 2.80 19
FEXP 1.45 10
FDESN Nd
Total outputs 4.25 Net balance 6.01
1Percent estimated in relation to the sum (14.51) of input
1.10 Tg N in 2009, which is equivalent to approximately
65% of the FFBN–A flux in the Amazon.
Inputs from fertilizer use are still incipient in relation
to other fluxes (Table 2), although there was an expressive growth in relation to previous estimates (0.14 Tg.yr–1)
referring to the beginning of the last decade (Filoso et al.,
2006). This low input is partially because N fertilizer is practically not used in soybean, which is the most important
crop of the region. The second most important crops are
maize and rice (Table 1). Maize is produced mainly in the states Mato Grosso, Pará, and Rondônia (IBGE, 2009d), while rice is mainly produced in the states of Mato Grosso, Tocantins, Pará and municipalities of Maranhão, which fall within the Brazilian Legal Amazon (IBGE, 2009b).
The fact that most of the farmers did not use N fertilizer on their land according to the Censo Agropecuário (IBGE,
2006), coupled with the high cost of transportation, suggests
that the increase of FFERT will slowly increase in the region.
Finally, the population growth in the region and the
high degree of urbanization may introduce in the future additional changes in the nitrogen cycle in the region. Urban zones have a disproportional impact on the nutrient cycles
despite the small area they occupy (Nardoto et al., in review).
The fact that most urban transportation relies on vehicles running on fossil fuel increases the emission of several nitrogen compounds to the atmosphere (Nardoto et al.,
in review). Additionally, cities import most of their food from other regions and transform this food into sewage (Nardoto et al., in review). Most of the cities in the Amazon region do not have sewage-treatment systems: of a total
of 760 municipalities, only 99 have such a system (IBGE,
2008). Therefore, most of the sewage is dumped into rivers and streams without any treatment. Although this is not new nitrogen input to the system since it is part of the import-export foodstuff balance, this load of labile nitrogen to water bodies of the region may have several unintended environmental consequences as we have seen in other regions of the country (Daniel et al., 2002).
4. Conclusion
A natural process (biological nitrogen fixation) dominates the inputs of new nitrogen to the Amazon system. Most
of the nitrogen added to the system through this process is happening in tropical forests. Therefore, in addition to many other economic, social and environmental problems caused by deforestation, the continuation of this process may in the future seriously jeopardize the capacity of the
forest to add new reactive N to the system with potential serious consequences for the equilibrium of the region.
Another important and continuously increasing addition
of new N through biological nitrogen fixation is the expansion
of the soybean cultivation area, an anthropogenic input.
The fate of this new added N is virtually unknown up to the present, and consequences of this new addition should
be fully evaluated.
Finally, the continuous population growth in the region coupled with high rates of urbanization poses another
threat to the nitrogen cycle of the region, especially the
cycle of this element in the atmosphere and freshwater.
References
ALVES, BRJ., BODDEY, RM. AND URQUIAGA, S., 2003. The success of BNF in soybean in Brazil. Plant and Soil, vol. 252, p. 1-9. http://dx.doi.org/10.1023/A:1024191913296
BARRETO, P., PEREIRA, R. and ARIMA, E., 2008. A pecuária e o desmatamento na Amazônia na era das mudanças climáticas.
Belém: Instituto do Homem e Meio Ambiente da Amazônia. 40 p.
BOYER, EW., GOODALE, CL., JAWORSK, NA. and
HOWARTH, RW., 2002. Anthropogenic nitrogen sources and relationships to riverine nitrogen export in the northeastern
USA. Biogeochemistry, vol. 57, no. 1, p. 137-169. http://dx.doi. org/10.1023/A:1015709302073
CARREIRAS, JMB., PEREIRA, JMC., CAMPAGNOLO, ML. and
SHIMABUKURO, YE., 2006. Assessing the extent of agriculture/
pasture and secondary succession forest in the Brazilian Legal Amazon using SPOT VEGETATION data. Remote Sensing of Environment, vol. 101, p. 283-298. http://dx.doi.org/10.1016/j.
rse.2005.12.017
CLEVELAND, CC., TOWNSEND, AR., SCHIMEL, DS., FISHER, H., HOWARTH, RW., HEDIN, LO., PERAKIS, SS., LATTY, EF., VON FISCHER, JC., ELSEROAD, A. and WASSON, MF., 1999.
Global patterns of terrestrial biological nitrogen (N2) fixation in
natural ecosystems. Global Biogeochemical Cycles, vol. 13, no. 2, p. 623-645. http://dx.doi.org/10.1029/1999GB900014
DANIEL, MHB., MONTEBELLO, AA., BERNARDES, MC., OMETTO, JPHB., CAMARGO, PB., KRUSCHE, AV.,
BALLESTER, MV., VICTORIA, RL. and MARTINELLI,
LA., 2002. Effects of urban sewage on dissolved oxygen, dissolved
inorganic carbon and organic carbon, and electrical conductivity of small streams along a gradient of urbanization in the Piracicaba River basin. Water, Air, and Soil Pollution, vol. 136, p. 189-206.
http://dx.doi.org/10.1023/A:1015287708170
FILOSO, S., MARTINELLI, LA., HOWARTH, RW., BOYER, E. and DENTENER, F., 2006. Human activities changing the
nitrogen cycle in Brazil. Biogeochemistry, vol. 79, no. 1-2, p. 61-89. FILOSO, S., MARTINELLI, LA., WILLIAMS, MR., LARA,
LB., KRUSCHE, A., BALLESTER, MV., VICTORIA, RL. and CAMARGO, PB., 2003. Land use and nitrogen export in
the Piracicaba River basin, southeast Brazil. Biogeochemistry, vol. 65, no. 3, p. 275-294.
HOWARTH, RW., BILLEN, G., SWANEY, D., TOWNSEND, A., JARWORSKI, N., LAJTHA, K., DOWNING, JA., ELMGREN,
R., CARACO, N., JORDAN, T., BERENDSE, F., FRENEY,
J., KUDEYAROV, V., MURDOCH, P. and ZHU, ZL., 1996. Regional nitrogen budgets and riverine N and P fluxes for the
drainages to the North Atlantic Ocean: Natural and human
influences. Biogeochemistry, vol. 35, no. 1, p. 75-139. http://
dx.doi.org/10.1007/BF02179825
HUNGRIA, M. and VARGAS, MAT., 2000. Environmental
factors affecting N2 fixation in grain legumes in the tropics, with
an emphasis on Brazil. Field Crops Research, vol. 65, p. 151-164.
http://dx.doi.org/10.1016/S0378-4290(99)00084-2
Instituto Brasileiro de Geografia e Estatística - IBGE, 2006. Censo Agropecuário. Table 851. Available from: http://www.sidra.ibge.
-, 2007. Censo Demográfico e Contagem da População. Table 793. Available from: <http://www.sidra.ibge.gov.br/bda/tabela/listabl.
asp?z=cd&o=17&i=P&c=793>.
-, 2008. Pesquisa Nacional de Saneamento Básico de 2008. Table 982. Available from: <http://www.sidra.ibge.gov.br/bda/ tabela/listabl.asp?c=982&z=p&o=20&i=P>.
-, 2009a. Perfil Agrícola Municipal. Table 1612. Available from: <http://www.sidra.ibge.gov.br/bda/tabela/listabl. asp?c=1612&z=p&o=24>.
-, 2009b. Produção Agrícola Municipal. table 1612. Available from: <http://www.sidra.ibge.gov.br/bda/tabela/listabl.
asp?c=1612&z=p&o=24>.
-, 2009c. Pesquisa de Orçamentos Familiares 2008-2009. Table 3036. Available from: <http://www.sidra.ibge.gov.br/bda/
tabela/listabl.asp?z=p&o=16&c=3036>.
-, 2009d. Produção Agrícola Municipal. Table 839. Available from: <http://www.sidra.ibge.gov.br/bda/tabela/listabl.
asp?c=839&z=p&o=24>.
LEWIS, WM., MELACK, JM., McDOWELL, WH., McCLAIN, ME. and RICHEY, JE., 1999. Nitrogen yields from undisturbed watersheds in the Americas. Biogeochemistry, vol. 46. p. 149-162.
NARDOTO, GB., SVIREJEVA-HOPKINS, A., MAHOWALD, N. and MARTINELLI, LA., in review. Urban nitrogen biogeochemistry
for the greater São Paulo metropolitan area. Urban Ecosystems. VITOUSEK, PM., CASSMAN, K., CLEVELAND, C., CREWS,
T., FIELD, CB., GRIMM, NB., HOWARTH, RW., MARINO,
R., MARTINELLI, LA., RASTETTER, EB. and SPRENT,