PD-L1 and Survival in Solid Tumors: A
Meta-Analysis
Pin Wu
1,3☯, Dang Wu
3☯, Lijun Li
4, Ying Chai
1*, Jian Huang
2,3*
1Department of Thoracic Surgery, Second Affiliated Hospital, Zhejiang University School of Medicine, Zhejiang University, Hangzhou, 310009, China,2Department of Surgical Oncology, Second Affiliated Hospital, Zhejiang University School of Medicine, Zhejiang University, Hangzhou, 310009, China,3Cancer Institute (Key Laboratory of Cancer Prevention & Intervention, National Ministry of Education, Provincial Key Laboratory of Molecular Biology in Medical Sciences), Second Affiliated Hospital, Zhejiang University School of Medicine, Zhejiang University, Hangzhou, 310009, China,4Xixi Hospital of Hangzhou, Hangzhou, 310009, China
☯These authors contributed equally to this work.
*[email protected](YC);[email protected](JH)
Abstract
Background
Numerous agents targeting PD-L1/PD-1 check-point are in clinical development. However,
the correlation between PD-L1expression and prognosis of solid tumor is still in
controver-sial. Here, we elicit a systematic review and meta-analysis to investigate the potential value
of PD-L1 in the prognostic prediction in human solid tumors.
Methods
Electronic databases were searched for studies evaluating the expression of PD-L1 and
overall survival (OS) of patients with solid tumors. Odds ratios (ORs) from individual studies
were calculated and pooled by using a random-effect model, and heterogeneity and
publi-cation bias analyses were also performed.
Results
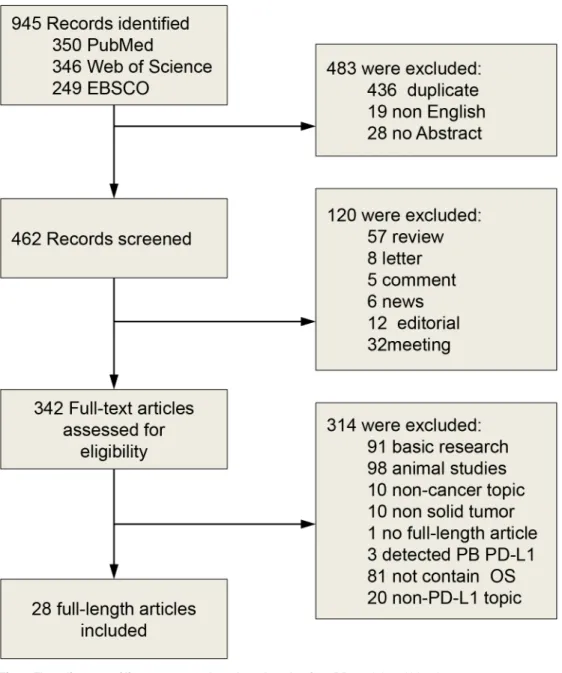
A total of 3107 patients with solid tumor from 28 published studies were included in the
meta-analysis. The median percentage of solid tumors with PD-L1 overexpression was
52.5%. PD-L1 overexpression was associated with worse OS at both 3 years (OR = 2.43,
95% confidence interval (CI) = 1.60 to 3.70, P
<
0.0001) and 5 years (OR = 2.23, 95% CI =
1.40 to 3.55, P = 0.0008) of solid tumors. Among the tumor types, PD-L1 was associated
with worse 3 year-OS of esophageal cancer, gastric cancer, hepatocellular carcinoma, and
urothelial cancer, and 5 year-OS of esophageal cancer, gastric cancer and colorectal
cancer.
Conclusions
These results suggest that expression of PD-L1 is associated with worse survival in solid
tumors. However, the correlations between PD-L1 and prognosis are variant among
a11111
OPEN ACCESS
Citation:Wu P, Wu D, Li L, Chai Y, Huang J (2015) PD-L1 and Survival in Solid Tumors: A Meta-Analysis. PLoS ONE 10(6): e0131403. doi:10.1371/ journal.pone.0131403
Editor:Mohammed Soutto, Vanderbilt University Medical Center, UNITED STATES
Received:April 17, 2015
Accepted:June 1, 2015
Published:June 26, 2015
Copyright:© 2015 Wu et al. This is an open access article distributed under the terms of theCreative Commons Attribution License, which permits unrestricted use, distribution, and reproduction in any medium, provided the original author and source are credited.
Data Availability Statement:All relevant data are within the paper.
Funding:This work was supported by grants from the Science and Technology Department of Zhejiang Province (2011c13034~1, to JH and 2013c03044-7, to YC); and Natural Science Foundation of Zhejiang Province (Z2100366, to JH and LY13H160016, to YC).
different tumor types. More studies are needed to investigate the clinical value of PD-L1
expression in prognostic prediction and treatment option.
Introduction
Co
‑
stimulatory and co
‑
inhibitory receptors play a pivotal role in T cell biology, as they
deter-mine the functional outcome of T cell receptor (TCR) signaling and immune surveillance [
1
].
However, the co-inhibitory mechanisms which are termed check-points elicited from cancer
immunoediting can also facilitate cancer cell to escape from immunosurveillance [
2
]. Despite
the complexity of cancer immunoediting [
3
], growing evidences suggest that the co-inhibitory
receptors, such as cytotoxic T lymphocyte-associated antigen-4 (CTLA-4) and programmed
death 1 (PD-1), play a crucial role in cancer immunoediting, especially in the equilibrium and
escape stages [
4
].
Human programmed death-ligand 1 (PD-L1 or B7-H1), as a dominant ligand, plays a
cen-tral role in antigen-specific T cell response mediating PD-1-dependent immune suppression.
The abnormal expression of these ligands has been linked with prognosis and treatment
response of multiple malignancies. For instance, overexpression of PD-L1 has been observed in
different solid tumors including melanoma [
5
,
6
], colorectal cancer [
7
], lung cancer [
8
–
11
],
pancreatic carcinoma [
12
] and hepatocellular carcinoma [
13
–
15
]. Recently, clinic trials
dem-onstrate that various cancer patients can get survival benefit from immune check-point
tar-geted treatment [
16
].
Despite the clinical development of anti-PD-L1 therapies, the prognostic value of PD-L1
overexpression across different solid tumors is still unclear. Recently, it is reported that
mela-noma patients with PD-L1-expressing cells at the invasive tumor margin and inside tumors are
more sensitive to anti-PD-1 therapy [
17
]. Another two studies showed that across multiple
cancer types, responses were observed in patients with tumors expressing high levels of PD-L1,
especially when PD-L1 expressed on tumor-infiltrating immune cells [
18
,
19
]. The evidence
suggests along with development of PD-L1/PD-1 targeted therapy, some biomarkers are
needed for guiding individualized anti-PD-1 therapy option. It would be desirable to explore
whether PD-L1 overexpression is associated with worse outcome. Moreover, PD-L1
overex-pression may serve as a potential biomarker for prognostic prediction and PD-L1/PD-1
tar-geted treatment option in solid tumors.
Here, we present a meta-analysis evaluating the prognostic value of PD-L1 overexpression
in solid tumor. The purpose of this study was to estimate the correlation of PD-L1
overexpres-sion with survival in solid tumors, thereby shed more light on the development of PD-L1/PD-1
immune check-point targeted therapy and prognostic prediction.
Materials and Methods
This meta-analysis was carried out in accordance with preferred reporting items for systematic
reviews and meta-analyses statement [
20
].
Identification and selection of studies
Pubmed, Web of Science and EBSCO were searched for studies evaluating the expression of
PD-L1 and survival in solid tumors from 2002 to November 2014. The search terms included
“
programmed death-ligand 1
”
or
“
PD-L1
”
or
“
B7-H1
”
or
“
CD274
”
and the name of each
spe-cific solid tumor to recognize additional studies. We identified a total of 350, 346 and 249
entries, respectively. Eligibility criteria were the measurement of PD-L1 by
immunohistochem-istry (IHC), availability of survival data for at least 3 years, and publication in English. Studies
evaluating gene expression of PD-L1 measured by polymerase chain reaction were excluded
from the analyses. Citation lists of retrieved articles were manually screened to ensure
sensitiv-ity of the search strategy. Study selection was based on the association of PD-L1 and survival.
Inter-reviewer agreement was assessed using Cohen
’
s kappa coefficient. Disagreement was
resolved by consensus.
Endpoints of interest
The primary endpoints were overall survival (OS) at 3 and 5 years. Tumors were classified by
PD-L1 expression status using cut-offs as defined by individual studies.
Data collection process
Two authors (Pin Wu and Dang Wu) independently extracted information using predefined
data abstraction forms. The following details were extracted by 2 reviewers (Pin Wu and Dang
Wu): tumor type, number of patients, antibody used for the evaluation, technique used to
quantify PD-L1, and cut-off to determine PD-L1 positivity. Survival data were extracted from
tables or Kaplan
—
Meier curves for both PD-L1 negative or low (control group) and PD-L1
positive or high expression (experimental group).
Data synthesis
The relative frequency of survival at 3 and 5 years between the control and experimental groups
was expressed as an odds ratio (OR) and its 95% confidence interval (CI). A number of
sensi-tivity analyses were prespecified.
Statistical analysis
Data were extracted from the primary publications and analysed using RevMan 5.3 analysis
software (Cochrane Collaboration, Copenhagen, Denmark). Estimates of ORs were weighted
and pooled using the Mantel
—
Haenszel random effect model. Statistical heterogeneity was
assessed using the Cochran
’
s Q and I
2statistics. Differences between subgroups were assessed
using methods as previous described by Deeks et al [
21
]. Sensitivity analyses were carried out
for different analytical methods and cut-offs for defining PD-L1 expression. All statistical tests
were two-sided, and statistical significance was defined as P less than 0.05. No correction was
made for multiple statistical testing.
Results and Discussion
Search results
Description of studies
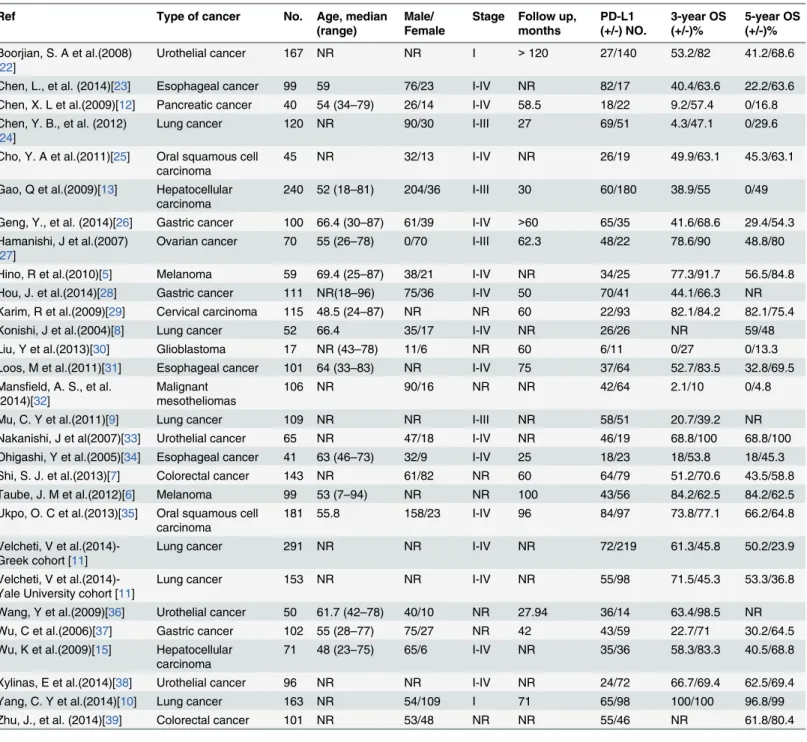
We identified 28 studies using IHC techniques for the assessment of PD-L1 expression.
Char-acteristics of included studies are shown in
Table 1
. Four studies evaluated urothelial cancer,
two evaluated colorectal cancer, three evaluated esophageal cancer, three evaluated gastric
can-cer, three evaluated hepatocellular carcinoma, four evaluated lung cancan-cer, three evaluated
mel-anoma, two evaluated oropharyngeal squamous cell carcinoma, and one each evaluated
cervical cancer, glioblastoma, malignant mesotheliomas, ovarian cancer and pancreatic cancer.
A total of 3107 patients were included in these studies.
Fig 1. Flow diagram of literature search and study selection.PB, peripheral blood.
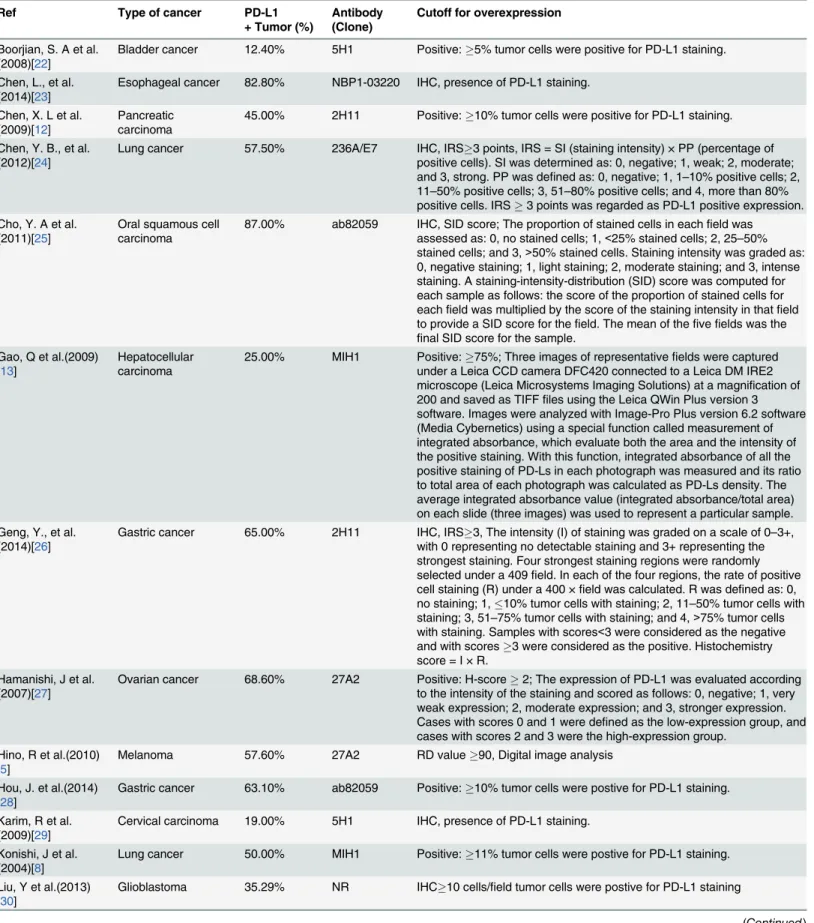
Evaluation and expression of PD-L1
A description of the antibodies used in the included studies is shown in
Table 2
. Various
anti-bodies were used for the evaluation of PD-L1 expression. Seven studies used clone 5H1, five
studies used clone MIH1, four studies used clone 2H11, two studies used clone 27A2 or
ab82059, and one each used clone 236A/E7, NBP1-03220, ab58810 or primary antibody
respectively. Four studies did not report the clone of PD-L1 antibody. The cut-off value for
Table 1. Characteristics of studies included in the meta-analysis.
Ref Type of cancer No. Age, median
(range)
Male/ Female
Stage Follow up, months PD-L1 (+/-) NO. 3-year OS (+/-)% 5-year OS (+/-)%
Boorjian, S. A et al.(2008) [22]
Urothelial cancer 167 NR NR I >120 27/140 53.2/82 41.2/68.6
Chen, L., et al. (2014)[23] Esophageal cancer 99 59 76/23 I-IV NR 82/17 40.4/63.6 22.2/63.6
Chen, X. L et al.(2009)[12] Pancreatic cancer 40 54 (34–79) 26/14 I-IV 58.5 18/22 9.2/57.4 0/16.8 Chen, Y. B., et al. (2012)
[24]
Lung cancer 120 NR 90/30 I-III 27 69/51 4.3/47.1 0/29.6
Cho, Y. A et al.(2011)[25] Oral squamous cell carcinoma
45 NR 32/13 I-IV NR 26/19 49.9/63.1 45.3/63.1
Gao, Q et al.(2009)[13] Hepatocellular carcinoma
240 52 (18–81) 204/36 I-III 30 60/180 38.9/55 0/49
Geng, Y., et al. (2014)[26] Gastric cancer 100 66.4 (30–87) 61/39 I-IV >60 65/35 41.6/68.6 29.4/54.3 Hamanishi, J et al.(2007)
[27]
Ovarian cancer 70 55 (26–78) 0/70 I-III 62.3 48/22 78.6/90 48.8/80
Hino, R et al.(2010)[5] Melanoma 59 69.4 (25–87) 38/21 I-IV NR 34/25 77.3/91.7 56.5/84.8
Hou, J. et al.(2014)[28] Gastric cancer 111 NR(18–96) 75/36 I-IV 50 70/41 44.1/66.3 NR
Karim, R et al.(2009)[29] Cervical carcinoma 115 48.5 (24–87) NR NR 60 22/93 82.1/84.2 82.1/75.4
Konishi, J et al.(2004)[8] Lung cancer 52 66.4 35/17 I-IV NR 26/26 NR 59/48
Liu, Y et al.(2013)[30] Glioblastoma 17 NR (43–78) 11/6 NR 60 6/11 0/27 0/13.3
Loos, M et al.(2011)[31] Esophageal cancer 101 64 (33–83) NR I-IV 75 37/64 52.7/83.5 32.8/69.5 Mansfield, A. S., et al.
(2014)[32]
Malignant mesotheliomas
106 NR 90/16 NR NR 42/64 2.1/10 0/4.8
Mu, C. Y et al.(2011)[9] Lung cancer 109 NR NR I-III NR 58/51 20.7/39.2 NR
Nakanishi, J et al(2007)[33] Urothelial cancer 65 NR 47/18 I-IV NR 46/19 68.8/100 68.8/100
Ohigashi, Y et al.(2005)[34] Esophageal cancer 41 63 (46–73) 32/9 I-IV 25 18/23 18/53.8 18/45.3
Shi, S. J. et al.(2013)[7] Colorectal cancer 143 NR 61/82 NR 60 64/79 51.2/70.6 43.5/58.8
Taube, J. M et al.(2012)[6] Melanoma 99 53 (7–94) NR NR 100 43/56 84.2/62.5 84.2/62.5
Ukpo, O. C et al.(2013)[35] Oral squamous cell carcinoma
181 55.8 158/23 I-IV 96 84/97 73.8/77.1 66.2/64.8
Velcheti, V et al.(2014)-Greek cohort [11]
Lung cancer 291 NR NR I-IV NR 72/219 61.3/45.8 50.2/23.9
Velcheti, V et al.(2014)-Yale University cohort [11]
Lung cancer 153 NR NR I-IV NR 55/98 71.5/45.3 53.3/36.8
Wang, Y et al.(2009)[36] Urothelial cancer 50 61.7 (42–78) 40/10 NR 27.94 36/14 63.4/98.5 NR
Wu, C et al.(2006)[37] Gastric cancer 102 55 (28–77) 75/27 NR 42 43/59 22.7/71 30.2/64.5
Wu, K et al.(2009)[15] Hepatocellular carcinoma
71 48 (23–75) 65/6 I-IV NR 35/36 58.3/83.3 40.5/68.8
Xylinas, E et al.(2014)[38] Urothelial cancer 96 NR NR I-IV NR 24/72 66.7/69.4 62.5/69.4
Yang, C. Y et al.(2014)[10] Lung cancer 163 NR 54/109 I 71 65/98 100/100 96.8/99
Zhu, J., et al. (2014)[39] Colorectal cancer 101 NR 53/48 NR NR 55/46 NR 61.8/80.4
NR: Not reported.
Table 2. Evaluation of human PD-L1 by immunohistochemistry (IHC) in the selected studies.
Ref Type of cancer PD-L1
+ Tumor (%)
Antibody (Clone)
Cutoff for overexpression
Boorjian, S. A et al. (2008)[22]
Bladder cancer 12.40% 5H1 Positive:5% tumor cells were positive for PD-L1 staining.
Chen, L., et al. (2014)[23]
Esophageal cancer 82.80% NBP1-03220 IHC, presence of PD-L1 staining.
Chen, X. L et al. (2009)[12]
Pancreatic carcinoma
45.00% 2H11 Positive:10% tumor cells were positive for PD-L1 staining.
Chen, Y. B., et al. (2012)[24]
Lung cancer 57.50% 236A/E7 IHC, IRS3 points, IRS = SI (staining intensity) × PP (percentage of positive cells). SI was determined as: 0, negative; 1, weak; 2, moderate; and 3, strong. PP was defined as: 0, negative; 1, 1–10% positive cells; 2, 11–50% positive cells; 3, 51–80% positive cells; and 4, more than 80% positive cells. IRS3 points was regarded as PD-L1 positive expression. Cho, Y. A et al.
(2011)[25]
Oral squamous cell carcinoma
87.00% ab82059 IHC, SID score; The proportion of stained cells in eachfield was assessed as: 0, no stained cells; 1,<25% stained cells; 2, 25–50% stained cells; and 3,>50% stained cells. Staining intensity was graded as: 0, negative staining; 1, light staining; 2, moderate staining; and 3, intense staining. A staining-intensity-distribution (SID) score was computed for each sample as follows: the score of the proportion of stained cells for eachfield was multiplied by the score of the staining intensity in thatfield to provide a SID score for thefield. The mean of thefivefields was the
final SID score for the sample. Gao, Q et al.(2009)
[13]
Hepatocellular carcinoma
25.00% MIH1 Positive:75%; Three images of representativefields were captured under a Leica CCD camera DFC420 connected to a Leica DM IRE2 microscope (Leica Microsystems Imaging Solutions) at a magnification of 200 and saved as TIFFfiles using the Leica QWin Plus version 3 software. Images were analyzed with Image-Pro Plus version 6.2 software (Media Cybernetics) using a special function called measurement of integrated absorbance, which evaluate both the area and the intensity of the positive staining. With this function, integrated absorbance of all the positive staining of PD-Ls in each photograph was measured and its ratio to total area of each photograph was calculated as PD-Ls density. The average integrated absorbance value (integrated absorbance/total area) on each slide (three images) was used to represent a particular sample. Geng, Y., et al.
(2014)[26]
Gastric cancer 65.00% 2H11 IHC, IRS3, The intensity (I) of staining was graded on a scale of 0–3+, with 0 representing no detectable staining and 3+ representing the strongest staining. Four strongest staining regions were randomly selected under a 409field. In each of the four regions, the rate of positive cell staining (R) under a 400 ×field was calculated. R was defined as: 0, no staining; 1,10% tumor cells with staining; 2, 11–50% tumor cells with staining; 3, 51–75% tumor cells with staining; and 4,>75% tumor cells with staining. Samples with scores<3 were considered as the negative and with scores3 were considered as the positive. Histochemistry score = I × R.
Hamanishi, J et al. (2007)[27]
Ovarian cancer 68.60% 27A2 Positive: H-score2; The expression of PD-L1 was evaluated according to the intensity of the staining and scored as follows: 0, negative; 1, very weak expression; 2, moderate expression; and 3, stronger expression. Cases with scores 0 and 1 were defined as the low-expression group, and cases with scores 2 and 3 were the high-expression group.
Hino, R et al.(2010) [5]
Melanoma 57.60% 27A2 RD value90, Digital image analysis
Hou, J. et al.(2014) [28]
Gastric cancer 63.10% ab82059 Positive:10% tumor cells were postive for PD-L1 staining.
Karim, R et al. (2009)[29]
Cervical carcinoma 19.00% 5H1 IHC, presence of PD-L1 staining.
Konishi, J et al. (2004)[8]
Lung cancer 50.00% MIH1 Positive:11% tumor cells were postive for PD-L1 staining.
Liu, Y et al.(2013) [30]
Glioblastoma 35.29% NR IHC10 cells/field tumor cells were postive for PD-L1 staining
PD-L1 overexpression depended on the staining score and the method used. Among the group
determined as PD-L1 overexpressed, the median overexpression of PD-L1 staining was 45.4%.
Esophageal cancer, gastric cancer, and oropharyngeal squamous cell carcinoma had the highest
expression of PD-L1, with more than 66.7% of tumors considered overexpression. Levels of
PD-L1 overexpression in urothelial cancer, pancreatic carcinoma, colorectal cancer,
mela-noma, lung cancer, hepatocellular carcimela-noma, esophageal cancer, glioblastoma and cervical
car-cinoma ranged from 19% to 54.3%.
Table 2. (Continued)
Ref Type of cancer PD-L1
+ Tumor (%)
Antibody (Clone)
Cutoff for overexpression
Loos, M et al.(2011) [31]
Esophageal cancer 73.30% NR IHC; H-score4; Scores were given separately for the stained area and for the intensity of staining. Quantification was made as follows: 33% of the cancer cells or less, 1; more than 33% to 66% of the cancer cells, 2; and more than 66% of the cancer cells, 3. Intensity of staining was stated as absent or weak, 1; moderate, 2; and strong, 3. Each section had afinal grade that derived from the multiplication of the area and intensity scores. Mansfield, A. S.,
et al.(2014)[32]
Malignant mesotheliomas
40.00% 5H1 Positive:5% tumor cells were postive for PD-L1 staining.
Mu, C. Y et al. (2011)[9]
Lung cancer 53.21% Primary
antibody
Positive: H-scoremedian value; PD-L1 proteins were quantified using a visual grading system based on the extent of staining (by percentage of positive tumor cells graded on a scale of 0–3: 0 = none, 1 = 1–10%, 2 = 11–50%, 3 = 51–100%) and the intensity of staining (graded on a scale of 0–3: 0 = no staining, 1 = weak staining, 2 = moderate staining, 3 = strong staining). A semi-quantitative H-score was obtained by multiplying the grades of extent and intensity of staining. The median value of all the H-scores was chosen as the cutoff value for dividing the expression of proteins into high and low.
Nakanishi, J et al (2007)[33]
Bladder cancer 70.77% MIH1 Positive:12.2% tumor cells were postive for PD-L1 staining.
Ohigashi, Y et al. (2005)[34]
Esophageal cancer 43.90% MIH1 Positive:10% tumor cells were postive for PD-L1 staining.
Shi, S. J. et al. (2013)[7]
Colorectal cancer 44.80% ab58810 IHC, presence of PD-L1 staining.
Taube, J. M et al. (2012)[6]
Melanoma 38.00% 5H1 Positive:5% tumor cells were postive for PD-L1 staining.
Ukpo, O. C et al. (2013)[35]
Oral squamous cell carcinoma
46.40% 5H1 Positive:5% tumor cells were postive for PD-L1 staining.
Velcheti, V et al. (2014)[11]
Lung cancer 86.00% 5H1 NR
Wang, Y et al. (2009)[36]
Bladder cancer 76.00% NR Positive:>10% tumor cells were postive for PD-L1 staining.
Wu, C et al.(2006) [37]
Gastric cancer 72.00% 2H11 IHC, presence of PD-L1 staining.
Wu, K et al.(2009) [15]
Hepatocellular carcinoma
42.20% MIH1 NR
Xylinas, E et al. (2014)[38]
Bladder cancer 49.30% 5H1 NR
Yang, C. Y et al. (2014)[10]
Lung cancer 25.00% NR IHC5% tumor cells were postive for PD-L1 staining
Zhu, J., et al. (2014) [39]
Colorectal cancer 39.90% 2H11 NR
NR: Not reported.
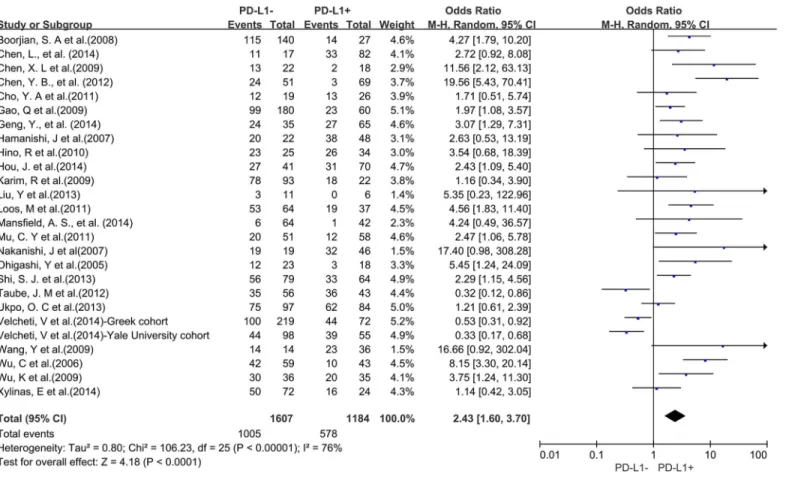
Association of PD-L1 with survival
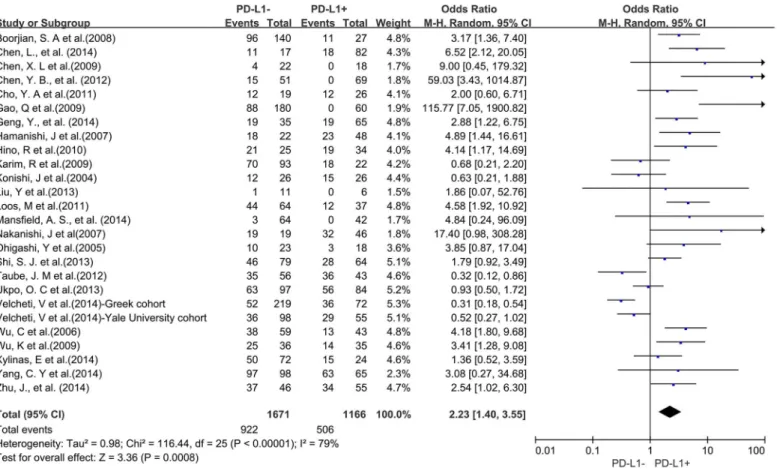
A total of 25 studies reported data for OS at 3-years. Results showed that PD-L1 overexpression
was associated with worse 3-year OS of solid tumors (OR = 2.43, 95% CI = 1.60 to 3.70,
P
<
0.0001) (
Fig 2
). There was significant heterogeneity among studies (Cochran
’
s Q
P
<
0.00001, I
2= 76%), so we conducted subgroup meta-analysis to explore whether the
het-erogeneity is due to different cancer types.
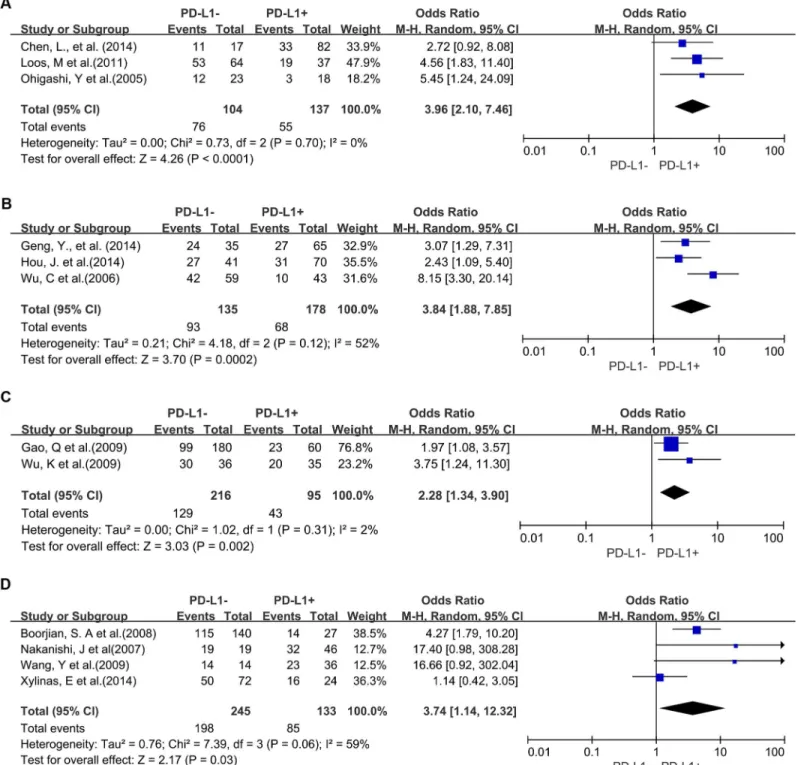
Three studies provided 3-year OS for lung cancer, 2 studies for hepatocellular carcinoma, 2
studies for melanoma, 2 studies for oropharyngeal squamous cell carcinoma, 4 studies for
urothelial cancer, 3 studies for esophageal cancer, and 3 studies for gastric cancer. In the
strati-fied analysis by cancer types, PD-L1 overexpression was associated with worse 3-year OS of
esophageal cancer (OR = 3.96, 95% CI = 2.10 to 7.46, P
<
0.0001) (
Fig 3A
), gastric cancer
(OR = 3.84, 95% CI = 1.88 to 7.85, P = 0.0002) (
Fig 3B
), hepatocellular carcinoma (OR = 2.28,
95% CI = 1.34 to 3.90, P = 0.002) (
Fig 3C
) and urothelial cancer (OR = 3.74, 95% CI = 1.14 to
12.32, P = 0.03) (
Fig 3D
). However, there was no association between PD-L1 overexpression
and 3-year OS of lung cancer (OR = 1.57, 95% CI = 0.38 to 6.48, P = 0.54) (
S1A Fig
), melanoma
(OR = 0.97, 95% CI = 0.09 to 10.14, P = 0.98) (
S1B Fig
) and oropharyngeal squamous cell
carci-noma (OR = 1.32, 95% CI = 0.73 to 2.38, P = 0.36) (
S1C Fig
).
A total of 25 studies reported data for OS at 5-years. Similar to the 3-year OS data, PD-L1
overexpression was significantly associated with worse 5-year OS of solid tumors (OR = 2.23,
95% CI = 1.40 to 3.55, P = 0.0008) (
Fig 4
). There was also high heterogeneity among studies
Fig 2. Forest plot describing the association between PD-L1 expression and 3-year OS of all patients with solid tumors.
(Cochran
’
s Q P
<
0.00001, I
2= 79%), so we conducted subgroup meta-analysis according to
different cancer types.
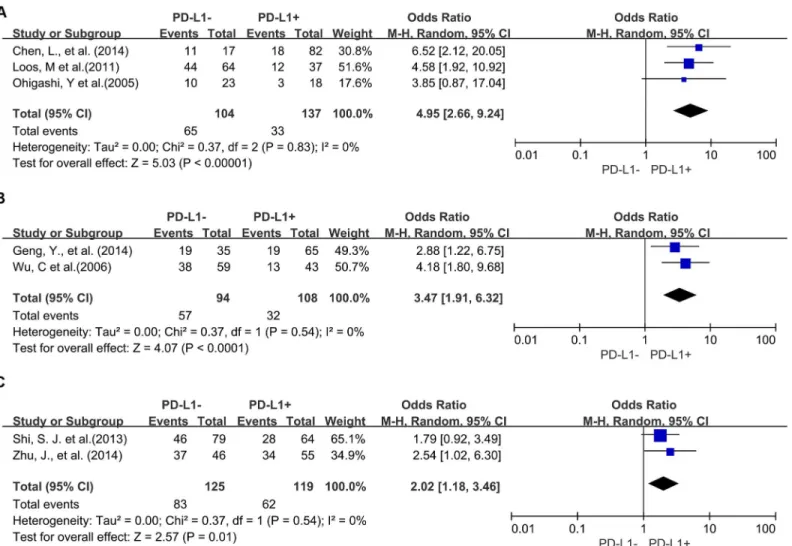
Four studies provided 5-year OS for lung cancer, 3 studies for hepatocellular carcinoma, 2
studies for melanoma, 2 studies for oropharyngeal squamous cell carcinoma, 3 studies for
urothelial cancer, and 3 studies for esophageal cancer. PD-L1 overexpression was associated
Fig 3. Forest plot describing subgroup analysis of the association between PD-L1 expression and 3-year OS of patients with esophageal cancer (A), gastric cancer (B), hepatocellular carcinoma (C) and urothelial cancer (D).
with worse 5-year OS of esophageal cancer (OR = 4.95, 95% CI = 2.66 to 9.24, P
<
0.00001) (
Fig
5A
), gastric cancer (OR = 3.47, 95% CI = 1.91 to 6.32, P
<
0.0001) (
Fig 5B
) and colorectal cancer
(OR = 2.02, 95% CI = 1.18 to 3.46, P = 0.01) (
Fig 5C
). However, there was no significant
associa-tion between PD-L1 overexpression and the 5-year OS of urothelial cancer (OR = 2.61, 95%
CI = 1.00 to 6.85, P = 0.05) (
S2A Fig
), hepatocellular carcinoma (OR = 17.10, 95% CI = 0.19 to
1505.43, P = 0.21) (
S2B Fig
), lung cancer (OR = 0.91, 95% CI = 0.32 to 2.63, P = 0.60) (
S2C Fig
),
melanoma (OR = 1.12, 95% CI = 0.09 to 13.64, P = 0.93) (
S2D Fig
) and oropharyngeal
squa-mous cell carcinoma (OR = 1.13, 95% CI = 0.58 to 2.20, P = 0.71) (
S2E Fig
).
Sensitivity analyses
Removal of studies which did not report the PD-L1 antibody clone did not influence results for
3-year or 5-year OS (OR = 2.26, 95% CI = 1.43 to 3.57; OR = 2.14, 95% CI = 1.31 to 3.51,
respectively). However, removal of the studies that did not report the cut-off value of PD-L1
overexpression increased the association between PD-L1 and worse 3-year and 5-year OS
com-pared with PD-L1 low expression (OR = 2.95, 95% CI = 2.03 to 4.28; OR = 2.70, 95% CI = 1.67
to 4.37, respectively). Exclusion of these studies did not reduce heterogeneity for 5-year OS
(Cochran
’
s Q P = 0.0002, I2 = 60%; Cochran
’
s Q P
<
0.00001, I2 = 68%, respectively).
Discussion
PD-L1 overexpression has been observed in a substantial number of solid tumors. Moreover,
numerous studies have demonstrated that PD-L1 plays a key role in cancer immune escape
Fig 4. Forest plot describing the association between PD-L1 expression and 5-year OS of all patients with solid tumors.
[
40
,
41
]. A decade ago some studies reported that blockade of PD-L1 could improve antitumor
immunity [
42
–
44
]. Recently, several studies show that therapies targeting PD-L1/PD-1 display
clinical responses in patients with multiple cancer types expressing high levels of PD-L1 [
17
–
19
,
45
–
48
]. These leading studies highlight that PD-L1 may serve as a biomarker for prognostic
prediction and PD-L1/PD-1 targeted treatment option in solid tumors. In this study, we
meta-analyzed the published data about the expression of PD-L1 in solid tumors and their
associa-tion with survival for studies that evaluated PD-L1 by IHC.
Results showed that overexpression of PD-L1 was associated with worse 3-year OS for all
studies analyzed except for one study of melanoma and lung cancer, respectively [
6
,
11
].
Stud-ies reporting 5-year OS data demonstrated that overexpression of PD-L1 is associated with
worse outcome except for one study of cervical carcinoma [
29
], melanoma [
6
], oropharyngeal
squamous cell carcinoma [
35
] and two study of lung cancer [
8
,
11
]. Among the tumor types
evaluated, esophageal cancer was the tumor type most linked with worse 3-year and 5-year
out-come for patients with high levels of PD-L1 [
31
,
34
]. Overall, PD-L1 overexpression was
reported to be associated with worse 5-year outcome of patients with digestive tract-derived
tumors such as esophageal cancer [
23
,
31
,
34
], gastric cancer [
26
,
37
] and colorectal cancer [
7
,
Fig 5. Forest plot describing subgroup analysis of the association between PD-L1 expression and 5-year OS of patients with esophageal cancer (A), gastric cancer (B) and colorectal cancer (C).
39
]. In addition, one study on hepatocellular carcinoma showed that PD-L1 expression on
macrophages in tumors was significantly higher than paired normal tissues and correlated with
tumor stage [
14
]. These results suggest that PD-L1 has an important role in the immune escape
and progress of tumors especially digestive tract-derived.
A recent study reported that epithelial-originated cancer patients with positive expression
of PD-L1 on tumor tissues were associated with significantly poorer OS when compared to
those with negative expression of PD-L1 [
49
]. Consistently, our study showed that
overexpres-sion of PD-L1 in the tumor tissues of most epithelial-originated cancer types was associated
with worse 3-year and 5-year OS except for lung cancer, melanoma and oral squamous cell
car-cinoma. However, recent clinic trials showed that patients with melanoma and lung cancer
could acquire clinical benefit from anti-PD-L1 treatment [
47
,
48
]. In our meta-analysis, we
noted that the results of studies using different clone of PD-L1 antibodies were conflicting in
melanoma [
5
,
6
] (
S1A and S1B Fig
) and lung cancer [
10
,
11
] (
S2C Fig
). The difference between
technologies used in studies may partly account for the contradictory results. Further studies
are needed to confirm the impact of antibodies on the results of studies.
Besides, the PD-1 expression state of tumor infiltrating lymphocytes is another key point of
the PD-1/PD-L1-mediated tumor immune escape. A recent study suggests that pre-existing
CD8
+T cells distinctly located at the invasive tumor margin are associated with expression of
the PD-1/PD-L1 immune inhibitory axis and may predict response to therapy [
17
]. Moreover,
another study showed that across multiple cancer types, responses were observed in patients
with tumors expressing high levels of PD-L1, especially when PD-L1 was expressed on
tumor-infiltrating immune cells [
19
]. The evidence implys that further study is needed to clarify the
different prognostic and therapeutic prediction value of both PD-1 and PD-L1 expression on
various cell types in solid tumor tissue.
Conclusions
Our analyses show that overexpression of PD-L1 in solid tumor tissues, as measured by IHC, is
associated with worse prognosis in different tumor types, which suggests that the development
of strategies against the PD-L1/PD-1 axis would be a promising therapeutic approach for solid
tumors. Moreover, further studies are required to investigate the potential role of PD-L1
expres-sion in solid tumors for prognostic prediction as well as PD-L1 targeted treatment deciexpres-sion.
Supporting Information
S1 Fig. Forest plot describing subgroup analysis of the association between PD-L1
expres-sion and 3-year OS of patients with lung cancer (A), melanoma (B) and oropharyngeal
squamous cell carcinoma (C).
(TIF)
S2 Fig. Forest plot describing subgroup analysis of the association between PD-L1
expres-sion and 5-year OS of patients with urothelial cancer (A), hepatocellular carcinoma (B),
lung cancer (C), melanoma (D) and oropharyngeal squamous cell carcinoma (E).
(TIF)
S1 PRISMA Checklist.
(DOC)
Acknowledgments
Author Contributions
Conceived and designed the experiments: PW YC. Performed the experiments: PW DW.
Ana-lyzed the data: DW JH. Contributed reagents/materials/analysis tools: LL. Wrote the paper:
PW.
References
1. Chen L, Flies DB. Molecular mechanisms of T cell co-stimulation and co-inhibition. Nature reviews Immunology. 2013; 13(4):227–42. doi:10.1038/nri3405PMID:23470321; PubMed Central PMCID: PMC3786574.
2. Perez-Gracia JL, Labiano S, Rodriguez-Ruiz ME, Sanmamed MF, Melero I. Orchestrating immune check-point blockade for cancer immunotherapy in combinations. Current opinion in immunology. 2014; 27:89–97. doi:10.1016/j.coi.2014.01.002PMID:24485523.
3. Schreiber RD, Old LJ, Smyth MJ. Cancer immunoediting: integrating immunity's roles in cancer sup-pression and promotion. Science. 2011; 331(6024):1565–70. doi:10.1126/science.1203486PMID:
21436444.
4. Mittal D, Gubin MM, Schreiber RD, Smyth MJ. New insights into cancer immunoediting and its three component phases—elimination, equilibrium and escape. Current opinion in immunology. 2014; 27:16–25. doi:10.1016/j.coi.2014.01.004PMID:24531241.
5. Hino R, Kabashima K, Kato Y, Yagi H, Nakamura M, Honjo T, et al. Tumor cell expression of pro-grammed cell death-1 ligand 1 is a prognostic factor for malignant melanoma. Cancer. 2010; 116(7): 1757–66. Epub 2010/02/10. doi:10.1002/cncr.24899PMID:20143437.
6. Taube JM, Anders RA, Young GD, Xu H, Sharma R, McMiller TL, et al. Colocalization of inflammatory response with B7-h1 expression in human melanocytic lesions supports an adaptive resistance mecha-nism of immune escape. Science translational medicine. 2012; 4(127):127ra37. Epub 2012/03/31. doi:
10.1126/scitranslmed.3003689PMID:22461641; PubMed Central PMCID: PMCPmc3568523.
7. Shi SJ, Wang LJ, Wang GD, Guo ZY, Wei M, Meng YL, et al. B7-H1 expression is associated with poor prognosis in colorectal carcinoma and regulates the proliferation and invasion of HCT116 colorectal cancer cells. PloS one. 2013; 8(10):e76012. doi:10.1371/journal.pone.0076012PMID:24124529; PubMed Central PMCID: PMC3790819.
8. Konishi J, Yamazaki K, Azuma M, Kinoshita I, Dosaka-Akita H, Nishimura M. B7-H1 expression on non-small cell lung cancer cells and its relationship with tumor-infiltrating lymphocytes and their PD-1 expres-sion. Clinical cancer research: an official journal of the American Association for Cancer Research. 2004; 10(15):5094–100. Epub 2004/08/07. doi:10.1158/1078-0432.ccr-04-0428PMID:15297412.
9. Mu CY, Huang JA, Chen Y, Chen C, Zhang XG. High expression of PD-L1 in lung cancer may contrib-ute to poor prognosis and tumor cells immune escape through suppressing tumor infiltrating dendritic cells maturation. Medical oncology (Northwood, London, England). 2011; 28(3):682–8. Epub 2010/04/ 08. doi:10.1007/s12032-010-9515-2PMID:20373055.
10. Yang CY, Lin MW, Chang YL, Wu CT, Yang PC. Programmed cell death-ligand 1 expression in surgi-cally resected stage I pulmonary adenocarcinoma and its correlation with driver mutations and clinical outcomes. European journal of cancer (Oxford, England: 1990). 2014; 50(7):1361–9. Epub 2014/02/ 20. doi:10.1016/j.ejca.2014.01.018PMID:24548766.
11. Velcheti V, Schalper KA, Carvajal DE, Anagnostou VK, Syrigos KN, Sznol M, et al. Programmed death ligand-1 expression in non-small cell lung cancer. Laboratory investigation; a journal of technical methods and pathology. 2014; 94(1):107–16. Epub 2013/11/13. doi:10.1038/labinvest.2013.130PMID:24217091.
12. Chen XL, Yuan SX, Chen C, Mao YX, Xu G, Wang XY. [Expression of B7-H1 protein in human pancre-atic carcinoma tissues and its clinical significance]. Ai zheng = Aizheng = Chinese journal of cancer. 2009; 28(12):1328–32. Epub 2009/12/05. PMID:19958630.
13. Gao Q, Wang XY, Qiu SJ, Yamato I, Sho M, Nakajima Y, et al. Overexpression of PD-L1 significantly associates with tumor aggressiveness and postoperative recurrence in human hepatocellular carci-noma. Clinical cancer research: an official journal of the American Association for Cancer Research. 2009; 15(3):971–9. Epub 2009/02/04. doi:10.1158/1078-0432.ccr-08-1608PMID:19188168.
14. Kuang DM, Zhao Q, Peng C, Xu J, Zhang JP, Wu C, et al. Activated monocytes in peritumoral stroma of hepatocellular carcinoma foster immune privilege and disease progression through PD-L1. The Jour-nal of experimental medicine. 2009; 206(6):1327–37. Epub 2009/05/20. doi:10.1084/jem.20082173 PMID:19451266; PubMed Central PMCID: PMCPmc2715058.
16. Page DB, Postow MA, Callahan MK, Allison JP, Wolchok JD. Immune modulation in cancer with anti-bodies. Annual review of medicine. 2014; 65:185–202. doi:10.1146/annurev-med-092012-112807 PMID:24188664.
17. Tumeh PC, Harview CL, Yearley JH, Shintaku IP, Taylor EJ, Robert L, et al. PD-1 blockade induces responses by inhibiting adaptive immune resistance. Nature. 2014; 515(7528):568–71. doi:10.1038/
nature13954PMID:25428505; PubMed Central PMCID: PMC4246418.
18. Powles T, Eder JP, Fine GD, Braiteh FS, Loriot Y, Cruz C, et al. MPDL3280A (anti-PD-L1) treatment leads to clinical activity in metastatic bladder cancer. Nature. 2014; 515(7528):558–62. doi:10.1038/
nature13904PMID:25428503.
19. Herbst RS, Soria JC, Kowanetz M, Fine GD, Hamid O, Gordon MS, et al. Predictive correlates of response to the anti-PD-L1 antibody MPDL3280A in cancer patients. Nature. 2014; 515(7528):563–7. doi:10.1038/nature14011PMID:25428504.
20. Liberati A, Altman DG, Tetzlaff J, Mulrow C, Gotzsche PC, Ioannidis JP, et al. The PRISMA statement for reporting systematic reviews and meta-analyses of studies that evaluate health care interventions: explanation and elaboration. PLoS medicine. 2009; 6(7):e1000100. doi:10.1371/journal.pmed. 1000100PMID:19621070; PubMed Central PMCID: PMC2707010.
21. Deeks JJ HJ, Altman DG. Analysing and presenting results. In: Higgins JPT, Green S, ed. Cochrane Handbook for Systematic Reviews of Interventions 425 Chichester, UK: John Wiley & Sons. 2006.
22. Boorjian SA, Sheinin Y, Crispen PL, Farmer SA, Lohse CM, Kuntz SM, et al. T-cell coregulatory mole-cule expression in urothelial cell carcinoma: clinicopathologic correlations and association with survival. Clinical cancer research: an official journal of the American Association for Cancer Research. 2008; 14(15):4800–8. Epub 2008/08/05. doi:10.1158/1078-0432.ccr-08-0731PMID:18676751.
23. Chen L, Deng H, Lu M, Xu B, Wang Q, Jiang J, et al. B7-H1 expression associates with tumor invasion and predicts patient's survival in human esophageal cancer. International journal of clinical and experi-mental pathology. 2014; 7(9):6015–23. PMID:25337246; PubMed Central PMCID: PMC4203217.
24. Chen YB, Mu CY, Huang JA. Clinical significance of programmed death-1 ligand-1 expression in patients with non-small cell lung cancer: a 5-year-follow-up study. Tumori. 2012; 98(6):751–5. doi:10.
1700/1217.13499PMID:23389362.
25. Cho YA, Yoon HJ, Lee JI, Hong SP, Hong SD. Relationship between the expressions of PD-L1 and tumor-infiltrating lymphocytes in oral squamous cell carcinoma. Oral oncology. 2011; 47(12):1148–53. Epub 2011/09/14. doi:10.1016/j.oraloncology.2011.08.007PMID:21911310.
26. Geng Y, Wang H, Lu C, Li Q, Xu B, Jiang J, et al. Expression of costimulatory molecules B7-H1, B7-H4 and Foxp3(+) Tregs in gastric cancer and its clinical significance. International journal of clinical oncol-ogy. 2015; 20(2):273–81. doi:10.1007/s10147-014-0701-7PMID:24804867.
27. Hamanishi J, Mandai M, Iwasaki M, Okazaki T, Tanaka Y, Yamaguchi K, et al. Programmed cell death 1 ligand 1 and tumor-infiltrating CD8+ T lymphocytes are prognostic factors of human ovarian cancer. Proceedings of the National Academy of Sciences of the United States of America. 2007; 104(9): 3360–5. Epub 2007/03/16. doi:10.1073/pnas.0611533104PMID:17360651; PubMed Central PMCID: PMCPmc1805580.
28. Hou J, Yu Z, Xiang R, Li C, Wang L, Chen S, et al. Correlation between infiltration of FOXP3+ regulatory T cells and expression of B7-H1 in the tumor tissues of gastric cancer. Experimental and molecular pathology. 2014; 96(3):284–91. doi:10.1016/j.yexmp.2014.03.005PMID:24657498.
29. Karim R, Jordanova ES, Piersma SJ, Kenter GG, Chen L, Boer JM, et al. Tumor-expressed B7-H1 and B7-DC in relation to PD-1+ T-cell infiltration and survival of patients with cervical carcinoma. Clinical cancer research: an official journal of the American Association for Cancer Research. 2009; 15(20): 6341–7. Epub 2009/10/15. doi:10.1158/1078-0432.ccr-09-1652PMID:19825956.
30. Liu Y, Carlsson R, Ambjorn M, Hasan M, Badn W, Darabi A, et al. PD-L1 expression by neurons nearby tumors indicates better prognosis in glioblastoma patients. The Journal of neuroscience: the official journal of the Society for Neuroscience. 2013; 33(35):14231–45. Epub 2013/08/30. doi:10.1523/
jneurosci.5812-12.2013PMID:23986257.
31. Loos M, Langer R, Schuster T, Gertler R, Walch A, Rauser S, et al. Clinical significance of the costimu-latory molecule B7-H1 in Barrett carcinoma. The Annals of thoracic surgery. 2011; 91(4):1025–31. Epub 2011/03/29. doi:10.1016/j.athoracsur.2010.12.041PMID:21440117.
32. Mansfield AS, Roden AC, Peikert T, Sheinin YM, Harrington SM, Krco CJ, et al. B7-H1 expression in malignant pleural mesothelioma is associated with sarcomatoid histology and poor prognosis. Journal of thoracic oncology: official publication of the International Association for the Study of Lung Cancer. 2014; 9(7):1036–40. doi:10.1097/JTO.0000000000000177PMID:24926549; PubMed Central PMCID: PMC4058651.
Cancer immunology, immunotherapy: CII. 2007; 56(8):1173–82. Epub 2006/12/23. doi:10.1007/
s00262-006-0266-zPMID:17186290.
34. Ohigashi Y, Sho M, Yamada Y, Tsurui Y, Hamada K, Ikeda N, et al. Clinical significance of programmed death-1 ligand-1 and programmed death-1 ligand-2 expression in human esophageal cancer. Clinical cancer research: an official journal of the American Association for Cancer Research. 2005; 11(8): 2947–53. Epub 2005/04/20. doi:10.1158/1078-0432.ccr-04-1469PMID:15837746.
35. Ukpo OC, Thorstad WL, Lewis JS Jr. B7-H1 expression model for immune evasion in human papilloma-virus-related oropharyngeal squamous cell carcinoma. Head and neck pathology. 2013; 7(2):113–21. Epub 2012/11/28. doi:10.1007/s12105-012-0406-zPMID:23179191; PubMed Central PMCID: PMCPmc3642256.
36. Wang Y, Zhuang Q, Zhou S, Hu Z, Lan R. Costimulatory molecule B7-H1 on the immune escape of blad-der cancer and its clinical significance. Journal of Huazhong University of Science and Technology Medi-cal sciences = Hua zhong ke ji da xue xue bao Yi xue Ying De wen ban = Huazhong keji daxue xuebao Yixue Yingdewen ban. 2009; 29(1):77–9. Epub 2009/02/19. doi:10.1007/s11596-009-0116-2PMID:
19224168.
37. Wu C, Zhu Y, Jiang J, Zhao J, Zhang XG, Xu N. Immunohistochemical localization of programmed death-1 ligand-1 (PD-L1) in gastric carcinoma and its clinical significance. Acta histochemica. 2006; 108(1):19–24. Epub 2006/03/15. doi:10.1016/j.acthis.2006.01.003PMID:16530813.
38. Xylinas E, Robinson BD, Kluth LA, Volkmer BG, Hautmann R, Kufer R, et al. Association of T-cell co-regulatory protein expression with clinical outcomes following radical cystectomy for urothelial carci-noma of the bladder. European journal of surgical oncology: the journal of the European Society of Sur-gical Oncology and the British Association of SurSur-gical Oncology. 2014; 40(1):121–7. Epub 2013/10/22. doi:10.1016/j.ejso.2013.08.023PMID:24140000.
39. Zhu J, Chen L, Zou L, Yang P, Wu R, Mao Y, et al. MiR-20b, -21, and -130b inhibit PTEN expression resulting in B7-H1 over-expression in advanced colorectal cancer. Human immunology. 2014; 75(4): 348–53. doi:10.1016/j.humimm.2014.01.006PMID:24468585.
40. Dong H, Strome SE, Salomao DR, Tamura H, Hirano F, Flies DB, et al. Tumor-associated B7-H1 pro-motes T-cell apoptosis: a potential mechanism of immune evasion. Nature medicine. 2002; 8(8): 793–800. Epub 2002/07/02. doi:10.1038/nm730PMID:12091876.
41. Iwai Y, Ishida M, Tanaka Y, Okazaki T, Honjo T, Minato N. Involvement of PD-L1 on tumor cells in the escape from host immune system and tumor immunotherapy by PD-L1 blockade. Proceedings of the National Academy of Sciences of the United States of America. 2002; 99(19):12293–7. Epub 2002/09/ 10. doi:10.1073/pnas.192461099PMID:12218188; PubMed Central PMCID: PMCPmc129438.
42. Curiel TJ, Wei S, Dong H, Alvarez X, Cheng P, Mottram P, et al. Blockade of B7-H1 improves myeloid dendritic cell-mediated antitumor immunity. Nature medicine. 2003; 9(5):562–7. Epub 2003/04/22. doi:
10.1038/nm863PMID:12704383.
43. Strome SE, Dong H, Tamura H, Voss SG, Flies DB, Tamada K, et al. B7-H1 blockade augments adop-tive T-cell immunotherapy for squamous cell carcinoma. Cancer research. 2003; 63(19):6501–5. Epub 2003/10/16. PMID:14559843.
44. Blank C, Brown I, Peterson AC, Spiotto M, Iwai Y, Honjo T, et al. PD-L1/B7H-1 inhibits the effector phase of tumor rejection by T cell receptor (TCR) transgenic CD8+ T cells. Cancer research. 2004; 64(3):1140–5. Epub 2004/02/12. PMID:14871849.
45. Yadav M, Jhunjhunwala S, Phung QT, Lupardus P, Tanguay J, Bumbaca S, et al. Predicting immuno-genic tumour mutations by combining mass spectrometry and exome sequencing. Nature. 2014; 515(7528):572–6. doi:10.1038/nature14001PMID:25428506.
46. Gubin MM, Zhang X, Schuster H, Caron E, Ward JP, Noguchi T, et al. Checkpoint blockade cancer immunotherapy targets tumour-specific mutant antigens. Nature. 2014; 515(7528):577–81. doi:10.
1038/nature13988PMID:25428507.
47. Topalian SL, Hodi FS, Brahmer JR, Gettinger SN, Smith DC, McDermott DF, et al. Safety, activity, and immune correlates of anti-PD-1 antibody in cancer. The New England journal of medicine. 2012; 366(26):2443–54. doi:10.1056/NEJMoa1200690PMID:22658127; PubMed Central PMCID: PMC3544539.
48. Brahmer JR, Tykodi SS, Chow LQ, Hwu WJ, Topalian SL, Hwu P, et al. Safety and activity of anti-PD-L1 antibody in patients with advanced cancer. The New England journal of medicine. 2012; 366(26): 2455–65. doi:10.1056/NEJMoa1200694PMID:22658128; PubMed Central PMCID: PMC3563263.