ISSN 0104-6632 Printed in Brazil
www.abeq.org.br/bjche
Vol. 33, No. 03, pp. 559 - 566, July - September, 2016 dx.doi.org/10.1590/0104-6632.20160333s20150124
Brazilian Journal
of Chemical
Engineering
STUDY OF FEEDSTOCK INJECTION TO IMPROVE
CATALYST HOMOGENIZATION IN THE RISER OF
A FCC
D. C. Pelissari
1, H. C. Alvarez-Castro
2, M. Mori
1*and W. Martignoni
31Universidade Estadual de Campinas, Faculdade de Engenharia Química, Business Management and Chemical Processes Research Laboratory, Avenida Albert Einstein 500, CEP: 13083-970, Campinas - SP, Brazil.
Phone: (55) (19) 3521-0373 *E-mail: [email protected]
2Universidad Manuela Beltrán (UMB) /AC Ingenieria Virtual, Bucaramanga, Colombia. E-mail: [email protected]
3PETROBRAS/AB-RE-TR/OT, 65 República do Chile Ave, CEP: 20031-912, Rio de Janeiro - RJ, Brazil.
(Submitted: February 26, 2015 ; Revised: July 12, 2015 ; Accepted: July 27, 2015)
Abstract- A three dimensional gas-solid reactive flow model based on the Eulerian-Eulerian approach was used to study the effects of different nozzle designs with internal parts inside the FCC riser. The simulations were solved using Computational Fluid Dynamics (CFD) with CFX version 14.0 as tool. The results showed that the nozzle designs have a significant influence on the gas-solid behavior, resulting in an important role in the hydrodynamics and thermal behavior of the riser. Furthermore, the simulations show it is possible to improve the catalyst-gas distribution with an appropriate nozzle design.
Keywords: Nozzles; Riser; Fluid Dynamic; FCC.
INTRODUCTION
Fluidized bed reactors (FBR) have been the basis for gas-solid reactions in various types of industries because of their better mass and heat transfer when compared to other systems with the same purpose. Many applications of FBR highlight their use in the refining industry like the fluidized catalytic cracking process (FCC), which consists of the production of petroleum light fractions with high economic value (gasoline, diesel) from the heavy fractions of less commercial interest.
According to Fahim et al. (2010), the FCC unit’s basic structure consists of a riser (reactor), where gas oil, catalyst and steam are fed, and a regenerator where the coke deposited on the catalyst surface
during the reactions is burned-off to regenerate the catalyst. The riser is a long vertical tube with high height/diameter ratio, in order to promote pneumatic transport and the optimal conditions for the desired reactions to take place.
catalytic reaction. The feedstock is injected into the riser through nozzles, which aim to atomize the charge into small droplets and promote a perfect contact between the catalyst and the feedstock, thus minimiz-ing regions of high catalyst concentration in order to avoid undesired reactions.
McCarthy et al. (1997), Chen (2006) and Wolschlag
et al. (2010) show studies of the technological ad-vances in the FCC process, which emphasize the im-portant role that nozzles have on the riser perfor-mance. According to Chen (2006) and McCarthy et al. (1997), the injectors reduce thermal cracking, since they promote a rapid feedstock vaporization and effi-cient mixing between the catalyst and gas oil droplets. However, according to Theologos et al. (1997), The-ologos and Markatos (1993), Mauleon and Coorcelle (1985) and Behjat et al. (2010) the flow in the riser is very complex and is characterized by high turbulence and non-uniformity in the phase distribution, particu-larly in the injection zone. Therefore, studies related to the injection zone, especially experimental re-search, are not common.
Due to this complex behavior in the riser, experi-mental research linked with the FCC riser are nor-mally tested experimentally in a cold-riser model. In this respect, the works of Fan et al. (2002) and Fan et al. (2010) focused on the lift region and injection zone, and Gupta and Berruti (2000) and Harris et al. (2003) investigated the effects of riser outlet geome-try. Despite using cold-riser models, these experi-ments generated important data about the boundary and initial conditions, which were essential for nu-merical models.
Numerical simulations using CFD have become an important tool in understanding the phenomena oc-curring in the riser. Theologos et al. (1997) simulated a FCC riser using a one-dimensional model with 10-lump kinetic model to describe the reactions of catalytic cracking, studying the influence of the num-ber of nozzles on the reactor performance. The simu-lation results showed that the desired reaction yield was improved by increasing the number of nozzles, since it provided a better catalyst homogenization.
Lopes et al. (2011) showed in their work the im-portance of using three-dimensional models to predict the phenomena that occur in the riser. Then Lopes et al. (2012) and Barbosa et al. (2012) used three-dimensional models to study the influence of different riser outlet and inlet geometries, respectively. It was observed that small changes in the riser geometry influence the hydrodynamics and the product profile.
Li et al. (2013) used a 14-lump model to simulate the FCC riser, with variation in the feedstock injection velocity, the injection angle and the injector positions. The results showed that the injection velocity and angle played an important role in the process, while the nozzle positions do not have significant influence.
Due to the high profitability of the FCC process, many studies have been granted patents covering dif-ferent settings for the riser in order to improve contact between the catalyst and gas oil. Among those works, many of them are related to zone injection, with either new nozzle design, injection angle, flow direction or arrangement (Chen et al., 1998; Haruch, 2000; Chen, 2011; Delesdernier et al., 2011; Wilson et al., 2013). However, patents are not detailed scientific works, and they are usually derived from trial and error experiments, which do not generate data for further work.
In this study, four different nozzle designs were evaluated using a three-dimensional gas-solid reactive flow model, a catalytic cracking kinetic model of 12-lumps and detailed feedstock injectors with changes in the design in order to improve the homogenization of the injection zone.
MATHEMATICAL MODEL
The simulations were conducted in the Solver CFX 14 tool. A 3D model was used to describe the flow transport phenomena with an Eulerian-Eulerian ap-proach, where both phases are considered to be tinuous and interpenetrating. In this approach the con-servation equations for mass, momentum and energy, (Equations (1) to (6)) in Table 1, were solved simulta-neously. All the meanings and description of the varia-bles, subscripts and superscripts in Table 1 are presented in the Nomenclature section.
Table 1: Governing Equations and Complementary Correlations.
Governing equations
Continuity equations of gas and solid phases
g g g g g
0t
u (1)
s s
s s s
0t
u (2)
Momentum equations of gas and solid phases
T
g g g g g g g g g g g g p g g s g
t
u u u u u g u u (3)
T
s s s s s s s s s s s sG s s s g s
t
u u u u u g u u (4)
Energy equation of gas and solid phases
rg g g g g g g g g g gs s g g g r
r
C
H H T h T T H
t t
u
(5)
s sHs
s s sHs
s s Ts
h Ags g s/
Tg Ts
t
u (6)
Additional models and correlations
Turbulence Equation (kepsilonmodel)
, ,
g lam g turb g
(7)
2 ,
turb g g k C
(8)
,,
. turb g k
g g g g g g lam g g g g
k
k k k P
t
u (9)
,
, ,1 ,2
. turb g g k
g g g g g g lam g C P C g
t k
u
(10)
, .
T k
turb g g g g
P u u u (11)
Drag Force (Gidaspow, 1994) 2 2 2.65 7 150 0.2 4 3 0.2 4
s g s g
s g
s s
g s
s g s g g g
D s s d d C d u u u u (12)
0.6870.44 1000 24
1 0.15 1000
s D s s s Re C Re Re Re (13)
Continuation Table 1
Governing equations
Solid Pressure (Gidaspow, 1994)
0 s s max,
GG exp c (14)
Heat transfer coefficient between phases
g gs
p Nu h
d
(15)
Ranz-Marshall Correlation 0.5 0.33 2.0 0.6
Nu Re Pr (16)
SIMULATION
In this work a riser geometry adapted from Alvarez-Castro et al. (2014) was used. The general riser geometry, nozzle designs and dimensions are shown in Figure 1 and Table 2. In Figure 1A, it can be seen that the riser is composed of a fluidized steam entrance, catalyst entrance and feedstock
inlet, each one independent. The feedstock inlet is composed of eight feedstock nozzles equally dis-tributed around the riser with an angle of 45º. In order to study the effect of different nozzles on the gas and catalyst mixture, four cases were proposed, as shown in Figure 1B, C, D and E, where Figure 1B shows a design without internal parts in the riser.
Table 2: Dimensions of the simulated riser.
Length (m) 30
Bottom diameter (m) 0.7
Upper diameter (m) 1.0
Number of nozzles 8.0
Nozzles diameter (m) 0.12
Nozzles angle 45°
Catalyst entrance diameter (m) 0.6 Catalyst entrance angle 45°
Nozzle outlet area (m2)
Case 1 0,0128 Case 2 0,01131 Case 3 0,0044 Case 4 0,0037
The computational meshes employed in the simu-lations were adapted from Alvarez-Castro et al. (2012) and ranged from about 675,000 to 1,300,000 elements according to the nozzle design complexity. The mesh is in agreement with previous Alvarez-Castro et al. (2012) mesh tests shown in Table 3. The operating conditions used were taken from Chang et al. (2012), shown in Table 4 and the component properties are the same used by Alvarez-Castro et al. (2015), which were taken from Lopes et al. (2011). The no slip con-dition on the wall was assumed for the gas phase and the free slip condition for the solid phase.
Table 3: Mesh Test (Alvarez-Castro, 2012).
Elements Number
334,000 534,000 765,000 980,000 1,457,000
Gasoline mass fraction
0.43 0.46 0.45 0.45 0.45
Pressure (Pa) 6,052 6,068 6,042 6,052 6,014
Table 4: Main operating conditions (Chang et al., 2012).
Reaction temperature (K) 793.15 Pressure drop (kPa) 163
Reaction time (s) 3.22
Flux of fresh feedstock (t/h) 124.46 Inlet temperature of fresh feedstock (K) 543.15 Catalyst temperature at the riser inlet (K) 913.15 Ratio of catalyst to oil 8.1
The commercial software ANSYS CFX 14 was used to solve the numerical discretization (space and time) of mass, momentum, energy and species conservation equations through the finite volume method. Transient expressions were estimated via the second order backward Euler. The high resolution interpolation scheme was used, with RMS of 10-4 as convergence criterion. The simulation time was fifteen seconds, enough time for variables to present a cyclic behavior according to Lopes et al. (2011) and Alvarez-Castro et al. (2015).
RESULTS AND DISCUSSION
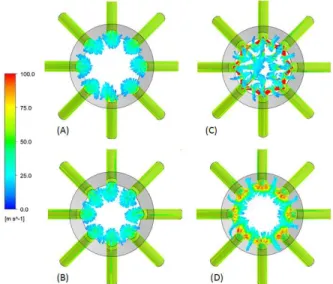
Figure 2 shows a riser top view, highlighting the gas oil flow direction through the nozzles in stream-line view. Figures 2A and B show a nozzle design similarity and the only difference is the fact that Case 2 has internal parts in the riser. It also can be seen that the two cases have similar flow behavior, but the gas oil flow in Case 2 reaches a more central region, implying that the use of injectors with internal parts strongly affects the flow in the riser. Those results are better seen in Figure 3, which shows the gas phase volume fraction in cross-sectional planes. In Case 2 a more concentrated central region is observed when compared to Case 1.
Figure 2: Stream line gas phase velocity: (A) Case 1; (B) Case 2; (C) Case 3 and (D) Case 4.
Figure 3: Gas phase volume fraction in cross-sectional planes 0.1 m after the feedstock injection: (A) Case 1; (B) Case 2; (C) Case 3 and (D) Case 4.
different nozzle designs play an important role in the injection zone flow profile. It can be noted that the nozzle designs in Figures 2C and D provide gas oil outflows with higher speed than the nozzle design in Figure 2B. In Case 3 a better gas phase distribution can be seen (Figure 3C). The gas flow covers the greater part of the riser. However, in Case 4 (Figure 3D), a similarity can be observed in the fluid dynamic profile with Cases 1 and 2, although Case 4 generates higher output speed when compared to them.
The different flow effects on the riser fluid dy-namic are shown in Figure 4, which shows the solid fraction in the axial plane. It can be seen in Cases 1, 2 and 4 that the catalyst is shifted toward the riser center in the injection zone due to the injected gas oil, which is in agreement with previous work reported by Li et al. (2013) and Alvarez-Castro et al. (2015). In Case 3 a better homogeneous catalyst distribution is ob-served, without catalyst accumulation in the riser center as compared to other cases, resulting in better flow distribution shown in Figure 2C.
Figure 4: Catalyst volume fraction: (A) Case 1; (B) Case 2; (C) Case 3 and (D) Case 4.
Figure 5 shows the temperature profile for the different nozzles in an axial plane. The temperature profile is similar to the profile of the catalyst volume fraction, in which high temperature can be noted in regions with high catalyst concentrations, that is in the central region and regions close to the wall. It can be noted that Case 3 has a better homogeneous ture distribution, without regions with large tempera-ture differences as in Case 1.
Figure 6 shows the catalyst volume fraction and temperature profiles, at a height of 6 m, as a function of radius for Cases 1, 2, 3 and 4. All these cases present an accumulation of catalyst and high temperature near the wall and in the central region. In addition, it can be noted that Case 3 also shows high temperature and catalyst concentrations near the wall, but it presents a more homogeneous temperature profile and catalyst distribution when compared to Cases 1, 2 and 4. Besides it favors a lower temperature gradient between the central region and the wall, showing better catalyst distribution inside the riser.
Figure 5: Temperature: (A) Case 1; (B) Case 2; (C) Case 3 and (D) Case 4.
CONCLUSIONS
The FCC riser’s injection zone fluid dynamic pro-file was determined using a three dimensional, multi-phase and reactive model, through numerical simula-tions. The effects of using nozzles with internal parts in the riser and different designs were evaluated. The results for the flow direction, the catalyst distribution and the temperature showed that the nozzles with internal parts in the riser and nozzle designs have a significant influence on the gas-solid interaction, resulting in an important role on the riser fluid dy-namics and thermal behavior. The simulation results indicated that a high gas oil output speed through the nozzles did not guarantee a better mixture between the phases. It is necessary to consider the jet directions. According to the results, it can be concluded that it is possible to improve the catalyst distribution inside the riser through changes in the nozzle design, thus emphasizing their importance in improving the catalytic cracking process.
ACKNOWLEDGEMENTS
The authors thank CAPES and Petrobras for the financial support of this research.
NOMENCLATURE
i
C Molar concentration of component I
[kmol m-3] D
C Drag coefficient [-]
μ
C Constant (0.09)
,1
C Constant (1.44)
,2
C Constant (1.92)
d Particle diameter [m]
g Gravitational acceleration [m2 s−1]
G Elasticity modulus [Pa]
0
G Constant of elasticity modulus function [Pa]
H Static enthalpy [J mol−1]
k Turbulent kinetic energy [m2 s−2]
Nu Nusselt number [-]
p Static pressure [Pa]
k
p Shear production of turbulence [Pa s−1]
Pr Prandtl number [-]
Re Reynolds number [-]
T Static temperature [K]
u Velocity vector [m s−1]
Greek Symbols
Interphase momentum transfer [kg m−3 s−1]
Volume fraction [-]
Turbulence dissipation rate [m2 s−3]
Interphase heat transfer coefficient [W m−2 K−1]
Thermal conductivity [W m−1 K−1]
μ Viscosity [Pa s]
ρ Density [kg m−3] k
σ Constant (1.00)
σ Constant (3.00)
Subscripts
g Gas phase
lam Laminar r Reaction
s Solid phase
turb Turbulent
REFERENCES
Alvarez-Castro, H. C., Matos, E. M., Mori, M., Martignoni, W., 3D CFD mesh configurations and turbulence models studies and their influence on the industrial risers of fluid catalytic cracking. AIChE Annual Meeting in Pittsburgh, USA (2012).
Alvarez-Castro, H. C., Analysis of process variables via CFD to evaluate the performance of a FCC riser. PhD Thesis. Chemical Engineering Depar-tament, University of Campinas (2014).
Alvarez-Castro, H. C., Matos, E. M., Mori, M., Mar-tignoni, W., Ocone, R. W., Analysis of process variables via CFD to evaluate the performance of a FCC riser. International Journal of Chemical En-gineering, vol. 2015, Article ID 259603, 13 pages (2015).
Barbosa, A. C., Lopes, G. C., Rosa, L. M., Mori, M., Martignoni, W. P., Three dimensional simulation of catalytic cracking reactions in industrial scale riser using a 11-lump kinetic. Chemical Engineer-ing Transactions, 32, p. 637-642 (2011).
Behjat, Y., Shahhosseini, S., Marvast, M. A., Model-ing gas oil spray coalescence and vaporization in gas solid riser reactor. International Communica-tions in Heat and Mass Transfer, 37, p. 935-943 (2010).
riser with bottom airlift loop mixer. Chemical En-gineering Science, 78, p. 128-143 (2012). Chen, Y., Recent advances in FCC technology.
Pow-der Technology, 163, p. 2-8 (2006).
Chen, Y. M., Dewitz, S., Feed nozzle. U.S. patent 5,794,857 (1998).
Chen, Y. M., Feed nozzle assembly. U.S. patent 7,992,805 (2011).
Delesdernier, D. T., Betsold, M. P., Dziadzeo, J. D., Bassett, T. A., Spray nozzles. U.S. Patent 8,025,792 (2011).
Fahim, M. A., Alsahhaf, T. A. and Elkilani, A., Fluid-ized Catalytic Cracking. In Fundamental of Petroleum Refining, Chapter 8, pp. 199-235 Am-sterdam, Elsevier (2010).
Fan, Y., E, C., Shi, M., Lu, C., Xu, C., Gao, J., Lu, C., Diffusion of feed spray in fluid catalytic cracking. AIChE Journal, 56(4), p. 858-868 (2010).
Fan, Y., Ye, S., Chao, Z., Lu, C., Sun, G., Shi, M., Gas-solid two-phase flow in FCC process. AIChE Journal, 48(9), p. 1869-1887 (2002).
Gao, J. Q., Xu, C. M, Lin, S. X., Yang, G. H., Ad-vanced model for turbulent gas-solid flow and reaction in FCC riser reactors. AIChE Journal, 45(5), p. 1095-1113 (1999).
Gidaspow, D., Multiphase Flow and Fluidization: Continuum and Kinetic Theory Descriptions. Aca-demic Press, San Diego (1994).
Gupta, S. K., Berruti, F., Evaluation of the gas-solid suspension density in CBF risers with exit effects. Powder Technology, 18, p. 21-31 (2000).
Harris, A. T., Davidson, J. F., Thorpe, R. B., Influence of exit geometry in circulating fluidized bed risers. AIChE Journal, 49(1), p. 52-64 (2003).
Haruch, J., Enhanced efficiency nozzle for use in flu-idized catalytic cracking. U.S. Patent 6,098,896 (2000).
Li, J., Fan, Y. P., Lu, C. X., Luo, Z. H., Numerical simulation of influence of feed injection on hy-drodynamic behavior and catalytic cracking
reac-tions in a FCC riser under reactive condireac-tions. Industrial & Engineering Chemistry Research, 52, p. 11084-11098 (2013).
Lopes, G. C., Rosa, L. M., Mori, M., Nunhez, J. R., Martignoni, W. P., Three-dimensional modeling of fluid catalytic cracking industrial riser flow and reactions. Computers and Chemical Engineering, 35, p. 2159-2168 (2011).
Lopes, G. C., Rosa, L. M., Mori, M., Nunhez, J. R., Martignoni, W. P., CFD study of industrial FCC risers: The effect of outlet configurations on hy-drodynamics and reactions. International Journal of Chemical Engineering, p. 1-16 (2012).
Mccarthy, S. J., Raterman, M. F., Smalley, C. G., Sodomin, J. F., FCC technology upgrades: A commercial example. Annual Meeting National Petroleum Refiners Association. 10ª Convention Center, San Antonio, Texas (1997).
Mauleon, J. L., Courelle, J. C., FCC heat balance critical for heavy fuels. Oil Gas Journal, 83, p. 64-70 (1985).
Theologos, K. N., Markatos, N. C., Advanced modeling fluid catalytic cracking riser-type reac-tors. AIChE Journal, 39(6), p. 1007-1017 (1993). Theologos, K. N., Nikou, I. D., Lygeros, A. I.,
Mar-katos, N. C., Simulation and design of fluid cata-lytic cracking riser-type reactors. Computers Chemical Engineering, 20, p. 757-762 (1997). Wilson, J. M., Smith, J. S., Colman, D., Nozzle for use
in fluidized catalytic cracking. U.S. Patent 8,608,089 (2013).
Wolschlag, L. M., Couch, K. A., A Honeywell Com-pany, UOP LLC., Upgrade FCC performance: New ceramic feed distributor offers ultimate ero-sion protection. Hydrocarbon Processing, p. 57-65 (2010).