Molecular Characterization of Notch1
Positive Progenitor Cells in the Developing
Retina
Galina Dvoriantchikova1, Isabel Perea-Martinez1, Steve Pappas1, Ariel Faye Barry1, Dagmara Danek1, Xenia Dvoriantchikova1, Daniel Pelaez1,2, Dmitry Ivanov1,3*
1Bascom Palmer Eye Institute, Department of Ophthalmology, University of Miami Miller School of Medicine, Miami, Florida, United States of America,2Department of Biomedical Engineering, University of Miami, Coral Gables, Florida, United States of America,3Department of Microbiology and Immunology, University of Miami Miller School of Medicine, Miami, Florida, United States of America
Abstract
The oscillatory expression of Notch signaling in neural progenitors suggests that both repressors and activators of neural fate specification are expressed in the same progeni-tors. Since Notch1 regulates photoreceptor differentiation and contributes (together with Notch3) to ganglion cell fate specification, we hypothesized that genes encoding photore-ceptor and ganglion cell fate activators would be highly expressed in Notch1 rephotore-ceptor-bear- receptor-bear-ing (Notch1+) progenitors, directing these cells to differentiate into photoreceptors or into ganglion cells when Notch1 activity is diminished. To identify these genes, we used microar-ray analysis to study expression profiles of whole retinas and isolated from them Notch1+ cells at embryonic day 14 (E14) and postnatal day 0 (P0). To isolate Notch1+cells, we uti-lized immunomagnetic cell separation. We also used Notch3 knockout (Notch3KO) animals to evaluate the contribution of Notch3 signaling in ganglion cell differentiation. Hierarchical clustering of 6,301 differentially expressed genes showed that Notch1+cells grouped near the same developmental stage retina cluster. At E14, we found higher expression of repres-sors (Notch1, Hes5) and activators (Dll3, Atoh7, Otx2) of neuronal differentiation in Notch1+ cells compared to whole retinal cell populations. At P0, Notch1, Hes5, and Dll1 expression was significantly higher in Notch1+cells than in whole retinas. Otx2 expression was more than thirty times higher than Atoh7 expression in Notch1+cells at P0. We also observed that retinas of wild type animals had only 14% (P<0.05) more ganglion cells compared to Notch3KO mice. Since this number is relatively small and Notch1 has been shown to con-tribute to ganglion cell fate specification, we suggested that Notch1 signaling may play a more significant role in RGC development than the Notch3 signaling cascade. Finally, our findings suggest that Notch1+progenitors
—since they heavily express both pro-ganglion
cell (Atoh7) and pro-photoreceptor cell (Otx2) activators—can differentiate into either
gan-glion cells or photoreceptors. a11111
OPEN ACCESS
Citation:Dvoriantchikova G, Perea-Martinez I, Pappas S, Barry AF, Danek D, Dvoriantchikova X, et al. (2015) Molecular Characterization of Notch1 Positive Progenitor Cells in the Developing Retina. PLoS ONE 10(6): e0131054. doi:10.1371/journal. pone.0131054
Editor:Alexandre Hiroaki Kihara, Universidade Federal do ABC, BRAZIL
Received:February 27, 2015
Accepted:May 28, 2015
Published:June 19, 2015
Copyright:© 2015 Dvoriantchikova et al. This is an open access article distributed under the terms of the
Creative Commons Attribution License, which permits unrestricted use, distribution, and reproduction in any medium, provided the original author and source are credited.
Data Availability Statement:The data files have been uploaded in the NCBI Gene Expression Omnibus (GEO,http://www.ncbi.nlm.nih.gov/geo/) and are available through GEO series accession number GSE65977.
Funding:Supported in part by National Eye Institute/ National Institutes of Health (NIH)Grant R01 EY022348 (DI), Center Core Grant P30EY014801 to the University of Miami Department of
Introduction
The number of people suffering from retinal diseases is expected to increase significantly over the next two decades, especially as the population ages [1–3]. These diseases lead to retinal damage and, ultimately, blindness [1–3]. Unfortunately, many retinal diseases currently remain difficult or impossible to treat [1–3]. Stem cell technology harbors a unique potential to solve these treatment conundrums and restore patient vision by repairing and/or regenerating damaged retinas [4–7]. However, efficient use of this technology will require a deeper under-standing of the molecular mechanisms of retinal neurogenesis. Although significant progress has been made in this field over the past twenty years [8–10], many important questions remain unanswered; in particular, serious attention must be devoted to reconstructing the gene networks that regulate retinal development.
The retina is generated from multipotent progenitor cells that give rise to ganglion cells, amacrine cells, horizontal cells, and cone photoreceptors in the early stages of retinal develop-ment, and to rod photoreceptors, bipolar cells, and Müller glia in the late stages of retinal devel-opment [8–10]. A continuous supply of retinal progenitor cells (RPCs) is required for the steady production of differentiated neurons and complete retinal development [8–10]. The Notch pathway is an evolutionarily conserved intercellular signaling cascade that prevents dif-ferentiation of RPCs into retinal neurons and facilitates RPC proliferation, thereby maintaining a population of undifferentiated RPCs in the developing retinal tissue [8–11]. The classical view of Notch signaling states that in order to prevent differentiation of progenitors into neu-rons, the Notch receptor has to be activated by a Notch ligand from an adjacent cell [8–11]. Notch activation triggers release and translocation into the nucleus of the Notch protein’s intracellular domain (ICD) [8–11]. In the nucleus, the ICD binds to the Rbpj transcription fac-tor and activates members of the Hes (hairy and enhancer of split) family, such as Hes1 and Hes5 [8–11]. These proteins repress expression of pro-neural transcription factors (activators of neural fate specification) in progenitors, effectively precluding neuronal differentiation [8– 11]. Congruently, reduced Notch activation (and the concomitant reduced inhibitory influ-ences of Hes1 and Hes5) permits neuronal-specific gene expression and neuronal differentia-tion [8–11]. It has become clear more recently, however, that this classical model inadequately describes certain nuances of Notch signaling. Real-time imaging analysis indicates that Notch signaling in progenitor cells is not static, as previously thought, but dynamic (oscillatory) [12– 17]. Notch signaling promotes cyclic expression of both repressors and activators of pro-neural fate specification in progenitor cells [12–17]. As a result, the expression of both repressors and activators of pro-neural fate specification was observed in progenitor cells including in RPCs
[12–20]. Meanwhile, pro-neural activators are expressed continuously in post-mitotic neurons
in which the inhibitory activity of Notch signaling is diminished [12–17].
There are four Notch receptors (Notch1, Notch2, Notch3, and Notch4), all of which play different roles in retinal development. Notch1 and Notch3 are involved in retinal neurogenesis, while Notch4 is primarily expressed in the vasculature, regulating vessel growth in the retina
[21–25]. Notch2 expression appears the least important, and is only slightly detectable in
devel-oping retinas [26,27]. Among these four Notch receptors, Notch1 plays the most important role in the developing retina, as Notch1 is essential for the maintenance of an RPC population
[8,21–24]. Notch1 is also required for inhibiting RPC differentiation into cone (early stage)
and rod (late stage of retinal differentiation) photoreceptors, since reduction of Notch1 activity in early RPCs leads to cone photoreceptor production and ablation of Notch1 in late RPCs facilitates rod photoreceptor production [8,21–24]. It has also been demonstrated that Notch1 (as well as Notch3) regulates ganglion cell fate specification in the developing retina [8,21]. However, the decision-making mechanism that induces Notch1 positive (Notch1+) RPCs to
differentiate into retinal neurons when Notch1 activity is diminished was not understood. To investigate this mechanism, we studied expression profiles of Notch1 receptor-bearing cells (Notch1+RPCs) isolated from retinas at early and late developmental stages. Since expression of repressors and activators of neuronal differentiation should be present in Notch1+RPCs, we conducted microarray analysis on a population of Notch1+RPCs isolated from developing reti-nal tissue in order to create an expression profile of these progenitors. We suggested that the expression profile of Notch1+RPCs should contain all genes involved in the Notch1 signaling cascade (Notch1 gene network), including activators which direct Notch1+RPCs to differenti-ate into photoreceptors or ganglion cells when Notch1 activity is diminished. Our data indicdifferenti-ate that Otx2 and Atoh7 function as such activators in Notch1+RPCs.
Results
Notch1
+cells isolated from E14 and P0 retinas may represent two
different populations of RPCs
In our study, we used retinas at embryonic day 14 (E14) and postnatal day 0 (P0) to evaluate changes in Notch1+cells at early and late stages of retinal development. To isolate Notch1+ cells we employed an immunomagnetic cell separation approach using monoclonal biotin con-jugated anti-Notch1 mouse antibodies and anti-biotin magnetic microbeads. This approach allowed us to isolate intact cells expressing the Notch1 protein at their surface. To confirm the purity, we tested the expression of Notch1 in the positively selected cells. Our data showed that 97–99% of these cells were immunopositive for Notch1 (Fig 1A). Using quantitative RT-PCR, we also evaluated the levels of Notch1 expression in isolated cells compared to expression of Notch1 in whole retinas. Our data indicated significantly higher expression of Notch1 in iso-lated cells compared to whole retina samples (Fig 1B). To demonstrate specificity of the iso-lated cells, we attempted to isolate cells from retinas using only the anti-biotin magnetic microbeads (negative control). No cells were detected after this procedure. Overall, immuno-magnetic separation proved to be an effective technique for isolating Notch1+-specific cells from developing retinas.
To characterize Notch1+cells isolated from retinas at E14 and P0, we studied gene expres-sion in these cells using Mouse Exonic Evidence Based Oligonucleotide (MEEBO) microarrays, which included 38,083 genes and transcripts. To perform this experiment, RNA from isolated Notch1+cells and whole retinas at E14 and P0 was extracted and used for microarray analysis. We processed individual samples that each contained 200,000–500,000 Notch1+cells. A total of three independent biological replicates in the early stage (E14) of retinal development and four independent biological replicates in the late stage (P0) of retinal development were obtained for comparative profiling of isolated Notch1+cells and whole retinas. The results of our microarray analysis indicated that a total of 6301 genes passed the quality control criteria and One-Way ANOVA test (F>Fcrit. = 3.708) to identify genes that are regulated differently between the four studied groups (E14 Notch1+, E14 Retina, P0 Notch1+, and P0 Retina—seeS1
TableandTable 1). The changes in gene expression detected by microarrays were confirmed
Fig 1. Immunomagnetic separation proved to be an effective method for positive selection of Notch1-specific cells from developing retinas. A)The purity of isolated cells was tested using anti-Notch1 antibody (green). Propidium iodide (PI, red) was used to visualize the nucleus of the cell. Bar is 50μm.B)
The levels of Notch1 expression in isolated cells were higher compared to expression of Notch1 in whole retinas. Gene expression was measured by qRT-PCR. Results are expressed as a percentage of the corresponding value in the Notch1+cells isolated from embryonic day 14 developing retinas±SEM (*P<0.05).
doi:10.1371/journal.pone.0131054.g001
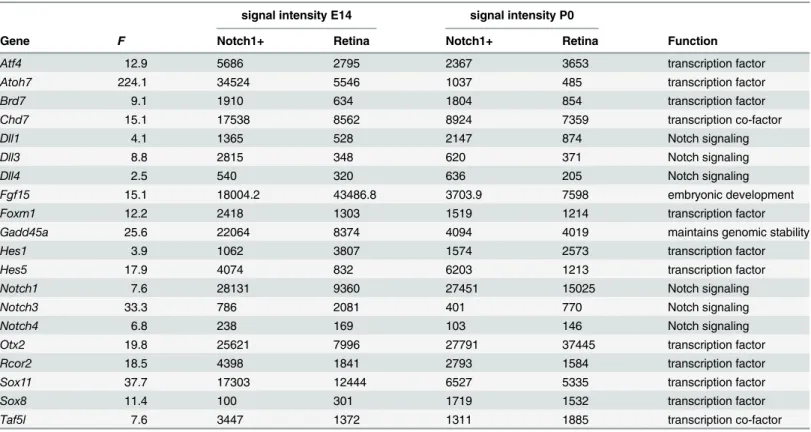
Table 1. Functional annotation for the selected genes revealed by One-Way ANOVA.
signal intensity E14 signal intensity P0
Gene F Notch1+ Retina Notch1+ Retina Function
Atf4 12.9 5686 2795 2367 3653 transcription factor
Atoh7 224.1 34524 5546 1037 485 transcription factor
Brd7 9.1 1910 634 1804 854 transcription factor
Chd7 15.1 17538 8562 8924 7359 transcription co-factor
Dll1 4.1 1365 528 2147 874 Notch signaling
Dll3 8.8 2815 348 620 371 Notch signaling
Dll4 2.5 540 320 636 205 Notch signaling
Fgf15 15.1 18004.2 43486.8 3703.9 7598 embryonic development
Foxm1 12.2 2418 1303 1519 1214 transcription factor
Gadd45a 25.6 22064 8374 4094 4019 maintains genomic stability
Hes1 3.9 1062 3807 1574 2573 transcription factor
Hes5 17.9 4074 832 6203 1213 transcription factor
Notch1 7.6 28131 9360 27451 15025 Notch signaling
Notch3 33.3 786 2081 401 770 Notch signaling
Notch4 6.8 238 169 103 146 Notch signaling
Otx2 19.8 25621 7996 27791 37445 transcription factor
Rcor2 18.5 4398 1841 2793 1584 transcription factor
Sox11 37.7 17303 12444 6527 5335 transcription factor
Sox8 11.4 100 301 1719 1532 transcription factor
Taf5l 7.6 3447 1372 1311 1885 transcription co-factor
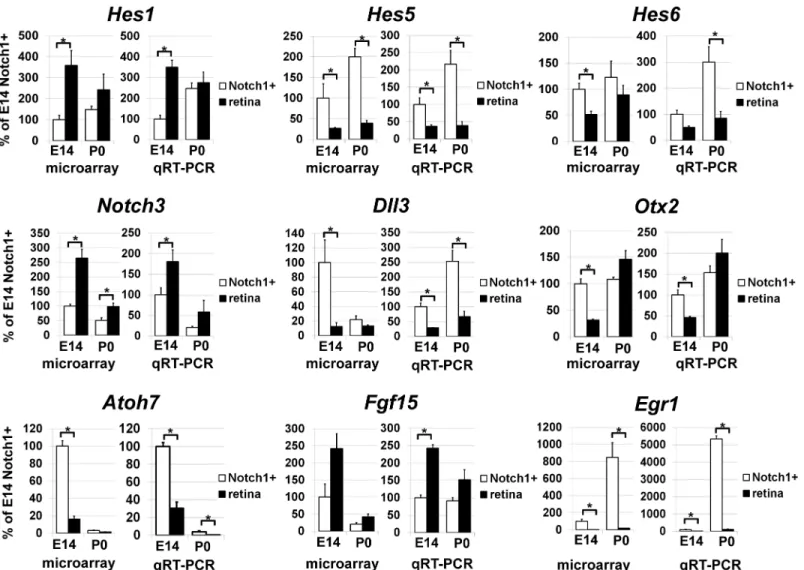
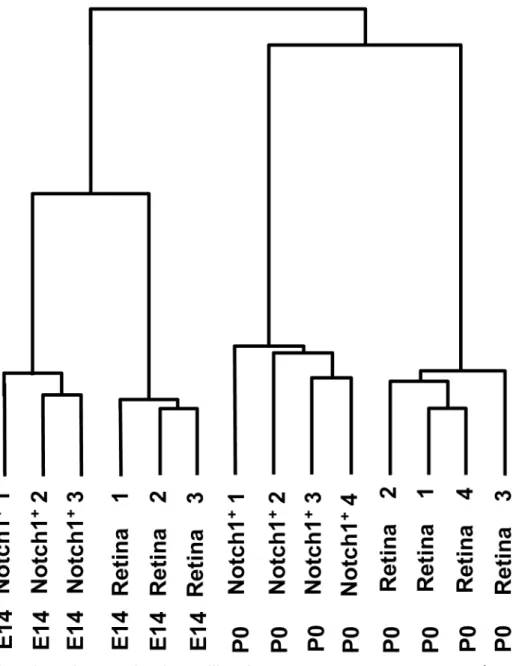
development differentiate predominantly into rod photoreceptors and bipolar cells [8,28]. In light of these observations, we investigated whether Notch1+cells represent a unique RPC line-age or if Notch1 signaling simply modulates differentiation potential in different RPC lineline-ages. If Notch1+cells do in fact represent a unique RPC lineage, they would not be expected to dem-onstrate significant changes in the expression of genes that regulate different specification or differentiation fates at E14 and P0. To answer this question of lineage, we examined changes in gene expression in Notch1+cells isolated from E14 and P0 retinas. Using a Student's T-test and twofold cut-off level, we identified 1,185 genes that were preferentially expressed in the E14 Notch1+cells and 740 genes preferentially expressed in the P0 Notch1+cells (S2 Table). These findings suggested that Notch1+cells at E14 and P0 may comprise two distinct cell populations. To verify this observation, we performed hierarchical clustering of differentially expressed genes. Our data indicated that gene expression profiles of E14 Notch1+cells shared more simi-larities with gene expression profiles of E14 whole retinas than with the gene expression pro-files of P0 Notch1+cells. By the same token, expression profiles of P0 Notch1+cells were more Fig 2. Differential gene expression was confirmed by qRT-PCR and demonstrated a consistent correlation with microarray data for a group of selected genes.For each gene, results are expressed as percentages±SEM of the corresponding values in the Notch1+cells isolated from E14 developing retinas (*P<0.05).
similar to expression profiles of P0 whole retinas than to expression profiles of E14 Notch1+ cells (Fig 3). Thus, Notch1 activity may not be restricted to one type of RPC, but may instead modulate the differentiation status of different types of RPCs, depending on their respective stages of retinal development.
High levels of Otx2 and Atoh7 expression suggest that Notch1
+RPCs
are predisposed to differentiate into photoreceptors and ganglion cells
As we noted in our“Introduction”section, the expression profile of Notch1+RPCs should con-tain all genes involved in the Notch1 signaling cascade (Notch1 gene network), including those genes encoding repressors and activators of neuronal differentiation. To properly situate Fig 3. Hierarchical clustering of 6,301 differentially expressed genes showed that Notch1+cells grouped near the same developmental stage retina cluster.Cluster analysis (hierarchical clustering) was performed using Gene Cluster 3.0 software.
Notch1 signaling within a“coordinate system”of the complex gene network of retinal neuro-genesis, we took Notch1+cells at early and late stages of retinal development and tested if they expressed any markers characteristically expressed by RPCs, precursor cells, immature retinal neurons, and mature retinal neurons. The list of retinal cell type markers was obtained from LifeMap Discovery and The Stem Cell Research Database (http://discovery.lifemapsc.com). First, we found high expression levels of all key early RPC markers at E14 (S3 Tableand
Table 2). Many of them (such as Bmpr1a/ALK3, Cdc25b, Pax6, Ptch1, Six3) were more highly
expressed in Notch1+cells than in whole retina samples. However, expression of only two pro-teins (Notch1 and Hes5) was significantly up-regulated in Notch1+cells compared to whole retina samples at E14. Meanwhile, expression of other RPC markers (including Bmpr1b/ALK6, Fgf15, Vsx2/Chx10, Hes1, Six6, and Sox2) was up-regulated in E14 whole retinas (S3 Tableand
Table 2). Importantly, Notch1 expression was higher compared to expression of other RPCs
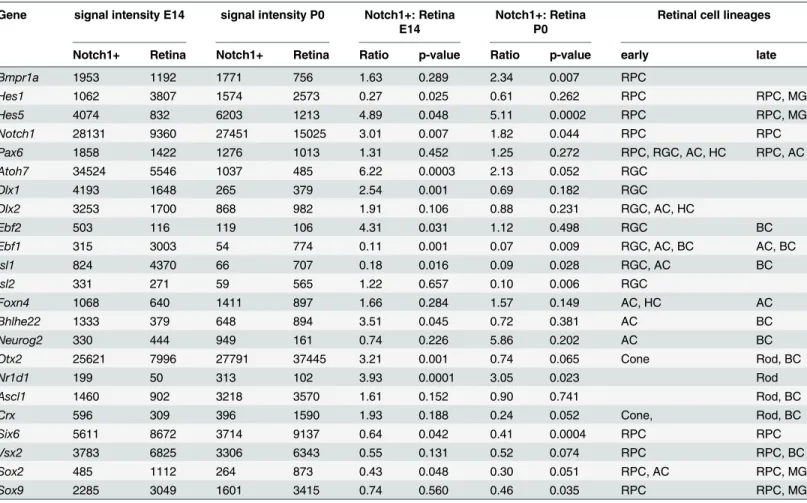
markers (Table 2). It should also be noted that Hes5 expression was higher than Hes1 expres-sion (Table 2). We observed a similar expression pattern of late RPC markers in Notch1+cells in late stages of retinal development (S3 TableandTable 2). We also analyzed expression of Notch1 ligands such as Dll1, Dll3, and Dll4. We found that all of these Notch1 ligands were expressed in Notch1+cells at E14 and P0, and that their levels were higher in Notch1+cells than in whole retina samples (Table 1). However, Notch1+cells at E14 expressed higher levels Table 2. The expression of retinal cell markers in Notch1+progenitor cells and in whole retina samples at E14 and P0.
Gene signal intensity E14 signal intensity P0 Notch1+: Retina E14
Notch1+: Retina P0
Retinal cell lineages
Notch1+ Retina Notch1+ Retina Ratio p-value Ratio p-value early late
Bmpr1a 1953 1192 1771 756 1.63 0.289 2.34 0.007 RPC
Hes1 1062 3807 1574 2573 0.27 0.025 0.61 0.262 RPC RPC, MG
Hes5 4074 832 6203 1213 4.89 0.048 5.11 0.0002 RPC RPC, MG
Notch1 28131 9360 27451 15025 3.01 0.007 1.82 0.044 RPC RPC
Pax6 1858 1422 1276 1013 1.31 0.452 1.25 0.272 RPC, RGC, AC, HC RPC, AC
Atoh7 34524 5546 1037 485 6.22 0.0003 2.13 0.052 RGC
Dlx1 4193 1648 265 379 2.54 0.001 0.69 0.182 RGC
Dlx2 3253 1700 868 982 1.91 0.106 0.88 0.231 RGC, AC, HC
Ebf2 503 116 119 106 4.31 0.031 1.12 0.498 RGC BC
Ebf1 315 3003 54 774 0.11 0.001 0.07 0.009 RGC, AC, BC AC, BC
Isl1 824 4370 66 707 0.18 0.016 0.09 0.028 RGC, AC BC
Isl2 331 271 59 565 1.22 0.657 0.10 0.006 RGC
Foxn4 1068 640 1411 897 1.66 0.284 1.57 0.149 AC, HC AC
Bhlhe22 1333 379 648 894 3.51 0.045 0.72 0.381 AC BC
Neurog2 330 444 949 161 0.74 0.226 5.86 0.202 AC BC
Otx2 25621 7996 27791 37445 3.21 0.001 0.74 0.065 Cone Rod, BC
Nr1d1 199 50 313 102 3.93 0.0001 3.05 0.023 Rod
Ascl1 1460 902 3218 3570 1.61 0.152 0.90 0.741 Rod, BC
Crx 596 309 396 1590 1.93 0.188 0.24 0.052 Cone, Rod, BC
Six6 5611 8672 3714 9137 0.64 0.042 0.41 0.0004 RPC RPC
Vsx2 3783 6825 3306 6343 0.55 0.131 0.52 0.074 RPC RPC, BC
Sox2 485 1112 264 873 0.43 0.048 0.30 0.051 RPC, AC RPC, MG
Sox9 2285 3049 1601 3415 0.74 0.560 0.46 0.035 RPC RPC, MG
(RPC—retinal progenitor cells, RGC—retinal ganglion cells, AC—amacrine cells, HC—horizontal cells, BC—bipolar cells, MG—Muller glia)
of Dll3 than of Dll1 and Dll4, while Notch1+cells at P0 expressed higher levels of Dll1 than of Dll3 or Dll4 (Table 1). These data suggest that the role of Dll3 in the Notch1 signaling cascade is most significant at E14, while Dll1 plays a more important role in Notch1 signaling at P0.
Next we analyzed the expression of markers of the precursor, immature, and mature stage of each cell type in Notch1+cells at early and late stages of retinal development (S3 Table). In Notch1+cells at E14 and P0, we observed insignificant or significantly down-regulated expres-sion of many markers of immature and mature retinal neurons (S3 TableandTable 2). During early development (S3 Table) we found increased expression of Atoh7 (marker of ganglion pre-cursor cells), Otx2 (marker of photoreceptor prepre-cursor cells), and Foxn4 (marker of amacrine and horizontal precursor cells) in Notch1+cells at E14 compared to expression of these genes in whole retina samples (Table 2). However, levels of Atoh7 and Otx2 in Notch1+cells at E14 were up to thirtyfold higher than levels of Foxn4 (Table 2). Importantly, Atoh7 and Otx2 were most highly expressed in Notch1+cells at E14, with Atoh7 expression being even greater than Notch1 expression (Table 2). It should be noted that results of hybridizationin situfrom data-bases Eurexpress (http://www.eurexpress.org/ee/) and GenePaint.org (http://genepaint.org/
Frameset.html) indicate that Notch1, Atoh7, and Otx2 expression at E14 spread throughout
the neuroblast layer, but not into the ganglion cell layer. The results of our microarray analysis also demonstrated increased expression of Dlx1 and Dlx2 (immature ganglion cell markers) in Notch1+cells, while expression of Isl1 and Pou4f2/Brn3b (markers of ganglion precursor cells) was significantly down-regulated (S3 TableandTable 2). We further observed increased expression of Crx and Rorb (markers of photoreceptor precursor cells) in Notch1+cells at E14, though the increased expression of these genes was not statistically significant. However, at P0, expression of Crx and Rorb was higher in the whole retina samples than in Notch1+cells. Thus, the gene expression profile of Notch1+cells contains gene products that prevent neural differentiation (such as Notch1 and Hes5) and gene products that promote neuronal cell fate specification (such as Atoh7 and Otx2). In sum, the results of our study suggest that dimin-ished Notch1 activity in Notch1+RPCs may permit the highest and most prolonged expression of Atoh7 and Otx2. Because of this relationship, Notch1+RPCs could be predisposed to differ-entiate into ganglion cells or photoreceptors when Notch1 activity is diminished. Finally, our results suggest that in the late stage of retinal neurogenesis Notch1+RPCs may also differenti-ate into bipolar cells, because Otx2 additionally reguldifferenti-ates bipolar cell development [8,28].
transcription factors (TFs) was obtained from the AnimalTFDB 2.0 database (http://bioinfo.
life.hust.edu.cn/AnimalTFDB/). We used the milder conditions and selected TFs (S4 Tableand
Table 3) with statistically significantly higher expression in either E14 Notch1+cells or P0
Notch1+cells than in whole retinas of the same developmental stage. These methods allowed us to expand the list of putative members of the E14 and P0 Notch1 gene networks.
Notch3 may play a less significant role in ganglion cell fate specification
than previously thought
The role of the Notch1 signaling cascade in photoreceptor differentiation was shown previ-ously [21,22,24]. The critical role of both Notch1 and Notch3 signaling in ganglion cell fate specification was also demonstrated [8,21]. However, these previous models described Notch3 as the primary regulator of ganglion cell development, with Notch1 playing a lesser, subsidiary role [21]. Our microarray data indicated that Notch3 was more highly expressed in whole ret-ina samples than in Notch1+cells at E14 and P0. We therefore reasoned that Notch3+cells and Notch1+cells may represent separate populations that may independently regulate ganglion cell differentiation. If Notch3, but not Notch1, significantly contributes to ganglion cell differ-entiation, then Notch3 deficiency should significantly affect the quantity of ganglion cells in the retina. To test this hypothesis, we used six-week-old Notch3 knockout (Notch3KO) ani-mals and wild type littermates. The retinas of these aniani-mals were collected, and whole retina flat-mounts were stained for the retinal ganglion cell (RGC) marker beta III Tubulin in order to quantify the number of RGCs in the ganglion cell layer (Fig 4A). We found that retinas of wild type mice contained higher numbers of RGCs than retinas of Notch3KO mice (1,721±85 cells/mm2vs. 1,474±67,P<0.05,Fig 4B). Therefore, retinas of wild type animals had 14%
(P<0.05) more RGCs than the retinas of Notch3KO mice. Since this number is relatively
small and Notch1 contributes to ganglion cell (RGC) fate specification, we suggested that the Notch1 signaling cascade may play a more significant role in RGC development than the Notch3 signaling cascade.
Discussion
The Notch family of receptors consists of four evolutionarily conserved, single-pass transmem-brane receptor proteins (Notch1, Notch2, Notch3, and Notch4) that play a critical role in reti-nal neurogenesis [8–11,21–25]. In the developing retina, members of the Notch family are involved in the maintenance of the RPC population, preventing neuronal differentiation until late stages [8–11,21–25]. Meanwhile, inhibition of Notch activity facilitates differentiation of RPCs into photoreceptors and ganglion cells, depending on the stage of retinal development
[8,21–24]. The details of the RPC decision-making mechanism that guides differentiation into
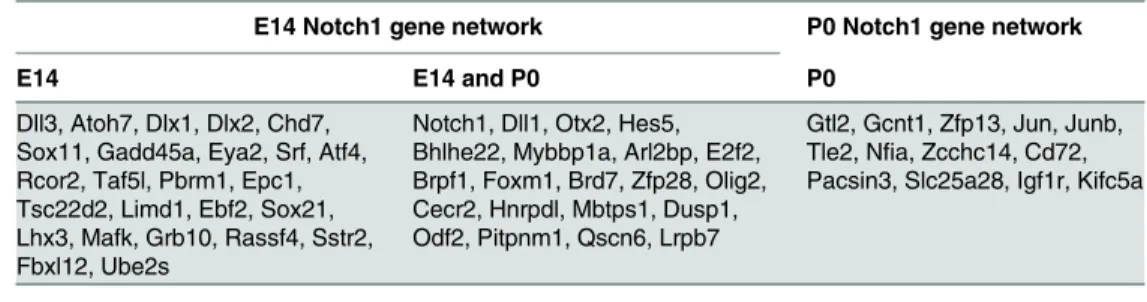
these retinal cell types, however, have never been clearly elucidated. To clarify this mechanism, Table 3. The putative members of E14 Notch1 and P0 Notch1 gene networks.
E14 Notch1 gene network P0 Notch1 gene network
E14 E14 and P0 P0
Dll3, Atoh7, Dlx1, Dlx2, Chd7, Sox11, Gadd45a, Eya2, Srf, Atf4, Rcor2, Taf5l, Pbrm1, Epc1, Tsc22d2, Limd1, Ebf2, Sox21, Lhx3, Mafk, Grb10, Rassf4, Sstr2, Fbxl12, Ube2s
Notch1, Dll1, Otx2, Hes5, Bhlhe22, Mybbp1a, Arl2bp, E2f2, Brpf1, Foxm1, Brd7, Zfp28, Olig2, Cecr2, Hnrpdl, Mbtps1, Dusp1, Odf2, Pitpnm1, Qscn6, Lrpb7
Gtl2, Gcnt1, Zfp13, Jun, Junb, Tle2, Nfia, Zcchc14, Cd72, Pacsin3, Slc25a28, Igf1r, Kifc5a
we focused on the Notch1 receptor, whose role in retinal neurogenesis has been studied inten-sively [8,21–24]. We separated Notch1 receptor-bearing cells (Notch1+cells) from retinas at early and late developmental stages and studied the expression profiles of those cells. Our hier-archical clustering of differentially expressed genes suggested that Notch1+cells at embryonic day 14 (E14, early stage of retinal development) may comprise a population of RPCs that are distinct from Notch1+cells at postnatal day 0 (P0, late stage of retinal development). We observed significant expression of key transcription factors (Atoh7 and Otx2) in E14 Notch1+ cells and high expression of only Otx2 in P0 Notch1+cells. These data suggested that E14 Notch1+cells are already predisposed to differentiate into ganglion cells and photoreceptors, since at E14 Atoh7 facilitates differentiation of RPCs into ganglion cells and Otx2 regulates RPC fate decision into cone photoreceptors [8,21,22,24]. Meanwhile, high levels of Otx2 expression in P0 Notch1+cells may predispose them to differentiate into rod photoreceptors and probably bipolar cells, since Otx2 regulates differentiation into these cell types at P0 [8,21,
22,24,28]. Because it was previously suggested that Notch3, but not Notch1, is primarily responsible for ganglion cell fate decision [21], we tested Notch3 expression in Notch1+cells and evaluated whether ablation of Notch3 significantly affects ganglion cell numbers in the adult retina. Our data suggested that Notch3+cells and Notch1+cells may comprise distinct RPC populations. Notch3 knockout leads to reduced numbers of ganglion cells in adult retinas. But since the difference between wild type and Notch3KO retinas was only 14% (P<0.05), we
suggested that Notch1 signaling may play a more important role than Notch3 signaling in gan-glion cell development at E14.
Notch signaling regulates the specification and differentiation of retinal cell types via a lat-eral inhibition mechanism, meaning that a cell fated to differentiate prevents differentiation of adjacent cells [8,9,11–14,21–24]. To implement lateral inhibition, Notch ligands can trans-activate Notch in adjacent cells and induce expression of repressors of neuronal differentiation, such as Hes1 and Hes5 [8,9,11–14,21–24]. Meanwhile, if Notch is not activated, absence of Hes1 and Hes5 expression permits expression of pro-neural transcription factors, which in turn induce neuronal-specific gene expression as well as expression of Notch ligands [8,9,11–
14,21–24]. Thus, a progenitor cell is predisposed to differentiate in the absence of Notch
Fig 4. Notch3 deficiency results in reduced ganglion cell numbers in the retina. A)Confocal images of flat-mounted retinas from Notch3 knockout (Notch3KO) animals and wild type (WT) littermates were collected. RGCs were labeled with beta III Tubulin antibodies for counting.B)Numbers of RGCs were compared between Notch3KO and WT animals. Values are means±SEM (*P<0.05, n = 10 eyes).
activity, but simultaneously prevents differentiation of adjacent cells due to its expression of Notch ligands. Our data indicate that Notch1+cells express Notch ligands Dll1, Dll3, and Dll4. However, Dll3 and Dll1 were more highly expressed than Dll4. More specifically, Dll3 expres-sion was higher than Dll1 at E14. Since our data indicated involvement of Notch1 signaling in the regulation of ganglion cell differentiation at E14 but not at P0, we can suggest that Dll3 may play an important role in the mechanism of ganglion cell differentiation. It should be noted, however, that Dll3 cannottrans-activate Notch signaling in neighboring cells [29,30]. But Dll3 does inhibit (viacis-inhibition) Notch signaling when expressed by Notch receptor-bearing cells [29,30]. We therefore speculate that Dll3 activity may affect ganglion cell fate dur-ing RPC differentiation. Meanwhile, Dll1 may be involved in photoreceptor differentiation (predominantly cones, as cones are the predominant phenotype at E14) during the early stage of retinal development, and may also facilitate rod photoreceptor and bipolar cell differentia-tion at the late developmental stage. Since Notch1 regulates neural/non-neural fate decisions based on Hes1 and Hes5 activity, we also paid attention to Hes1 and Hes5 expression in Notch1+cells at different stages of retinal development. We detected high expression of both genes in Notch1+cells at E14 and P0. However, expression of Hes5 was significantly higher than expression of Hes1. We also noted that while expression of Hes5 was up-regulated in Notch1+cells compared whole retina samples at both E14 and P0, expression of Hes1 in Notch1+cells was down-regulated compared to Hes1 expression in the whole retina samples. These data suggest that Hes5 may play a more important role than Hes1 in the Notch1 signal-ing cascade. Among the members of the Hes family, we would also like to pay attention to Hes6. Notch1+cells exhibited significantly higher expression of Hes6 than of Hes1 and Hes5. It is known that Hes6 inhibits Notch/Hes1/Hes5 activity to promote neural differentiation [20,
31]. Taking into account that we did not detect statistically significant differences in Hes6 expression between Notch1+cells and whole retina cell samples, we can suggest an important but not Notch1-specific role for Hes6 in retinal development.
and repressors of pro-neural differentiation. These oscillations prevent RPC differentiation, while the stabilization of gene expression facilitates RPC differentiation. Since the level of Atoh7 and Otx2 expression was thirtyfold higher than the level of Foxn4 in Notch1+cells at E14, we can expect that RPCs in which oscillations disappear will have consistently high Atoh7 and Otx2 expression compared to Foxn4 expression, and are therefore predisposed to differen-tiate into ganglion cells or photoreceptors at E14. At the same time, Notch1+cells at P0 are pre-disposed to differentiate into Otx2-lineage neurons, since expression of Otx2 in these RPCs is significantly higher compared to Atoh7 and Foxn4 expression. Importantly, since oscillations of gene expression are the result of gene-gene interactions (gene network activity), our study allows us to identify putative members of the Notch1 gene network. It should be noted, how-ever, that according to our data the Notch1 gene network at E14 differs from the Notch1 gene network at P0 (S4 TableandTable 3). Overall, the Notch1 gene network that contains Notch1, Dll3, Hes5, Atoh7, and Otx2 should regulate differentiation of ganglion cells and photorecep-tors (predominantly cones) at the early stage of retinal development, while the Notch1 gene network containing Notch1, Dll1, Hes5, and Otx2 should affect photoreceptor (predominantly rods) and probably bipolar cell fate specification at the late stage of retinal development. The structure and dynamics of these gene networks are still not clear, and will require detailed future investigation to be elucidated. Our findings may serve as the foundation for such a study.
It was shown previously that Notch1 signaling regulates photoreceptor development at early and late stages of retinal development [21,22,24]. However, while a role of Notch1 in the regulation of ganglion cell fate was suggested, it was believed that Notch3 was primarily responsible for ganglion cell fate specification [21]. The best way to evaluate the respective roles of Notch1 and Notch3 in retinal development was to study the numbers of ganglion cells in wild type animals and gene knockouts. Unfortunately, the early embryonic lethality of Notch1-knockout mice and complexity of the Notch1 gene network (which can regulate devel-opment of many retinal cell types) created significant difficulties for evaluating the role of Notch1 in ganglion cell differentiation. Conversely, Notch3 knockout animals (Notch3KO) were viable and fertile, enabling us to use these animals in our study. We conjectured that the detected contribution of Notch3 in ganglion cell development would allow us to simultaneously evaluate the role of Notch1. Our expression data suggested that Notch3+cells may comprise a population distinct from the Notch1+cell population, and could therefore independently regu-late ganglion cell differentiation. Results of ganglion cell counting in Notch3KO animals and wild type littermates revealed reduced numbers of ganglion cells in Notch3-deficient animals compared to wild type controls. This reduction was not extremely impressive (14%,P<0.05),
regulate the development of other neuronal types in retina. In this regard, reduced numbers of ganglion cells in Notch3KO retinas could mean preferential differentiation into amacrine and horizontal cells at the expense of ganglion cells. Regardless of whether Notch3 activates or inhib-its ganglion cell development, the high Atoh7 expression in Notch1+cells and low ganglion cell reduction in Notch3KO animals together suggest that the role of Notch1 signaling in ganglion cell fate specification should be important. Finally, we also evaluated expression of Notch2 and Notch4. Our data and the literature indicate that Notch2 levels in the developing retina are almost non-detectable [26,27]. Meanwhile, we detected Notch4 expression in both Notch1+ cells and in whole retina samples, although Notch4 levels were significantly lower in comparison to Notch1 and Notch3. Notch4 is best known as a receptor primarily expressed in the vascula-ture and responsible for the regulation of vessel growth in the retina [25]. In total, these data suggest that the roles of Notch2 and Notch4 in retinal neurogenesis are less likely to be significant.
Conclusions
The entire set of our data, the existing literature, and the“oscillatory”model of Notch-Dll lateral inhibition allow us to take a fresh look at Notch1 signaling in the developing retina. In general, Notch1 signaling is a gene network that contains progenitor markers (like Notch1 and Hes5) and pro-neural markers (like Atoh7 and Otx2). Expression of all of these genes should oscillate in RPCs, allowing these cells to maintain an undifferentiated state and proliferate. Nevertheless, RPCs are already predisposed to differentiate into particular retinal cell types when Notch1 inhibitory activity disappears. Our data suggest that at the early stage of retinal development the Notch1 gene network contains at least Notch1, Dll3, Hes5, Atoh7, and Otx2 (Table 4). This net-work may direct RPCs to differentiate into photoreceptors (cones) and ganglion cells. Mean-while, the Notch1 gene network at the late stage of retinal development contains at least Notch1, Dll1, Hes5, and Otx2, and therefore may promote RPC differentiation into photoreceptors (rods) and probably bipolar cells. We cannot rule out that, at different stages of retinal develop-ment, the Notch1 gene network can contain different pro-neural markers that may direct RPC differentiation into distinct neuronal cell types (for example, Foxn4 lineage). The reconstruction of such gene networks and the crosstalk between them during retinal development could signifi-cantly change our views on the mechanisms of retinal neurogenesis.
Material and Methods
Animals
All experiments were performed in compliance with the National Institutes of Health (NIH) Guide for the Care and Use of Laboratory Animals and the Association for Research in Vision and Ophthalmology (ARVO) statement for use of animals in ophthalmic and vision research. The protocol was approved by the Institutional Animal Care and Use Committee (IACUC) of the University of Miami (Permit Number: 12–068). Notch3 knockout animals (stock number 023807) and C57BL/6 J (stock number 000664) mice were obtained from Jackson Laboratory (Bar Harbor, Maine, United States). Mice were housed under standard conditions of tempera-ture and humidity, with a 12-hour light to dark cycle and free access to food and water.
Isolation of Notch1
+cells
CO2-independent medium was removed and replaced with the papain solution (8 U/mL of papain [Worthington Biochemicals, Lakewood, NJ] and 124 U/ml of DNAse I [Sigma-Aldrich, St. Louis, MO] in DPBS [Life Technologies, Grand Island, NY], with pH adjusted to 7.4). The retinas were incubated in the papain solution for 20 minutes at 37°C. After incubating the reti-nas, the old papain solution was removed and the retinas were rinsed with low ovomucoid solution (1.5 mg/ml of trypsin inhibitor ovomucoid [Worthington Biochemicals, Lakewood, NJ], 1.5 mg/ml of BSA [Sigma-Aldrich, St. Louis, MO], and 124 U/ml of DNAse I in DPBS, with pH adjusted to 7.4). The pieces were allowed to settle, and the rinse solution was removed. The tissue was then triturated sequentially with a 1 ml pipette in the low ovomucoid solution until the retinas were completely broken up. The retinal cell suspension resulting from the trit-uration was spun at 300 g for 10 minutes to separate the retinal cells from the low ovomucoid solution. The supernatant was discarded, and the cells were then resuspended in high ovomu-coid solution (10 mg/ml of trypsin inhibitor ovomuovomu-coid and 10 mg/ml of BSA in DPBS, pH was adjusted to 7.4). The retinal cell suspension was spun at 300 g for 10 minutes, the superna-tant was discarded, and the cells were resuspended in MACS buffer containing 0.5% BSA and 2 mM EDTA in PBS (pH 7.2). Viability was assessed by trypan blue exclusion, and was found to be greater than 97%.
To isolate Notch1+cells, we used monoclonal biotin conjugated Notch1 mouse anti-bodies (130-096-557, Miltenyi Biotec, Auburn, CA) and followed a protocol for immunomag-netic separation provided by Miltenyi Biotec (Auburn, CA). Briefly, the retinal cell number was first determined. The retinal cell suspension was then spun at 300g for 10 minutes, resuspended at up to 107nucleated cells per 100μl of MACS buffer and 10μl of the anti-Notch1 antibody, Table 4. List of RT-PCR primers.
Gene Oligonucleotides
Notch1 Forward TGTTGTGCTCCTGAAGAACG
Reverse GTGGGAGACAGAGTGGGTGT
Notch3 Forward CTGTGCTACAGCCGTGTGTT
Reverse ATTCACACACCGACCCAAAT
Hes1 Forward ACACCGGACAAACCAAAGAC
Reverse GTCACCTCGTTCATGCACTC
Hes5 Forward CAAGGAGAAAAACCGACTGC
Reverse GTGCAGGGTCAGGAACTGTA
Hes6 Forward CGGATCAACGAGAGTCTTCAG
Reverse GGCATGGATTCTAGCAGGTG
Atoh7 Forward ATGAAGTCGGCCTGCAAAC
Reverse GGTGAGCGCGATGATGTAG
Otx2 Forward GGGCTGAGTCTGACCACTTC
Reverse GGCCTCACTTTGTTCTGACC
Dll3 Forward GGTCCCTGTCTCCACCAGTA
Reverse TGGGCAATGACAGACATAGG
Fgf15 Forward GCTGGTCCCTATGTCTCCAA
Reverse GGAGATGGTGCTTCATGGAT
Egr1 Forward TCACCCACCATGGACAACTA
Reverse GGGATAACTCGTCTCCACCA
Actb Forward CACCCTGTGCTGCTCACC
Reverse GCACGATTTCCCTCTCAG
and incubated for 10 minutes in the refrigerator (2-8°C) in the dark. The retinal cell suspension was washed two times by adding MACS buffer and centrifuged at 300g for 10 minutes, resus-pended at up to 107nucleated cells per 80μl of MACS buffer and 20μl of the anti-biotin microbeads (130-090-485, Miltenyi Biotec, Auburn, CA), then incubated for 15 minutes in the refrigerator in the dark. The cells were washed two times as above, resuspended at up to 108 nucleated cells per 500μl of MACS buffer, and used for magnetic separation of the Notch1+ cells on a pre-equilibrated column in the presence of a magnetic field according to the manu-facturer's protocol (Miltenyi Biotech, Auburn, CA).
RNA extraction, probe preparation, and array hybridization
RNA samples were extracted from whole retina and Notch1+cells using the Absolutely RNA Nanoprep kit (Agilent Technologies, Santa Clara, CA). RNA samples were sent to Ocean Ridge Biosciences (ORB, Palm Beach Gardens, FL) for analysis using mouse exonic evidence-based oligonucleotide (MEEBO) microarrays (Lot 20918). MEEBO microarrays were printed by Microarrays Inc. (Huntsville, AL) and contained 38,083 70-mer oligonucleotide probes com-plementary to constitutive exons of most mouse genes, as well as alternatively spliced exons and control sequences. For more information on the MEEBO oligonucleotide set please refer
tohttp://alizadehlab.stanford.edu/heebo.html. Biotin-labeled complementary RNA was made
from total RNA according to Van Gelder’s protocol [41]. Biotinylated complementary RNA samples were fragmented, diluted in a formamide-containing hybridization buffer, and loaded on to the Mouse Exonic Evidence Based Oligonucleotide (MEEBO) microarray slides enclosed in custom hybridization chambers (for more information on the MEEBO oligonucleotide set please refer tohttp://alizadehlab.stanford.edu/). The slides were hybridized for 16–18 hours in a Model 400 hybridization oven (Scigene, Sunnyvale, CA). After hybridization, the microarray slides were washed under stringent conditions, stained with Streptavidin-Alexa-647 (Invitro-gen, Carlsbad, CA), and scanned using an Axon GenePix 4000B scanner (Molecular Devices, Sunnyvale, CA).
Microarray data analysis
Spot intensities for each probe were calculated by subtracting median local background from median local foreground for each spot. The spot intensities were then normalized. After removing data for low quality spots, the mouse probes’intensities were filtered to identify all probes with intensity above a normalized threshold. For statistical analysis, microarray data were examined for differences by One-way ANOVA or Student's t-test. Values ofP<0.05
were designated as statistically significant. The data files have been uploaded in the NCBI Gene Expression Omnibus (GEO,http://www.ncbi.nlm.nih.gov/geo/) and are available through GEO series accession number GSE65977. Hierarchical cluster analysis (hierarchical clustering) was performed using Gene Cluster 3.0. To this end, Log2-transformed, significant (F>F
crit = 3.708) mouse probes were loaded into Gene Cluster 3.0. The data were adjusted by cen-tering genes (median). Cluscen-tering was performed using centered correlation as a distance mea-sure and average linkage as the method. TreeView Software was used to visualize clustering results.
Quantitative RT-PCR analysis
cDNA. Quantitative PCR was then performed (Rotor-Gene Q, Qiagen, Valencia, CA) using a kit (SYBR GREEN PCR MasterMix; Qiagen, Valencia, CA). Relative expression was calculated by comparison with a standard curve following normalization to expression of the housekeep-ing geneβ-actin (Actb), chosen as a control. Data are presented as average ± SEM. Quantitative RT-PCR measurements were analyzed with Student's t-test. Values of P<0.05 were designated
as statistically significant.
Immunocytochemistry
Notch1+cells were placed on cover slips, fixed after 30 minutes in 4% PF, and blocked with 5% normal donkey serum with 0.15% Tween-20 in PBS at pH 7.4. Cells were then incubated with Notch1 primary antibody (130-101-868, Miltenyi Biotec Inc., San Diego, CA) followed by spe-cies-specific secondary fluorescent antibodies (Invitrogen, Carlsbad, CA). Negative controls were incubated with secondary antibodies only. Imaging was performed with a confocal micro-scope (Leica TSL AOBS SP5; Leica Microsystems). Propidium iodide (PI) was used to visualize the nucleus of the cell. Individual cover slips were sampled randomly to collect a total of 10 images using a 20X objective lens. The Notch1 positive cells and PI positive cells (the total number of cells) were counted using ImageJ software. The percentage of Notch1 positive cells relative to the total number of cells was determined.
Immunohistochemistry for beta III tubulin and counting of ganglion cell
layer (GCL) neurons
Immunohistochemistry for beta III tubulin was performed as described previously [44]. Briefly, eyes were enucleated upon euthanasia and fixed in a 4% PF. The retinas were removed after 1 hour and cryoprotected overnight in 30% sucrose. The following day, the retinas underwent 3 freeze–thaw cycles, were rinsed in 0.1 M Tris buffer, blocked (5% donkey serum and 0.1% Tri-ton X-100 in 0.1 M Tris buffer) for 1 hour, and were then incubated overnight with beta III Tubulin antibody (1:250; Covance, Denver, PA). After rinsing in 0.1 M Tris buffer, the retinas were flatmounted and coverslipped. Beta III Tubulin-positive GCL neurons were imaged by confocal microscopy. Individual retinas were sampled randomly to collect a total of 20 images from four retinal quadrants. Beta III Tubulin-positive GCL neurons were counted using ImageJ software.
Supporting Information
S1 Table. The results of microarray analysis revealed a total of 6,301 genes, which passed the quality control criteria and One-Way ANOVA test (F>Fcrit. = 3.708).
(XLSX)
S2 Table. Our findings suggested that Notch1+cells at E14 and P0 may comprise two dis-tinct cell populations.We identified 1,185 genes that were preferentially expressed in the E14 Notch1+cells and 740 genes preferentially expressed in the P0 Notch1+cells using a Student's T-test and twofold cut-off level.
(XLSX)
S3 Table. The expression of retinal cell markers in Notch1+progenitor cells and in whole retina samples was detected at E14 and P0.
(XLSX)
either E14 Notch1+cells or P0 Notch1+cells that was ten times greater than the threshold level; 2) expression in either E14 Notch1+cells or P0 Notch1+cells that was two times greater than expression levels in whole retina samples of the same developmental stage. We used the milder conditions and selected transcription factors (TFs) with statistically significantly higher expres-sion in either E14 Notch1+cells or P0 Notch1+cells than in whole retinas of the same develop-mental stage.
(XLSX)
Acknowledgments
The authors thank Gabriel Gaidosh, and Jasmine R. Naik for their expert assistance.
Author Contributions
Conceived and designed the experiments: GD DP DI. Performed the experiments: GD IP SP AFB DD XD. Analyzed the data: DP DI. Wrote the paper: SP DP DI.
References
1. Retinal Diseases and VISION 2020. Community eye health / International Centre for Eye Health. 2003; 16(46):19–20. PMID:17491850; PubMed Central PMCID: PMC1705858.
2. Rosenberg EA, Sperazza LC. The visually impaired patient. American family physician. 2008; 77 (10):1431–6. PMID:18533377.
3. Akpek EK, Smith RA. Overview of age-related ocular conditions. The American journal of managed care. 2013; 19(5 Suppl):S67–75. PMID:23725498.
4. Sasai Y. Grow your own eye: biologists have coaxed cells to form a retina, a step toward growing replacement organs outside the body. Scientific American. 2012; 307(5):44–9. PMID:23120894.
5. Nakano T, Ando S, Takata N, Kawada M, Muguruma K, Sekiguchi K, et al. Self-formation of optic cups and storable stratified neural retina from human ESCs. Cell stem cell. 2012; 10(6):771–85. doi:10.
1016/j.stem.2012.05.009PMID:22704518.
6. Eiraku M, Takata N, Ishibashi H, Kawada M, Sakakura E, Okuda S, et al. Self-organizing optic-cup mor-phogenesis in three-dimensional culture. Nature. 2011; 472(7341):51–6. doi:10.1038/nature09941
PMID:21475194.
7. Zhong X, Gutierrez C, Xue T, Hampton C, Vergara MN, Cao LH, et al. Generation of three-dimensional retinal tissue with functional photoreceptors from human iPSCs. Nature communications. 2014; 5:4047. doi:10.1038/ncomms5047PMID:24915161.
8. Xiang M. Intrinsic control of mammalian retinogenesis. Cellular and molecular life sciences: CMLS. 2013; 70(14):2519–32. doi:10.1007/s00018-012-1183-2PMID:23064704; PubMed Central PMCID:
PMC3566347.
9. Ohsawa R, Kageyama R. Regulation of retinal cell fate specification by multiple transcription factors. Brain research. 2008; 1192:90–8. doi:10.1016/j.brainres.2007.04.014PMID:17488643.
10. Cepko C. Intrinsically different retinal progenitor cells produce specific types of progeny. Nature reviews Neuroscience. 2014; 15(9):615–27. doi:10.1038/nrn3767PMID:25096185.
11. Koch U, Lehal R, Radtke F. Stem cells living with a Notch. Development. 2013; 140(4):689–704. doi:
10.1242/dev.080614PMID:23362343.
12. Kageyama R, Niwa Y, Shimojo H, Kobayashi T, Ohtsuka T. Ultradian oscillations in Notch signaling regulate dynamic biological events. Current topics in developmental biology. 2010; 92:311–31. doi:10.
1016/S0070-2153(10)92010-3PMID:20816400.
13. Shimojo H, Ohtsuka T, Kageyama R. Oscillations in notch signaling regulate maintenance of neural progenitors. Neuron. 2008; 58(1):52–64. doi:10.1016/j.neuron.2008.02.014PMID:18400163.
14. Kageyama R, Ohtsuka T, Shimojo H, Imayoshi I. Dynamic Notch signaling in neural progenitor cells and a revised view of lateral inhibition. Nature neuroscience. 2008; 11(11):1247–51. doi:10.1038/nn.
2208PMID:18956012.
15. Isomura A, Kageyama R. Ultradian oscillations and pulses: coordinating cellular responses and cell fate decisions. Development. 2014; 141(19):3627–36. doi:10.1242/dev.104497PMID:25249457;
16. Imayoshi I, Kageyama R. Oscillatory control of bHLH factors in neural progenitors. Trends in neurosci-ences. 2014; 37(10):531–8. doi:10.1016/j.tins.2014.07.006PMID:25149265.
17. Imayoshi I, Isomura A, Harima Y, Kawaguchi K, Kori H, Miyachi H, et al. Oscillatory control of factors determining multipotency and fate in mouse neural progenitors. Science. 2013; 342(6163):1203–8. doi:
10.1126/science.1242366PMID:24179156.
18. Chiodini F, Matter-Sadzinski L, Rodrigues T, Skowronska-Krawczyk D, Brodier L, Schaad O, et al. A positive feedback loop between ATOH7 and a Notch effector regulates cell-cycle progression and neu-rogenesis in the retina. Cell reports. 2013; 3(3):796–807. doi:10.1016/j.celrep.2013.01.035PMID:
23434507.
19. Muranishi Y, Terada K, Inoue T, Katoh K, Tsujii T, Sanuki R, et al. An essential role for RAX homeopro-tein and NOTCH-HES signaling in Otx2 expression in embryonic retinal photoreceptor cell fate determi-nation. The Journal of neuroscience: the official journal of the Society for Neuroscience. 2011; 31 (46):16792–807. doi:10.1523/JNEUROSCI.3109-11.2011PMID:22090505.
20. Nelson BR, Hartman BH, Ray CA, Hayashi T, Bermingham-McDonogh O, Reh TA. Acheate-scute like 1 (Ascl1) is required for normal delta-like (Dll) gene expression and notch signaling during retinal devel-opment. Developmental dynamics: an official publication of the American Association of Anatomists. 2009; 238(9):2163–78. doi:10.1002/dvdy.21848PMID:19191219; PubMed Central PMCID:
PMC2905851.
21. Riesenberg AN, Liu Z, Kopan R, Brown NL. Rbpj cell autonomous regulation of retinal ganglion cell and cone photoreceptor fates in the mouse retina. The Journal of neuroscience: the official journal of the Society for Neuroscience. 2009; 29(41):12865–77. doi:10.1523/JNEUROSCI.3382-09.2009PMID:
19828801; PubMed Central PMCID: PMC2788434.
22. Jadhav AP, Mason HA, Cepko CL. Notch 1 inhibits photoreceptor production in the developing mam-malian retina. Development. 2006; 133(5):913–23. doi:10.1242/dev.02245PMID:16452096.
23. Jadhav AP, Cho SH, Cepko CL. Notch activity permits retinal cells to progress through multiple progeni-tor states and acquire a stem cell property. Proceedings of the National Academy of Sciences of the United States of America. 2006; 103(50):18998–9003. doi:10.1073/pnas.0608155103PMID:
17148603; PubMed Central PMCID: PMC1682012.
24. Mizeracka K, DeMaso CR, Cepko CL. Notch1 is required in newly postmitotic cells to inhibit the rod photoreceptor fate. Development. 2013; 140(15):3188–97. doi:10.1242/dev.090696PMID:23824579;
PubMed Central PMCID: PMC3931735.
25. James AC, Szot JO, Iyer K, Major JA, Pursglove SE, Chapman G, et al. Notch4 reveals a novel mecha-nism regulating Notch signal transduction. Biochimica et biophysica acta. 2014; 1843(7):1272–84. doi:
10.1016/j.bbamcr.2014.03.015PMID:24667410.
26. Lindsell CE, Boulter J, diSibio G, Gossler A, Weinmaster G. Expression patterns of Jagged, Delta1, Notch1, Notch2, and Notch3 genes identify ligand-receptor pairs that may function in neural develop-ment. Molecular and cellular neurosciences. 1996; 8(1):14–27. doi:10.1006/mcne.1996.0040PMID:
8923452.
27. Zhu MY, Gasperowicz M, Chow RL. The expression of NOTCH2, HES1 and SOX9 during mouse reti-nal development. Gene expression patterns: GEP. 2013; 13(3–4):78–83. doi:10.1016/j.gep.2012.12.
001PMID:23277114.
28. Wang S, Sengel C, Emerson MM, Cepko CL. A gene regulatory network controls the binary fate deci-sion of rod and bipolar cells in the vertebrate retina. Developmental cell. 2014; 30(5):513–27. doi:10.
1016/j.devcel.2014.07.018PMID:25155555.
29. Ladi E, Nichols JT, Ge W, Miyamoto A, Yao C, Yang LT, et al. The divergent DSL ligand Dll3 does not activate Notch signaling but cell autonomously attenuates signaling induced by other DSL ligands. The Journal of cell biology. 2005; 170(6):983–92. doi:10.1083/jcb.200503113PMID:16144902; PubMed
Central PMCID: PMC2171428.
30. Chapman G, Sparrow DB, Kremmer E, Dunwoodie SL. Notch inhibition by the ligand DELTA-LIKE 3 defines the mechanism of abnormal vertebral segmentation in spondylocostal dysostosis. Human molecular genetics. 2011; 20(5):905–16. doi:10.1093/hmg/ddq529PMID:21147753.
31. Bae S, Bessho Y, Hojo M, Kageyama R. The bHLH gene Hes6, an inhibitor of Hes1, promotes neuronal differentiation. Development. 2000; 127(13):2933–43. PMID:10851137.
32. Wang R, Liu K, Chen L, Aihara K. Neural fate decisions mediated by trans-activation and cis-inhibition in Notch signaling. Bioinformatics. 2011; 27(22):3158–65. doi:10.1093/bioinformatics/btr551PMID:
21994231.
34. Nieto M, Schuurmans C, Britz O, Guillemot F. Neural bHLH genes control the neuronal versus glial fate decision in cortical progenitors. Neuron. 2001; 29(2):401–13. PMID:11239431.
35. Hatakeyama J, Kageyama R. Notch1 expression is spatiotemporally correlated with neurogenesis and negatively regulated by Notch1-independent Hes genes in the developing nervous system. Cerebral cortex. 2006; 16 Suppl 1:i132–7. doi:10.1093/cercor/bhj166PMID:16766699.
36. Hatakeyama J, Bessho Y, Katoh K, Ookawara S, Fujioka M, Guillemot F, et al. Hes genes regulate size, shape and histogenesis of the nervous system by control of the timing of neural stem cell differen-tiation. Development. 2004; 131(22):5539–50. doi:10.1242/dev.01436PMID:15496443.
37. Hammerle B, Tejedor FJ. A novel function of DELTA-NOTCH signalling mediates the transition from proliferation to neurogenesis in neural progenitor cells. PloS one. 2007; 2(11):e1169. doi:10.1371/ journal.pone.0001169PMID:18000541; PubMed Central PMCID: PMC2064965.
38. Nelson BR, Reh TA. Relationship between Delta-like and proneural bHLH genes during chick retinal development. Developmental dynamics: an official publication of the American Association of Anato-mists. 2008; 237(6):1565–80. doi:10.1002/dvdy.21550PMID:18435466.
39. Guillemot F, Joyner AL. Dynamic expression of the murine Achaete-Scute homologue Mash-1 in the developing nervous system. Mechanisms of development. 1993; 42(3):171–85. PMID:8217843.
40. Rusanescu G, Mao J. Notch3 is necessary for neuronal differentiation and maturation in the adult spinal cord. Journal of cellular and molecular medicine. 2014; 18(10):2103–16. doi:10.1111/jcmm.12362
PMID:25164209; PubMed Central PMCID: PMC4244024.
41. Van Gelder RN, von Zastrow ME, Yool A, Dement WC, Barchas JD, Eberwine JH. Amplified RNA syn-thesized from limited quantities of heterogeneous cDNA. Proceedings of the National Academy of Sci-ences of the United States of America. 1990; 87(5):1663–7. PMID:1689846; PubMed Central PMCID:
PMC53542.
42. Dvoriantchikova G, Santos AR, Danek D, Dvoriantchikova X, Ivanov D. The TIR-domain-containing adapter inducing interferon-beta-dependent signaling cascade plays a crucial role in ischemia-reperfu-sion-induced retinal injury, whereas the contribution of the myeloid differentiation primary response 88-dependent signaling cascade is not as pivotal. The European journal of neuroscience. 2014; 40 (3):2502–12. doi:10.1111/ejn.12603PMID:24754835; PubMed Central PMCID: PMC4122625.
43. Ivanov D, Dvoriantchikova G, Barakat DJ, Nathanson L, Shestopalov VI. Differential gene expression profiling of large and small retinal ganglion cells. Journal of neuroscience methods. 2008; 174(1):10–7.
doi:10.1016/j.jneumeth.2008.06.016PMID:18640154; PubMed Central PMCID: PMC4133941.