Vent Food Webs: Influences of Chemistry, Microbiology
and Predation on Trophodynamics
William D. K. Reid1*, Christopher J. Sweeting1, Ben D. Wigham2, Katrin Zwirglmaier3¤, Jeffrey A. Hawkes4, Rona A. R. McGill5, Katrin Linse3, Nicholas V. C. Polunin1
1School of Marine Science and Technology, Newcastle University, Newcastle upon Tyne, United Kingdom,2Dove Marine Laboratory, School of Marine Science and Technology, Newcastle University, Cullercoats, United Kingdom, 3British Antarctic Survey, Natural Environment Research Council, High Cross, Madingley Road, Cambridge, United Kingdom,4Ocean and Earth Science, University of Southampton, National Oceanography Centre Southampton, Southampton, United Kingdom, 5Natural Environment Research Council Life Sciences Mass Spectrometry Facility, Scottish Universities Environmental Research Centre, East Kilbride, United Kingdom
Abstract
The hydrothermal vents on the East Scotia Ridge are the first to be explored in the Antarctic and are dominated by large peltospiroid gastropods, stalked barnacles (Vulcanolepas sp.) and anomuran crabs (Kiwa sp.) but their food webs are unknown. Vent fluid and macroconsumer samples were collected at three vent sites (E2, E9N and E9S) at distances of tens of metres to hundreds of kilometres apart with contrasting vent fluid chemistries to describe trophic interactions and identify potential carbon fixation pathways using stable isotopes.d13C of dissolved inorganic carbon from vent fluids ranged from 24.6% to 0.8% at E2 and from 24.4% to 1.5% at E9. The lowest macroconsumerd13C was observed in peltospiroid gastropods (230.0% to 231.1%) and indicated carbon fixation via the Calvin-Benson-Bassham (CBB) cycle by endosymbiotic gamma-Proteobacteria. Highestd13C occurred in Kiwa sp. (219.0% to 210.5%), similar to that of the epibionts sampled from their ventral setae.Kiwasp.d13C differed among sites, which were attributed to spatial differences in the epibiont community and the relative contribution of carbon fixed via the reductive tricarboxylic acid (rTCA) and CBB cycles assimilated byKiwa sp. Site differences in carbon fixation pathways were traced into higher trophic levels e.g. a stichasterid asteroid that predates onKiwasp. Sponges and anemones at the periphery of E2 assimilated a proportion of epipelagic photosynthetic primary production but this was not observed at E9N. Differences in thed13C andd34S values of vent macroconsumers between E2 and E9 sites suggest the relative contributions of photosynthetic and chemoautotrophic carbon fixation (rTCA v CBB) entering the hydrothermal vent food webs vary between the sites.
Citation:Reid WDK, Sweeting CJ, Wigham BD, Zwirglmaier K, Hawkes JA, et al. (2013) Spatial Differences in East Scotia Ridge Hydrothermal Vent Food Webs: Influences of Chemistry, Microbiology and Predation on Trophodynamics. PLoS ONE 8(6): e65553. doi:10.1371/journal.pone.0065553
Editor:Simon Thrush, National Institute of Water & Atmospheric Research, New Zealand
ReceivedFebruary 7, 2013;AcceptedApril 25, 2013;PublishedJune 7, 2013
Copyright:ß2013 Reid et al. This is an open-access article distributed under the terms of the Creative Commons Attribution License, which permits unrestricted use, distribution, and reproduction in any medium, provided the original author and source are credited.
Funding:The research was funded by the Natural Environment Research Council (NERC) through ChEsSO consortium grant NE/DO1249X/1 and studentships NE/ F010664/1 (WDKR) and NE/H524922 (JAH). Sample analysis was funded via NERC Life Sciences Mass Spectrometry Facilities grant LSMSFBRIS043_04/10_R_09/10. The funders had no role in the study design, data collection and anlaysis, decision to publish, or preparation of the manuscript.
Competing Interests:The authors have declared that no competing interests exist.
* E-mail: [email protected]
¤ Current address: Technische Universitaet Muenchen, Wissenschaftszentrum Weihenstephan, Limnologische Station Iffeldorf, Iffeldorf, Germany
Introduction
Deep-sea hydrothermal vents are chemically reducing habitats occurring on mid-ocean and back-arc spreading centres, sea-mounts, volcanic hotspots and off-axis ridge settings [1,2,3]. They are distinct from the surrounding deep sea with respect to environmental conditions, the energy sources sustaining life and their biological communities [4,5]. High densities of organisms are found to thrive at the interface where hot, mineral-rich fluids discharge from the seafloor and mix with colder, oxygenated seawater. The hot fluids emitted from the seafloor may differ in pH and are enriched in reduced gases (e.g. H2S, CH4, H2) and
metals (e.g. Fe2+, Cu, Mn) relative to seawater [6].
Microorgan-isms oxidise the reduced species in vent fluids and utilise the energy released to fix CO2or other single carbon compounds (e.g.
CO, CH4) into cellular material [7]. This results in microbial
chemosynthesis replacing photosynthetic primary production at the base of the food chain [7].
Sulfide oxidation appears to be the principal energy acquisition pathway, which microorganisms use to drive carbon fixation [3,7,8]. The most important carbon fixation pathways at the base of the metazoan hydrothermal vent food webs are the Calvin-Benson-Bassham (CBB) and reductive tricarboxylic acid (rTCA) cycles [9,10,11]. Methane oxidation (methanotrophy) is a further carbon fixation process at hydrothermal vents with CH4 of
The relative contributions of different carbon sources and complexity of hydrothermal vent food webs vary globally depending on the species present, the geological host substrate and the vent fluid chemistry [17,18,19]. The first Antarctic hydrothermal vent communities were discovered recently on the East Scotia Ridge (ESR), a back-arc spreading centre in the Atlantic sector of the Southern Ocean [20,21]. The two basalt-hosted vent fields occur on the ridge segments E2 and E9, which lack the characteristic alvinocarid shrimps, bathymodiolid mussels and siboglinid worms found at Atlantic, Indian and Pacific hydrothermal vents, respectively [21]. Instead, biomass at the ESR vents is dominated by anomuran crabs (Kiwasp.), stalked barnacles (Vulcanolepassp.) and large peltospiroid gastropods [22], indicating a new biogeographic province [21]. Furthermore, there are differences in the end-member vent fluid chemistry between the E2 and E9 vent fields as well as within field between northern (E9N) and southern (E9S) areas of E9 [21].
Stable isotopes of carbon (13C/12C expressed asd13C), nitrogen (15N/14N expressed asd15N) and sulfur (34S/32S expressed asd34S) have been used to examine hydrothermal vent community trophodynamics [23,24]. d13C can be used to characterise the various carbon sources utilised by vent macroconsumers [25]. This is done by comparing the expected carbon fractionation between dissolved inorganic carbon (DIC) and the macroconsumer’s tissue. Enzymatic reactions catalysed by the ribulose-1,5-biphosphate carboxylase/oxygenase form I (RuBisCO form I) of the CBB cycle (22%to 30%: [26,27,28]) exhibit greater fractionation than those of the rTCA cycle (2% to 14%: [29,30,31]). Once organic material is incorporated into the macroconsumer food web, carbon trophic discrimination (D13
C) is small, ranging from 0 to 1.5% between the food source and consumer [32]. d34
S also identifies energy sources (sulfur trophic discrimination, 21% to 2%: [32]). The large difference ind34
S between seawater sulphate and sulfides at hydrothermal vents [33] results in organic matter of photosynthetic (,16% to 19%) and chemosynthetic (29% to 10%) origin having distinctive d34
S values [34,35]. The greater trophic discrimination (2%to 5%) ind15
N between consumer and food source provides information on the trophic position of an organism relative to a primary consumer [32]. Therefore, the isotopic value of a vent macroconsumer is the product of the following factors: (1) the inorganic substrate and its isotopic value used by the chemoautotroph; (2) the isotopic discrimination processes occurring during metabolic reactions involving inorganic substrates to create organic compounds (e.g. CBB or rTCA cycles) by the chemoautotroph; (3) food source-macroconsumer trophic interactions (e.g. endosymbiont-host, predator-prey) that occur as a function of (1) and (2); and (4) the physiology associated with the macroconsumer’s isotopic trophic discrimination.
The goal of the present research was to investigate intra- and inter-site patterns in the trophic assemblages of macroconsumers occurring at hydrothermal vents on the ESR usingd13C,d34S and
d15N. Specifically, the aims were to: (1) compared13CDICamong
vent sites and thus establish difference in the isotopic inorganic substrates used by chemoautotrophs; (2) compared13C,d15N and
d34S between vent and benthic non-vent fauna to assess any photosynthetic inputs into the hydrothermal vent food web; (3) investigate differences in trophic structures among the three sites; and (4) assess which species are driving any differences in trophic structure. The investigation provides a unique opportunity to examine differences in trophic structure at the scale of tens of metres to 100s of kilometres in a newly discovered hydrothermal vent biogeographical province.
Materials and Methods
Ethics Statement
Permits for the fieldwork were granted by the United Kingdom Foreign and Commonwealth Office. This study met the ethical requirements of the affiliated research institutions for research utilising animal tissues. No animal husbandry or laboratory controlled experiments were part of the research that required permits from the UK Home Office. The fish were collected at a water depth of 2500 m, which meant that they were dead when they arrived on deck as a result of changes in pressure. This was the case with the majority of the animals dissected within this study. The research also adhered to the Inter Ridge code of conduct for sampling hydrothermal vents (http://www.interridge. org/IRStatement).
Study Sites
The E2 and E9 vent fields are situated approximately 440 km apart at 56u05.359S, 30u19.209W and 60u02.509S, 29u58.939
W, respectively (Fig. 1). E2 is at a depth of,2600 m and seafloor topography is complex with a series of terraced features and lobed pillow basalts filling a major north-south steep-sided fissure [21]. The main high-temperature and diffusive venting occurred at an intersection between this fissure and an east-west running fault or scarp [21]. E9 was located at,2400 m depth and its topography was relatively flat with sheet lava, a series of lava drain back features and collapsed pillow basalts. A series of north-south fissures were found with venting mainly occurring on the most western [21,22]. The end-member fluid chemistry exiting chim-neys differed between the northern and southern sections of E9 [21], therefore E9N and E9S are here considered to be separate sites. Ambient seabed water temperatures were 0.0uC at E2 and between20.1uC and21.3uC at E9 [21].
Sample Collection and Ship-board Processing
Samples were collected onboard the R.R.S James Cook during the 2010 austral summer (7 January to 21 February) using the remotely operated vehicle (ROV) Isis. High temperature and diffuse flow fluids were collected for DIC using titanium samplers, equipped with an inductively coupled link high temperature sensor. The nozzle of the titanium sampler was inserted into the chimney orifice for high temperature fluid samples and once the temperature reading became stable the fluid was collected. For diffuse flow samples, a circular titanium housing was placed over the area of diffuse venting to minimise the entrainment of seawater. Once the diffuse flow was visible exiting the top of the housing, the titanium sampler was inserted into the opening and the diffuse flow sample was collected once the temperature reading was stable. On board, an aliquot for stable isotope analysis of DIC was sampled to exclude air and poisoned with mercury chloride.
constraints. Potential food sources were collected by scraping material from rocks collected by ROV manipulators and epibionts from the ventral setae of the decapod Kiwa sp. Particulate suspended material was collected from the acrylic chambers, which was sampled incidentally during faunal collection. Samples were sorted on board to the lowest possible taxonomic resolution. The majority of the vent species are undescribed to date.
Faunal samples were frozen at280uC whole or after dissection, depending on their size, for stable isotope analysis. Muscle was removed from the chelipeds of Kiwa sp., foot dissected from Peltospiroidea sp., tube feet removed from the asteroids Stichas-teridae sp. andFreyella cffragilissima and tentacles removed from the anemones. Legs were removed from the pycnogonids Colossendeis cf. concedis and C. cf. elephantis, while Sericosura spp. was sampled whole. The gastropods Provannidae sp. 1 and 2, Lepetodrilus sp., and juvenile Peltospiroidea sp. (,7 mm shell length), and the stalked barnacle Vulcanolepas sp. were removed from their shells and sampled whole. White muscle tissue was dissected from the anterior dorso-lateral region of the zoarcid fish.
Sample Processing Onshore
Each end-member and diffuse flow DIC sample was prepared for isotopic analysis by removing a 1 mL water sample and transferring it into a separate vial. The headspace was flushed with
helium, phosphoric acid was injected into the vial and then the contents were vortex mixed. The samples were then left to react for 24 hours to ensure complete conversion of all DIC to CO2for
isotopic analysis. The CO2was then analysed by continuous-flow
isotope ratio mass spectrometry (IRMS) using a Europa Scientific 20–20 IRMS by Iso-Analytical (Crewe, United Kingdom). Sam-ples were run in duplicate and the mean is reported. An internal reference gas (IA-R060,d13
C =236.08%6SD 0.13) was used to determine thed13
CDICvalues and is traceable to the International
Atomic Energy Agency standard, NBS-19. Concentrations of CH4
in the water samples were insufficient for isotope analysis. Faunal tissue samples were freeze dried and ground to a homogenous powder using a pestle and mortar. Aliquots of fauna, particulate suspended material and material scraped from rocks were tested for carbonates prior to analysis with 0.1 N HCl. If the sample effervesced, this indicated carbonates were present and it was subsequently acidified by further addition of HCl until the effervescence ceased. Samples were re-dried at 50uC for 48 hours. If the sample did not effervesce, no acidification was carried out. Aliquots for d13
C analysis were not lipid extracted. Any confounding lipid effects due to metabolic processes would not affect the interpretation of the ultimate carbon sources of the vent fauna described byd13
C because of the large differences in the
d13
C values of trophic end-members.
Figure 1. Bathymetric map illustrating positions of the E2 and E9 vent sites (black circles).The vent sites are located at the northern and southern ends of the East Scotia Ridge (ESR), located in the Atlantic sector of the Southern Ocean. The map shows the position of the ESR in relation to South America and the Antarctic Peninsula.
Approximately 0.7 mg of powder was weighed into a tin capsule for carbon and nitrogen IRMS. For sulfur, 2 mg of sample and 4 mg of the catalyst vanadium pentoxide were weighed into each tin capsule. Dual stable carbon and nitrogen isotope ratios were measured by continuous-flow IRMS using a Costech Elemental Analyser interfaced with Thermo Finnigan Delta Plus XP (Natural Environment Research Council, Life Sciences Mass Spectrometry Facility, SUERC, East Kilbride, United Kingdom). Two labora-tory standards were analysed for every ten samples in each analytical sequence. These alternated between paired alanine standards, differing ind13
C andd15
N, and an internal laboratory gelatin standard. Sulfur was analysed by Iso-Analytical using a SERCON Elemental Analyser coupled to a Europa Scientific 20– 20 IRMS. Laboratory standards of barium sulphate (two sets of differingd34
S) and silver sulfide were used for calibration and drift correction. An internal standard of whale baleen was used for quality control (n = 28, 16.34%6SD 0.21). Stable isotope ratios were expressed in delta (d) notation as parts per thousand/permil (%). All internal standards are traceable to the following international standards: v-PDB (Pee Dee Belemnite), AIR (atmospheric nitrogen) and NBS-127 (barium sulphate), IAEA-S-1 (silver sulfide) and IAEA-SO-5 (barium sulphate). An external reference material of freeze dried and ground deep-sea fish white muscle (Antimora rostrata) was also analysed (d13
C, n = 24,218.94% 6 SD 0.09; d15
N, n = 24, 13.11% 6 SD 0.38; d34
S, n = 30, 18.20%,6SD 0.59).
Data Analysis
Data were assessed for normality using a Shapiro-Wilk test before statistical tests examining spatial patterns in trophic structure and species stable isotope values. Homogeneity, or otherwise, of variances is ecologically informative, for example in identifying distinct energy sources at the base of the food web [36]. Inter-site differences in trophic structure were examined using a Fligner-Killeen test for homogeneity of variance to assess differences in the spread of the mean stable isotope values of each species. Inter-site differences in species were analysed using a one-way ANOVA followed by Tukey’s honest significant differ-ence (HSD) when variance was homogeneous among sites. Welch’s ANOVA followed by t-tests were used when there was heterogeneity of variance among sites because it uses adjusted degrees of freedom to protect against Type I errors when variances are unequal [37]. A Bonferroni correction (p = 0.05/n) was used for multiple comparisons. When data were not normally distributed, a two sample Wilcoxon test was used. All statistics were preformed in R version 12.13.1 [38].
Results
Dissolved Inorganic Carbon Stable Isotope Values Mean (6 SD) d13
CDIC of high temperature and diffuse flow
fluids are summarised in Table 1.d13
CDIC of high temperature
samples collected at two E2 locations were24.7% (60.0) (max temperature 351.0uC) and 22.5% (60.1) (max temperature 323.0uC). At E9N,d13
CDIC from separate orifices of the same
chimney structure were 24.6% (60.0) (max temperature 380.2uC) and 24.5% (60.0) (max temperature 357.0uC). No high temperature fluids were collected from E9S for d13CDIC
analysis because the pressure was too high within the titanium samples to safely and accurately collect a representative sample. Diffuse flow samples from amongstKiwasp. and anemones, at E2, hadd13CDICvalues of 0.8%(60.1) (max temperature 19.9uC) and
0.2% (60.2) (max temperature 3.5uC), respectively. A single diffuse flow sample collected from amongst an aggregation ofKiwa
sp. at E9N had ad13
CDICvalue of 1.5%(60.1) (max temperature
12.6uC). At E9S, diffuse flow samples from amongstKiwasp. had a
d13CDICvalue of 0.9%(60.1) (max temperature 19.9uC), while a
sample taken from a mixed aggregation of Kiwa sp. and peltospiroid gastropods hadd13
CDICvalue of 0.1% (60.1) (max
temperature 5.0uC).
Comparison between Vent and Benthic Non-vent Macro-consumers at E9N
At E9N, meand13
C andd15
N values of vent fauna overlapped with non-vent benthic fauna (Welch’s t-test, d13C DF = 10.59, t = 0.66, p = 0.52; Welch’s t-test, d15
N DF = 10.42, t =20.30, p = 0.76; Fig. 2, Tables 2 & 3) while mean d34
S values differed between non-vent benthic fauna and vent fauna (Welch’s t-test, DF = 12.56, t =29.08, p,0.01) (Fig. 3, Tables 2 & 3).
Intra- and Inter-site Differences in Community Trophodynamics
Eleven, ten and seven species were collected at E2, E9N and E9S respectively for stable isotope analysis (Table 3). The ranges of meand13
C values of the vent fauna differed amongst the three sites (Fligner-Killeen test, DF = 2,x2= 6.46, p,0.05). E2 had the narrowestd13
C range (229.9%to219.0%), whereas at E9N and E9S d13
C ranged from 231.4% to 29.9% and 230.0% to 210.5%, respectively (Fig. 2). Across the three sites Peltospiroidea sp. had the lowest values while Kiwa sp. had the highest d13
C values (Fig. 2, Table 3), and Lepetodrilus sp., Vulcanolepas sp., Pacmanactis sp. and Colossendeis spp. all had intermediate d13C values (Fig. 2, Table 3). However, there was no overall difference in mean d13
C values among sites for the combined data across species (Welch’s ANOVA, DF = 2.00, F = 0.59, p = 0.56). The range and meand34S values (Fig. 3, Table 3) did not differ among sites (Fligner-Killeen test, DF = 2, x2
= 0.84, p = 0.65; ANOVA, DF = 2, 26, F = 1.94, p = 0.16), howeverKiwasp. had the lowest
d34S at E2 and E9S whileLepetodrilussp. had the lowestd34S values at E9N (Fig. 3, Table 3). The highest vent faunad34
S values were inPacmanactis sp. (E2), Vulcanolepas sp. (E9N) and Sericosura spp. (E9S) (Fig. 3, Table 3). Neither the range nor the mean d15N values differed among sites (Fligner-Killeen test, DF = 2,x2
= 0.40, p = 0.83; ANOVA, DF = 2, 26, F = 1.19, p = 0.31). The provannid gastropods at E2 and E9S had the lowest d15N values while Peltospiroidea sp. had the lowest values at E9N (Fig. 2, Table 3).
Table 1.d13C values of dissolved inorganic carbon (DIC) sampled from high temperature and diffuse flow venting from the E2 and E9 ridge segments of the East Scotia Ridge, Southern Ocean.
Site Temperature (6C) d13C DIC
E2 351.0 24.7 (0.0)
323.0 22.5 (0.1)
19.9 0.8 (0.1)
3.5 0.2 (0.2)
E9N 380.2 24.7 (0.0)
357.0 24.7 (0.0)
12.6 1.5 (0.1)
E9S 19.9 0.9 (0.1)
5.0 0.1 (0.1)
Figure 2.d13C andd15N values of macroconsumers collected from the East Scotia Ridge, Southern Ocean.The values represent means (6standard deviations) for hydrothermal vent and non-vent macroconsumers from the three sample sites: (a) E2, (b) E9N and (c) E9S. Dashed vertical lines represent potential ranges ofd13C values indicative of carbon sources sustaining macroconsumers at the ESR: triple dashed line represents the Calvin-Benson-Bassham (CBB) cycle utilising form I RuBisCO, double dashed line represents the reductive tricarboxylic acid (rTCA) cycle, mixed carbon sources occur between the triple and double dashed line and the continuous dashed line represents the approximated13C values of the dissolved inorganic carbon from the diffuse flow areas.
The stichasterid sp. consistently had the highest d15
N values relative to the other vent fauna at each site (Fig. 2, Table 3).
Spatial Differences in Macroconsumer Trophodynamics Vulcanolepassp. exhibited spatial differences ind13C,d15N and
d34S but there was no consistent pattern in isotopic differences among sites (Table 4). Male and female Kiwasp. at E2 did not
differ ind13
C but males were lower ind15
N andd34
S than females (Table 5). MaleKiwasp. showed spatial differences in each stable isotope (Table 4). d13
C of the males showed a greater range (Fligner-Killeen test, DF = 2,x2
= 10.91, p,0.01) and lower values at E2 than E9N and E9S (Table 3 & 4). The epibionts attached to the ventral surface of maleKiwasp. also exhibited a greater spread of d13
C values at E2 than E9S (F-test, DF = 4, 3, F = 244.46,
Table 2.Meand13C,d15N andd34S values (%) of non-vent deep-sea fauna collected from the E2 and E9 ridge segments of the East Scotia Ridge, Southern Ocean. Standard deviations are in parentheses.
Taxonomic group Species Site N d13C d34S d15N
Crustacea
Decapoda Nematocarcinus lanceopes E9 5 224.2 (0.7) 18.9 (0.5) 8.1 (0.4)
Euphausia superba E9 3 227.4 (0.8) 19.0 (0.1) 2.7 (0.7)
Echinodermata
Asteroidea Freyellacffragilissima E2 3 222.4 (0.3) 18.0 (0.8) 10.2 (0.6)
Freyellacffragilissima E9 2 221.8 (0.5) 17.5 (0.2) 10.8 (0.2)
Holothuroidea Holothuroidea sp. E9 3 224.9 (0.0) 18.3 (0.6) 8.0 (0.4)
Ophiuroidea Ophiuroidea sp. E9 3 223.7 (0.8) 17.6 (0.9) 9.0 (0.8)
Vertebrata
Osteichthys Zoarcidae sp. E9 4 226.5 (1.7) 15.7 (0.4) 12.0 (1.8)
doi:10.1371/journal.pone.0065553.t002
Table 3.Meand13C,d15N andd34S values (%)of hydrothermal vent fauna collected from the E2 and E9 ridge segments of the East Scotia Ridge, Southern Ocean.
Taxonomic group E2 E9N E9S
N d13C d34S d15N N d13C d34S d15N N d13C d34S d15N
Cirripedia
Vulcanolepassp. 22 221.1 (0.6) 8.2 (1.0) 6.3 (0.7) 23 226.9 (0.8) 11.0 (0.8) 9.0 (0.4) 23 222.1 (0.8) 5.4 (1.1) 6.4 (0.6)
Decapoda
Kiwasp. female 20 219.4 (1.5) 3.9 (1.3) 8.2 (0.5) 0 – – – 0 – – –
Kiwasp. Male 18 219.0 (2.0) 3.0 (1.2) 7.5 (0.5) 22 210.6 (0.9) 4.0 (0.7) 8.9 (0.5) 30 210.7 (0.6) 2.4 (0.9) 9.1 (0.6)
Pycnogonida
Sericosuraspp. 6 224.7 (0.9) 11.9 (0.4) 8.5 (1.3) 9 230.9 (0.5) 6.8 (0.8) 7.7 (0.5) 2 227.2 (0.3) 14.9 (0.3) 9.1 (0.1)
Colossendeiscfconcedis 0 – – – 6 223.3 (2.5) 10.9 (1.4) 12.1 (0.5) 0 – – –
Colossendeiscfelephantis1 223.8 14.9 11.0 3 220.8 (2.2) 8.5 (1.6) 11.8 (0.8) 0 – – –
Anthozoa
cfActinostolasp. 1 0 – – – 4 214.7 (3.5) 10.3 (0.4) 9.9 (0.3) 0 – – –
Pacmanactissp. 5 223.8 (0.2) 14.9 (0.7) 7.1 (0.7) 0 – – – 0 – – –
cfMarianactissp. 5 223.7 (0.3) 14.0 (2.4) 7.2 (1.8) 0 – – – 0 – – –
Asteroidea
Stichasteridae sp. 1 220.2 11.3 12.3 5 212.2 (0.6) 10.0 (0.9) 12.4 (0.4) 5 214.7 (1.6) 11.8 (2.6) 13.4 (0.6)
Gastropoda
Peltospiroidea sp. 19 230.1 (0.6) 6.0 (0.6) 5.4 (0.4) 22 231.2 (0.4) 3.7 (0.5) 5.8 (0.6) 15 230.1 (0.5) 4.7 (1.1) 5.9 (0.7)
Peltospiroidea sp (,7 mm)
4 223.9 (0.7) 7.4 (2.0) 6.8 (0.5) 5 229.6 (2.7) 4.2 (0.2) 6.4 (1.3) 0 – – –
Provannidae sp. 1 1 226.5 8.0 4.2 0 – – – 0 – – –
P–rovannidae sp. 2 0 – – – 0 – – – 4 221.8 (1.4) 5.9 (0.8) 4.0 (0.5)
Lepetodrilussp. 5 224.9 (0.8) 6.4 (0.5) 6.8 (0.3) 4 225.2 (0.7) 3.4 (0.3) 8.5 (0.4) 4 222.4 (0.8) 3.6 (0.3) 7.0 (0.3)
Cladorhizidae
Cladorhizasp. 5 226.1 (0.4) 14.7 (1.4) 8.7 (0.4) 0 – – – 0 – – –
Potential food sources
Particulate suspended material
3 223.2 (5.4) 10.0 (1.1) 20.1 (4.9) 0 – – – 0 – – –
Rock scrapings 0 – – – 1 223.2 0.8 2.4 1 231.1 – 1.9
K–iwan. sp episymbiont 5 218.9 (5.3) 7.5 (0.3) 3.3 (1.5) 0 – – – 5 29.9 (0.3) 6.6 (0.2) 5.2 (0.8)
p,0.01) as well as lowerd13C but higherd15N values at E2 than E9S (Table 3 & 5). Sericosura spp. d13
C and d34
S values varied amongst sites but d15
N values scarcely did (Table 4). d13
C and
d34
S values were lowest at E9N but highest at E2 ford13
C and E9S ford34
S (Table 3). Peltospiroidea sp. showed spatial differences in
d13
C and d34
S but not in d15
N (Table 4). d34
S values differed among all sites but E9Nd13
C values were lower than those at E9S and E2 (Table 4). Stichasteridae sp. revealed differences between all sites ford13
C andd15
N but ford34
S only between E2 and E9N (Table 5).
Discussion
This study described the trophic structure of a new vent biogeographical province recently discovered on the ESR in the Southern Ocean [21]. In addressing this aim, the study shared the challenges of preceding work in characterising energy sources, separating isotopic overlap and mixing of energy sources, and following energy sources into subsequent predator-prey relation-ships. However, the tri-isotope approach and integration of both vent chemistry and microbiology, here, provided a more holistic understanding of vent trophic ecology at within- and among-vent field scales.
Intra-site Trophic Interactions and Energy Sources Scarcity of D13
C estimates between inorganic carbon and cellular biomass for primary producers at hydrothermal vents [27,30] makes interpretation of the origin of organic carbon fixed within the hydrothermal vent system and assimilated by macro-consumers tentative for species not within a symbiotic or known predator-prey relationship. Diffuse flowd13
CDICof approximately
1% at the ESR vent fields suggests ESR vent macroconsumers withd13
C values ,222% are assimilating carbon fixed via the CBB cycle because the net fractionation associated with fixing inorganic into organic carbon for RuBisCO form I ranges from
222%to230%[26,27]. Peltospiroidea sp. housed an endosym-biotic gamma-Proteobacteria (K. Zwirglmaier unpublished data) and is within the d13
C range expected for carbon fixed via RuBisCO form I at all three locations. Molluscs containing a single strain of endosymbiotic gamma-Proteobacteria living in other biogeographical vent provinces include some species of bathymodiolid mussels, vesicomyid clams andIfremeriagastropods, all of which haved13
C values between237%and227%[39,40]. Other species of ESR vent macroconsumers, which had d13
C values,222% includedVulcanolepassp. (E2 and E9S), Sericusora spp., E2 anemones andLepetodrilussp. These species consume free-living bacteria [14,23] so organic carbon fixed via other carbon
fixation pathways cannot be ruled out as part of their assimilated diet.
Vent macroconsumers inhabiting the hottest areas of the hydrothermal vent tolerable to metazoan life, including rimicarid shrimps, polychaetesAlvinellaspp. and Riftia pachyptila and some alvinoconchid gastropods, tend to assimilate rTCA-fixed carbon from their diet [11,41,42] and have d13C values .216% [14,25,43,44]. Asd13CDICis approximately 1%at the ESR sites,
vent macroconsumers utilising carbon fixed via the rTCA cycle would have had d13C values .213%; assuming a 22% to
214% net fractionation between the inorganic substrate and organic product catalysed by the enzymes involved in the rTCA cycle [29,30]. Kiwa sp. living at E9N and E9S, along with its epibionts, hadd13C values that were.212% and are found in areas close to discharging vent fluids [22]. This potentially indicates the epibionts living onKiwasp. ventral setae were fixing carbon via the rTCA cycle.Kiwa sp. was also 15N-enriched by between 3.8% and 4.2% relative to its epibionts, suggesting the epibionts were an important food source. A similar episymbiotic relationship between the ESR kiwid is therefore hypothesised to that of Kiwa puravida, for which lipid, stable isotope and behavioural analyses indicate the harvesting of epibiont bacteria [45]. Stichasteridae sp. (,213%) and cfActinostolasp. (,214%) also appeared to be assimilating carbon indicative of the rTCA cycle at E9N and E9S.
Several vent macroconsumers fell within the range of d13C values indicative of mixed carbon sources. Those within thed13C
222% to215%range may consume free-living bacteria or are predators or scavengers that utilise a number of trophic pathways. At the ESR hydrothermal vents,Lepetodrilussp., Provannidae sp. 2, Vulcanolepas sp., Kiwa sp., Stichasteridae sp. and Colossendeis cf. elephantisfell into this range at one or more sites. Related species of Lepetodrilus sp., Provannidae sp. 2 and Vulcanolepas sp. are all thought to consume free-living bacteria at other vents sites [14,23]. Such feeding can result in consuming heterogeneous bacterial communities, which have multiple pathways for carbon fixation and elemental cycling [9,46,47]. The biological cycling of carbon is very complex at hydrothermal vents because of the multiple single carbon substrates for carbon fixation (e.g. CO2, CH4, CO),
spatial variability in thed13C value of the substrate and various microbial primary producers associated with different carbon fixation pathways [7,11,48]. Furthermore, the incorporation of photosynthetic derived carbon as particulate or dissolved organic matter is possible and may provide some nutrition to vent macroconsumers [12,13]. Therefore, complex isotopic mixes of food sources are available to these species.
Table 4.Results of ANOVA andpost-hocTukey honest significant differences tests for the differences in stable isotope values of vent fauna among the three sites on the East Scotia Ridge.
Species d13C d34S d15N
DF F p Post-hoc DF F p Post-hoc F DF p Post-hoc
Vulcanolepassp. 2, 63 403.18 ,0.01 E9N,E9S,E2 2, 63 176.16 ,0.01 E9S,E2 = E9S 2, 63 138.26 ,0.01 E2 = E9S,E9N
Kiwasp. male 2, 31.36 147.29 ,0.01 E2,E9S = E9N* 2, 66 19.52 ,0.01 E2 = E9S,E9N 2, 66 52.64 ,0.01 E2,E9N = E9S
Sericosuraspp. 2, 15 215.00 ,0.01 E9N,E9S,E2 2, 15 100.61 ,0.01 E9N,E2,E9S 2, 15 3.39 0.06 NA
Peltospiroidea sp. 2, 52 29.50 ,0.01 E9N,E9S = E2 2, 52 49.26 ,0.01 E9N,E9S,E2 2, 52 2.90 0.06 NA
Lepetodrilussp. 2, 10 17.41 ,0.01 E2 = E9N,E9S 2, 10 31.99 ,0.01 E9N = E9S,E2 2, 10 32.10 ,0.01 E2 = E9S,E9N
The majority of ESR vent macroconsumers hadd34
S values less than or equal to the 10% threshold, indicating chemosynthetic food sources [49]. Species exceeding the 10% value occurred mainly at E2 in the anemonesPacamanactissp. and cfMarianactissp, the sponge Cladorhiza sp., the pycnogonids C. elephantis and the stichasterid seastar along with Sericosura spp. and stichasterid seastar at E9S. All had d34
S values between 10% and 16%. Mixing of epipelagic photosynthetic and hydrothermal vent chemosynthetic production sources at these sites cannot be ruled out.
Determining intra-site differences in food sources and trophic interactions using d34S is challenging for macroconsumers with
d34S values,10%because thed34S values of inorganic substrates and the net fractionation effect between inorganic substrates and products for primary producers and consumers are uncertain. At E9,d34S appeared to increase from macroconsumers living closest to vent openings and within diffuse flow areas (i.e. Kiwa sp., Peltospiroidea sp. andLepetodrilussp.) to those in the periphery (i.e. anemones, stichasterid seastars andColossendeis spp.). It is unclear why an increase ind34S occurred from the centre of the vent to the periphery: it may be the result of changes in sulfide speciation [50] or other sulfur sources with increasing distance from the vent opening [33], differences in levels of sulfide exposure [50], incorporation of epipelagic photosynthetic primary production or a combination of the above.
Stichasterid seastars, cf Actinostola sp. and Colossendeis spp. consistently had the highest d15N values of all the ESR vent macroconsumers, which suggested they occupied the highest trophic positions of those predators sampled. Behavioural obser-vations [22] andd13C values indicated thatKiwasp. is consumed by stichasterid seastar and cf Actinostola sp. 1 but only the stichasterid seastar hadd15N values indicative of a higher trophic position thanKiwasp. In the case of Colossendeisspp., feeding on anemones occurs at the ESR vent sites [22] and at E2 all three stable isotopes indicated a strong predator-prey link. At E9N there was a large difference ind13C andd34S between cfActinostolasp. 1 and the two species of Colossendeisas well as lowerd15N in these pycnogonids compared to cfActinostolasp. 1. This suggests that at E9N the feeding incidents between cf Actinostola sp. 1 and Colossendeis spp. are either rare or stable isotope values of Colossendeisspp. are strongly affected by isotopic mixing of different energy sources (d13C andd34S) and feeding over multiple trophic positions (d15N).
It is evident from the ESR hydrothermal vent food webs that predators may have similar or lowerd15
N values than their prey. Calculating trophic position assuming taxon specific nitrogen
trophic discrimination factors [23] or applying the more universal value of 3.4%[12] was not undertaken within this study because they may have provided erroneous results. Establishing a suitable
d15
N baseline is problematic because: the macroconsumer with the lowestd15
N differed among locations, is confounded by the use of different tissues (e.g. whole animals, muscle) to construct the food webs [32] and the observed highd15
N variability in potential food sources. Compound-specific amino acid stable isotope analysis may provide higher resolution information on the organic nitrogen compounds assimilated by vent macroconsumers because the isotopic values of different amino acids record trophic and basal source information [51,52]. Thus it may circumvent some of the limitations of bulkd15
N analysis and provide a better understand-ing of nitrogen cyclunderstand-ing at hydrothermal vents.
Spatial Patterns in Macroconsumer Trophodynamics Large spatial differences ind13
C values forKiwasp., Stichaster-idae sp. andSericosuraspp. were attributed primarily to differences in carbon fixation pathways at the base of the food web, which is in turn transferred to higher trophic positions.d13
C values ofKiwa sp. differed by,9%between E2 and E9S as did that of associated Kiwa sp. epibionts. Also, epsilon-Proteobacteria dominated the epibiont community at E9 with gamma-Proteobacteria largely absent, compared to a mix of gamma- and epsilon-Proteobacteria at E2 (K. Zwirglmaier unpublished data). All epsilon-Proteobac-teria to date use the rTCA cycle to fix carbon while gamma-Proteobacteria predominantly use the CBB cycle [11]. Riftia pachyptilahas similar differences ind13
C among vent sites, but this is attributed to its endosymbionts shifting between rTCA and CBB cycles [53] rather than changes in the microbial community it consumes. Alvinoconchid gastropods haved13C values that differ by.20%among vent fields, which relates to whether epsilon- or gamma-Proteobacteria are the endosymbionts [54]. It is unclear whyKiwasp. epibiont diversity is different between E2 and E9. At other hydrothermal vent locations differences in vent fluid chemical composition influences microbial communities [46,55] and it may be similar at the ESR vent fields. The difference in carbon fixation appeared to be transferred throughKiwasp. to the predatory stichasterid seastar. Such a predator-prey interaction may also explain the large difference ind13
C values between E2 and E9N inSericosuraspp. At E2Sericosuraspp. were collected from amongst anemones that had d13
C values indicative of a mixed carbon source but at E9 they were collected from amongst peltospiroid gastropods dependent on CBB fixed carbon, although Sericosura spp. were not observed directly feeding on either anemones or Peltospiroidea sp.
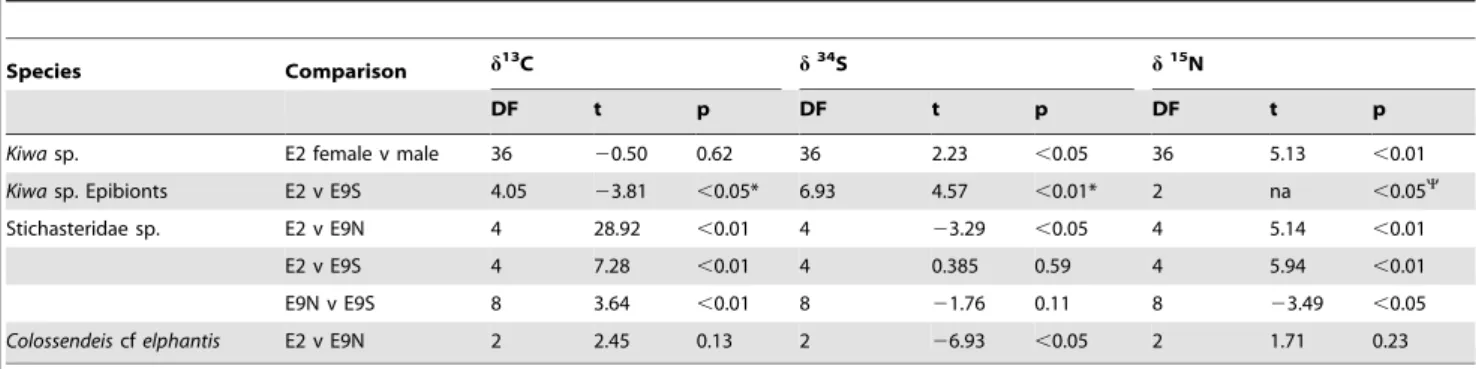
Table 5.Results of t-tests for between-sites differences in stable isotope values of vent fauna at the East Scotia Ridge.
Species Comparison d13C d34S d15N
DF t p DF t p DF t p
Kiwasp. E2 female v male 36 20.50 0.62 36 2.23 ,0.05 36 5.13 ,0.01
Kiwasp. Epibionts E2 v E9S 4.05 23.81 ,0.05* 6.93 4.57 ,0.01* 2 na ,0.05Y
Stichasteridae sp. E2 v E9N 4 28.92 ,0.01 4 23.29 ,0.05 4 5.14 ,0.01
E2 v E9S 4 7.28 ,0.01 4 0.385 0.59 4 5.94 ,0.01
E9N v E9S 8 3.64 ,0.01 8 21.76 0.11 8 23.49 ,0.05
Colossendeiscfelphantis E2 v E9N 2 2.45 0.13 2 26.93 ,0.05 2 1.71 0.23
*Welch’s t-test,
YWilcoxon test.
Relatively small differences in stable isotope values were observed among sites in Peltospiroidea sp., Lepetodrilus sp. and Vulcanolepassp. To date, Peltospiroidea sp. contains a single strain of gamma-Proteobacteria endosymbiont (K. Zwirglmaier unpub-lished data), which means spatial differences ind13
C andd34
S are unlikely to be the result of differences in the type of endosymbiont [55]. The differences were potentially a result of site-specific variations in thed13
CDICand inorganic d34S values used by the
endosymbionts during chemoautotrophy or physiological temper-ature-related effects on isotopic discrimination. Small differences among sites for the grazer Lepetodrilussp. and suspension feeder Vulcanolepassp. are harder to explain because of the various factors that are likely to influence their food source.d13
C values indicated these organisms consume a mixed diet of free-living microbes and particulate material. However, differences ind13C values within
sites may be related to the organism’s distribution within the vent field [56] and in turn the composition of the microbial community [46], the stable isotope values of the inorganic substrate used during chemoautotrophy [57] and temperature effects on trophic discrimination. Lepetodrilussp. and Vulcanolepas sp. were collected from single points within each vent site and, therefore, it is not clear whether the difference in stable isotope values among sites is greater or less than that within sites.
Because of the snap-shot nature of this study, it is difficult to identify factors that caused the spatial differences in theKiwasp. epibiont communities that resulted in a greater range of d13
C values at the E9 sites compared to E2. Higher concentrations of dissolved sulfides in vent fluids may favour the rTCA pathway resulting in increasing numbers of organisms with d13C values greater than216%[12]. On the ESR, E9 has higher hydrogen sulfide and lower chloride concentrations than E2 meaning that there are greater concentrations of available gases for microbial primary production due to phase separation [6,21]. Higher concentrations of reduced compounds and gases may be one of the drivers of the differences in trophic structure at the ESR vents. However, hydrothermal vent communities also undergo changes in community composition with age [58] and fluctuating hydrothermal activity [59], which will have an effect on trophic
structure. As data presented here were obtained concurrently with the discovery of the new biogeographical province it is not possible to determine whether the communities at E2 and E9 represent different successional stages, are a product of varying chemistry or a mix of such processes.
Conclusion
Trophic structure differed substantially between the E2 and E9 vents fields, and only slightly between E9N and E9S.d13
CDICof
the end-member fluid and diffuse flow samples were similar among the sites but large differences in thed13
C values of some vent macroconsumers indicated spatial variations in the way microbes were fixing carbon at the base of the food chain.d13
C values .213% at the E9N and E9S suggest that the relative contribution to the macroconsumer food web of carbon fixed via the rTCA cycle is likely to be greater than at E2. The greater range ofd34S values at E2 and E9S indicated a potentially greater
influence of epipelagic photosynthetic primary production than at E9N. The greater contribution of rTCA fixed carbon at the E9 vent field may ultimately be related to differences in vent fluid, but more work is required to link vent fluid chemistry with microbial primary production and the related trophic structure at hydro-thermal vents.
Acknowledgments
We thank the officers, crew, ROV team & scientists onboard JC42 for assistance in sample collection and sorting. We also thank Veerle Huvenne for producing the bathymetric map.
Author Contributions
Conceived and designed the experiments: WDKR CJS BDW KZ JAH KL NVCP. Performed the experiments: WDKR CJS KZ JAH KL. Analyzed the data: WDKR CJS BDW KZ JAH RARM NVCP. Contributed reagents/materials/analysis tools: WDKR CJS KZ JAH RARM. Wrote the paper: WDKR CJS BDW KZ JAH RARM KL NCVP. Participants on JC042: WDKR CJS JAH KZ KL.
References
1. Kelley DS, Karson JA, Blackman DK, Fruh-Green GL, Butterfield DA, et al. (2001) An off-axis hydrothermal vent field near the Mid-Atlantic Ridge at 30uN Nature 412: 145–149.
2. Staudigel H, Hart SR, Pile A, Bailey SE, Baker ET, et al. (2006) Vailulu’u seamount, Samoa: Life and death on an active submarine volcano. Proc Natl Acad Sci USA 103: 6448–6453.
3. Tunnicliffe V, Juniper SK, Sibuet M (2003) Reducing environments of the deep-sea floor. In: Tyler PA, editor. Ecosystems of the Deep Ocean. Amsterdam: Elsevier Science. 81–110.
4. Cavanaugh CM, Gardiner SL, Jones ML, Jannasch HW, Waterbury JB (1981) Prokaryotic cells in the hydrothermal vent tube wormRiftia pachyptilaJones -possible chemoautotrophic symbionts. Science 213: 340–342.
5. German CR, Ramirez-Llodra E, Baker MC, Tyler PA (2011) Deep-water chemosynthetic ecosystem research during the Census of Marine Life decade and beyond: A proposed deep-ocean road map. PLoS ONE 6: 16.
6. German CR, Von Damm KL (2003) Hydrothermal Processes. In: Elderfield H, editor. The ocean and marine geochemistry. Oxford: Elsevier. 181–222. 7. Karl DM (1995) Ecology of free-living, hydrothermal vent microbial
communities. In: Karl DM, editor. The microbiology of deep-sea hydrothermal vents. Boca Raton: CRC Press Inc. 35–124.
8. McCollom TM, Shock EL (1997) Geochemical constraints on chemolithoauto-trophic metabolism by microorganisms in seafloor hydrothermal systems. Geochim Cosmochim Acta 61: 4375–4391.
9. Campbell BJ, Cary SC (2004) Abundance of reverse tricarboxylic acid cycle genes in free-living microorganisms at deep-sea hydrothermal vents. Appl Environ Microbiol 70: 6282–6289.
10. Desbruyeres D, Alaysedanet AM, Ohta S, Antoine E, Barbier G, et al. (1994) Deep-sea hydrothermal communities in the southwestern Pacific back-arc basins (the North Fiji and Lau Basins)- composition, microdistribution and food web. Mar Geol 116: 227–242.
11. Hugler M, Sievert SM (2011) Beyond the Calvin Cycle: Autotrophic carbon fixation in the ocean. Ann Rev Mar Sci. Palo Alto: Annual Reviews. 261–289. 12. De Busserolles F, Sarrazin J, Gauthier O, Gelinas Y, Fabri MC, et al. (2009) Are spatial variations in the diets of hydrothermal fauna linked to local environmental conditions? Deep Sea Res Part II Top Stud Oceanogr 56: 1649–1664.
13. Riou V, Colaco A, Bouillon S, Khripounoff A, Dando PR, et al. (2010) Mixotrophy in the deep sea: a dual endosymbiotic hydrothermal mytilid assimilates dissolved and particulate organic matter Mar Ecol Prog Ser 405: 187–201.
14. Colaco A, Dehairs F, Desbruyeres D (2002) Nutritional relations of deep-sea hydrothermal fields at the Mid-Atlantic Ridge: a stable isotope approach. Deep Sea Res Part I Oceanogr Res Pap 49: 395–412.
15. Rau GH, Hedges JI (1979) Carbon13 depletion in a hydrothermal vent mussel -suggestion of a chemosynthetic food source. Science 203: 648–649.
16. Van Dover CL, Fry B (1994) Microorganisms as food resources at deep-sea hydrothermal vents. Limnol Oceanogr 39: 51–57.
17. Levin LA, Mendoza GF, Konotchick T, Lee R (2009) Macrobenthos community structure and trophic relationships within active and inactive Pacific hydrothermal sediments. Deep Sea Res Part II Top Stud Oceanogr 56: 1632– 1648.
18. Limen H, Juniper SK (2006) Habitat controls on vent food webs at Eifuku Volcano, Mariana Arc. Cah Biol Mar 47: 449–455.
19. Van Dover CL (2002) Trophic relationships among invertebrates at the Kairei hydrothermal vent field (Central Indian Ridge). Mar Biol 141: 761–772. 20. German CR, Livermore RA, Baker ET, Bruguier NI, Connelly DP, et al. (2000)
Hydrothermal plumes above the East Scotia Ridge: an isolated high-latitude back-arc spreading centre. Earth Planet Sci Lett 184: 241–250.
22. Marsh L, Copley JT, Huvenne VAI, Linse K, Reid WDK, et al. (2012) Microdistribution of faunal assemblages at deep-sea hydrothermal vents in the Southern Ocean. PLoS ONE 7: e48348.
23. Bergquist DC, Eckner JT, Urcuyo IA, Cordes EE, Hourdez S, et al. (2007) Using stable isotopes and quantitative community characteristics to determine a local hydrothermal vent food web. Mar Ecol Prog Ser 330: 49–65.
24. Van Dover CL, Fry B (1989) Stable isotopic compositions of hydrothermal vent organisms. Mar Biol 102: 257–263.
25. Fisher CR, Childress JJ, Macko SA, Brooks JM (1994) Nutritional interactions in Galapagos Rift hydrothermal vent communities - inferences from stable carbon and nitrogen isotope analyses. Mar Ecol Prog Ser 103: 45–55.
26. Guy RD, Fogel ML, Berry JA (1993) Photosynthetic fractionation of the stable isotopes of oxygen and carbon. Plant Physiology 101: 37–47.
27. Robinson JJ, Scott KM, Swanson ST, O’Leary MH, Horken K, et al. (2003) Kinetic isotope effect and characterization of form II RuBisCO from the chemoautotrophic endosymbionts of the hydrothermal vent tubewormRiftia pachyptila. Limnol Oceanogr 48: 48–54.
28. Roeske CA, O’Leary MH (1984) Carbon isotope effects on the enzyme-catalyzed carboxylation of ribulose bisphosphate. Biochemistry 23: 6275–6284. 29. House CH, Schopf JW, Stetter KO (2003) Carbon isotopic fractionation by Archaeans and other thermophilic prokaryotes. Org Geochem 34: 345–356. 30. Suzuki Y, Sasaki T, Suzuki M, Nogi Y, Miwa T, et al. (2005) Novel
chemoautotrophic endosymbiosis between a member of the Epsilonproteobac-teria and the hydrothermal-vent gastropodAlviniconchaaff.hessleri(Gastropoda: Provannidae) from the Indian Ocean. Appl Environ Microbiol 71: 5440–5450. 31. Wirsen CO, Sievert SM, Cavanaugh CM, Molyneaux SJ, Ahmad A, et al. (2002) Characterization of an autotrophic sulfide-oxidizing marineArcobactersp that produces filamentous sulfur. Appl Environ Microbiol 68: 316–325. 32. Michener RH, Kaufman L (2007) Stable isotope ratios as tracers in marine food
webs: an update. In: Michener RH, Lajtha K, editors. Stable isotopes in ecology and environmental science. 2nd ed. Singapore: Blackwell Publishing. 238–282. 33. Herzig PM, Hannington MD, Arribas A Jr (1998) Sulfur isotopic composition of hydrothermal precipitates from the Lau back-arc: implications for magmatic contributions to seafloor hydrothermal systems. Mineralium Deposita 33: 226– 237.
34. Erickson KL, Macko SA, Van Dover CL (2009) Evidence for a chemoauto-trophically based food web at inactive hydrothermal vents (Manus Basin). Deep Sea Res Part II Top Stud Oceanogr 56: 1577–1585.
35. Reid WDK, Wigham BD, McGill RAR, Polunin NVC (2012) Elucidating trophic pathways in benthic deep-sea assemblages of the Mid-Atlantic Ridge north and south of the Charlie-Gibbs Fracture Zone. Mar Ecol Prog Ser 463: 89–103.
36. Layman CA, Arrington DA, Montana CG, Post DM (2007) Can stable isotope ratios provide for community-wide measures of trophic structure? Ecology 88: 42–48.
37. Quinn GP, Keough MJ (2002) Experimental Design and Data Analysis for Biologists. Cambridge: Cambridge University Press. 537 p.
38. R Core Team (2011) R: A language and environment for statistical computing. R Foundation for Statistical Computing, Vienna, Austria. ISBN 3–900051–07– 0, URL http://www.R-project.org/.
39. Brooks JM, Kennicutt MC, Fisher CR, Macko SA, Cole K, et al. (1987) Deep-sea hydrocarbon seep communities - evidence for energy and nutritional carbon sources. Science 238: 1138–1142.
40. Childress JJ, Fisher CR (1992) The biology of hydrothermal vent animals-physiology, biochemistry and autotrophic symbioses. Oceanogr Mar Biol 30: 337–441.
41. Campbell BJ, Engel AS, Porter ML, Takai K (2006) The versatile epsilon-Proteobacteria: key players in sulphidic habitats. Nat Rev Microbiol 4: 458–468.
42. Campbell BJ, Stein JL, Cary SC (2003) Evidence of chemolithoautotrophy in the bacterial community associated withAlvinella pompejana, a hydrothermal vent polychaete. Appl Environ Microbiol 69: 5070–5078.
43. Levesque C, Juniper SK, Marcus J (2003) Food resource partitioning and competition among alvinellid polychaetes of Juan de Fuca Ridge hydrothermal vents. Mar Ecol Prog Ser 246: 173–182.
44. Suzuki Y, Kojima S, Sasaki T, Suzuki M, Utsumi T, et al. (2006) Host-symbiont relationships in hydrothermal vent gastropods of the genus Alviniconcha from the Southwest Pacific. Appl Environ Microbiol 72: 1388–1393.
45. Thurber AR, Jones WJ, Schnabel K (2011) Dancing for food in the deep sea: bacterial farming by a new species of yeti crab. PLoS ONE 6: e26243. 46. Flores GE, Campbell JH, Kirshtein JD, Meneghin J, Podar M, et al. (2011)
Microbial community structure of hydrothermal deposits from geochemically different vent fields along the Mid-Atlantic Ridge. Environ Microbiol 13: 2158– 2171.
47. Takai K, Nunoura T, Horikoshi K, Shibuya T, Nakamura K, et al. (2009) Variability in microbial communities in black smoker chimneys at the NW Caldera vent field, Brothers Volcano, Kermadec Arc. Geomicrobiol J 26: 552– 569.
48. Nakagawa S, Takai K (2008) Deep-sea vent chemoautotrophs: diversity, biochemistry and ecological significance. FEMS Microbiol Ecol 65: 1–14. 49. Vetter RD, Fry B (1998) Sulfur contents and sulfur-isotope compositions of
thiotrophic symbioses in bivalve molluscs and vestimentiferan worms. Mar Biol 132: 453–460.
50. Luther GW, Rozan TF, Taillefert M, Nuzzio DB, Di Meo C, et al. (2001) Chemical speciation drives hydrothermal vent ecology. Nature 410: 813–816. 51. Chikaraishi Y, Ogawa NO, Kashiyama Y, Takano Y, Suga H, et al. (2009)
Determination of aquatic food-web structure based on compound-specific nitrogen isotopic composition of amino acids. Limnol Oceanogr Methods 7: 740–750.
52. McClelland JW, Montoya JP (2002) Trophic relationships and the nitrogen isotopic composition of amino acids in plankton. Ecology 83: 2173–2180. 53. Markert S, Arndt C, Felbeck H, Becher D, Sievert SM, et al. (2007)
Physiological proteomics of the uncultured endosymbiont of Riftia pachyptila. Science 315: 247–250.
54. Suzuki Y, Sasaki T, Suzuki M, Tsuchida S, Nealson KH, et al. (2005) Molecular phylogenetic and isotopic evidence of two lineages of chemoautotrophic endosymbionts distinct at the subdivision level harbored in one host-animal type: The genusAlviniconcha(Gastropoda : Provannidae). FEMS Microbiol Lett 249: 105–112.
55. Trask JL, Van Dover CL (1999) Site-specific and ontogenetic variations in nutrition of mussels (Bathymodiolussp.) from the Lucky Strike hydrothermal vent field, Mid-Atlantic Ridge. Limnol Oceanogr 44: 334–343.
56. Levesque C, Juniper SK, Limen H (2006) Spatial organization of food webs along habitat gradients at deep-sea hydrothermal vents on Axial Volcano, Northeast Pacific. Deep Sea Res Part I Oceanogr Res Pap 53: 726–739. 57. Levesque C, Limen H, Juniper SK (2005) Origin, composition and nutritional
quality of particulate matter at deep-sea hydrothermal vents on Axial Volcano, NE Pacific. Mar Ecol Prog Ser 289: 43–52.
58. Shank TM, Fornari DJ, Von Damm KL, Lilley MD, Haymon RM, et al. (1998) Temporal and spatial patterns of biological community development at nascent deep-sea hydrothermal vents (9 degrees 509N, East Pacific Rise). Deep Sea Res Part II Top Stud Oceanogr 45: 465–515.