INTERNATIONAL JOURNAL OF SCIENTIFIC & TECHNOLOGY RESEARCH VOLUME 4, ISSUE 03, MARCH 2015 ISSN 2277-8616
58 IJSTR©2015
www.ijstr.org
Factors Contributing Decreased Performance Of
Slow Learners
Dr. L. Kannan, Dr. P. V. Vijayaragavan., Dr. Pankaj. B. Shah, Dr. Suganathan. S, Dr. Praveena .P
Back ground: Even experienced teaching faculty and administrators can be challenged by learners, who have not able to perform up to expected need in their annual performance of their students, these students are called as slow learners/Struggle learners. There should be a designed study to foster discussion about diagnosing particular problems that contribute with meeting objectives of slow learners. Methodology: The study was performed on the entire current first year of Medical students, were all the three internal assessments of 250 students performance is taken in to consideration for the study. This study is of cross section type.After obtaining the list of all students’ marks in internal examination from medical education unit, supporting mentors are contacted to meet the students, and confidentiality is maintained throughout the study. After obtaining informed consent, a questionnaire was administered to the students by the investigator. The questionnaire contains the following sections. Section I will be on the background characteristics of the student– name, age, sex, type of family. Section II will be on the details of their learning capabilities. Section III will focus on the awareness of the slow learners in which the precipitating factors contributing to them. Results: The prevalence of slow learners as low achievers were contributed to be 32.4 percentages.The performance of the students is based on combination of all three internal assessment marks including theory and practical performance. In this the students age ranges from 17 to 21 years, the mean age of student was contributed to be 17.81 and majority of the students were in the age group of 18 years which contributed to be 168(67.2).In the present study majority were males 132(52.8) compared to females 118(47.2).but when study is compared to percentage of attendance, majority of the individual 151(77%) scored more than 50 percentage of marks have more than 80 percentage of attendance, but when compared to less than 50 percentage of marks majority 36(66%) have less than 80 percentage of attendance, this difference of observation among both genders has got statistical significance p<0.007were male students with low performance has got low percentage of attendance. In this study the family type has gotno association with the level of performance. To analyze simultaneously on all the variables, gender, understanding the language, unable to study on their own, unhappy with the subjects and problem with their class mates. These answers differ significantly among low performers compared to high performers. Finally the study has been concluded that low achievers (slow learners) needs to concentrate on their regularity of attending their classes so that to have a better performance in their subsequent internal examinations. Many students felt they were not able to study on their own and perform in their internal assessment examination so students can be encouraged group discussions and effective mentorship programme can be generated in order to have better performance in their internal examinations.
Key words: lowachiever, learning capabilities
————————————————————
Introduction:
Academic performance is contributed by many factor including gender, age, medium of instructions,role of teaching faculty, socio economic status and many more factors like adjustability with the peer groups, understanding the language etc. Many studies have been contributed in the area of student’s achievement,in order tofind out and rectifythe factors that reflect on theacademic performance at variouslevels. There are various factors related to low level in the academic setting of the students that may over come and reflect in their career. Student who has better performance in earlier academic setting can do much better. Many articles reflect on the academic performance as low and high achievers, these studies contribute more on the learning capabilities and performance initiatives. In order to find out various factors of performance of student, hence the study is done to find out the prevalence of slow learners and factors contributing for decrease in performance among slow learners.
Review of literature:
Many reviews have been done to find out the academic performance of the student at various levels, a study done byGraetz et all in (1995)1 suggested that the performance of the student is purely based on the social care of the students, the care of the students at the younger age group have increased level of performance and parental support. These indicators have been forecasted in their student test score in examination for future achievements.Similarly a study done in Oregon State University2 (2003) showed 30% of the deviation in initial or starting (first) year at collegeeducation with available sufficient psychological so as make a better performance at the final level. The level of confidence also plays an important role in better performance of the student and gives an proper emotional shore up. A study done by Vinutha et al3 the exact cause of student performance in the academic career is based on multiple factors such as understanding the language, interest in doing higher studies and adjustability with peer groups and understanding of the subject taught in the class. There are other extracurricular and co curricular activities that may contribute to poor performance of the students such as peer and parental pressure, impact in learning the subjects andpersonal, medical and other domestic problems etc. A study done in Regional Primary Care Education, Asheville, North Carolina4 stated that complexity in medical education has got an role in level of performance of the student with reflect predominantly in the formative assessment. Hence learning environment also plays a very important role in the academic performance.
. _______________________
Author: Dr.L.Kannan, Associateprofessor, Department of Community Medicine, Sri Ramachandra University, Chennai-600116- (India)
Email- [email protected]
Co Authors: Dr.P.V.Vijayaragavan,Dean Medical Education,Pankaj.B.Shah,
INTERNATIONAL JOURNAL OF SCIENTIFIC & TECHNOLOGY RESEARCH VOLUME 4, ISSUE 03, MARCH 2015 ISSN 2277-8616
59 IJSTR©2015
www.ijstr.org Ethical considerations:
The data was collected only after obtaining written informed consent. The proposal has been approved by the Institutional ethics committee, Sri Ramachandra University.
Methodology:
A cross sectional study designwas performed on the entire current first year MBBS students, were the students performance is taken of all the three internal assessments includes theory and practical performances.
Study Population:
All current first year students will be taken for the study.
Sampling method and sample size:
Sampling technique is not needed and all individuals of first year MBBS students will be taken for the study which comprised of 250 students. No inclusion and exclusion criteria are needed.
Data Collection tools:
After obtaining the list of students who have secured less than 50% in internal examination from medical education unit, supporting mentors are contacted to meet the students. Confidentiality is maintained throughout the study. After obtaining informed consent, a questionnaire was administered to the students by the investigator. The questionnaire contained the following sections. Section I will be on the background characteristics – name, age, sex, type of family. Section II is on the details of their learning capabilities. Section III will focus on the awareness of the slow learners, precipitating factors contributing to them.Study process was done with the help of questioner as tool and the questions were pertained to the background of information of the study subjects, level of performance andcontributing factor for association of slow learners. Finally the data is evaluated by using SPSS software 16.V to find the possible outcome. This study was done for minimum period of four month from Sep 2015 to Jan 2015
Results:
The prevalence of slow learners as low achievers was contributed to be 32.4 percentages. The performance of the students is based on combination of all three internal assessment marks including theory and practical performance. In this the students age ranges from 17 to 21 years, the mean age of student was contributed to be 17.81 and majority of the students were in the age group of 18 years which contributed to be 168(67.2).In the present study majority were males 132(52.8) compared to females 118(47.2).but when study is compared to percentage of attendance, majority of the individual 151(77%) scored more than 50 percentage of marks have more than 80 percentage of attendance, but when compared to less than 50 percentage of marks majority 36(66%) have less than 80 percentage of attendance, this difference of observation among both genders has got statistical significance p<0.007 were male students with low performance has got low percentage of attendance.Majority of them were from nuclear family which contributed 204(81.6) and remaining of them come from joint family system 41(16.4) and very few belong to other family system 5(2).And when compared to their attendance many who have scored more than 80% of
attendance 165 were from nuclear family and remaining were only 39 who have scored less than 80% of attendance these difference was not statistically significant. When compared with the performance of marks obtained in their internal examination more than 50 percentage of was obtained by students who come from nuclear family which contributed 82.8% when compared to other family system. This differencefamily and their scoring pattern is not statistically significant.
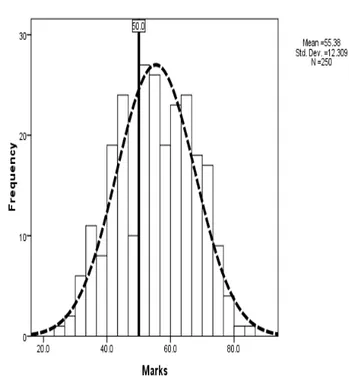
Figure 1 shows the distribution of marks scored by the 250 students. It is evident that the marks are following normal distribution with a mean of 55.We considered 50 percent is
cutoff marks to pass the examination.
Tabe1.indicates the reason shown by the students in question no: 1, 2, 12, 15, 16 and 20 among low and high achievers who have scored in internal examination that among the low achievers who has scored less than 50 percentage of marks in internal examination have promptly agreed the to the reason for their low performance, these difference of observation is statistically significant p<0.005.
Table: 1 Responses and analysis of each variable according to level of performances of students
Variables Response
s <50% >50% p-value Q1- problem
in understandin
g the language
Agree Neutral Disagree
14(60.9) 9(56.3) 58(27.5)
9(39.1) 7(43.8) 153(72.5)
0.001
Q2- interest in doing Medicine
Agree Neutral Disagree
0 9(56.3) 72(31.2)
3(100) 7(43.8) 159(68.8)
0.056
Q3- parents forced
Agree Neutral Disagree
2(50) 7(38.9) 72(31.6)
2(50) 11(61.1) 156(68.4)
0.612
INTERNATIONAL JOURNAL OF SCIENTIFIC & TECHNOLOGY RESEARCH VOLUME 4, ISSUE 03, MARCH 2015 ISSN 2277-8616 60 IJSTR©2015 www.ijstr.org Neutral Disagree 22(32.8) 34(30.1) 45(67.2) 79(69.9) Q5- accustomed to the food
Agree Neutral Disagree 10(43.5) 25(36.2) 46(29.1) 13(56.5) 44(63.8) 112(70.9) .282 Q6- helped by my seniors Agree Neutral Disagree 29(36.3) 23(32.4) 29(29.3) 51(63.8) 48(62.6) 70(70.7) .613
Q7- afraid of failing in the
exams Agree Neutral Disagree 40(36.4) 22(31.4) 19.(27.1) 70(63.6) 48(68.6) 51(72.9) .427 Q8- problems with my classmates/r oom mates Agree Neutral Disagree 4(16.7) 6(23.1) 71(35.5) 20(83.3) 20(76.9) 129(64.5) 0.099
Q9- don’t understand what is taught in class Agree Neutral Disagree 8(40) 23(38.3) 50(29.4) 12(60) 37(61.7) 120(70.6) 0.335 Q10- not able to take
notes Agree Neutral Disagree 818(40.9 ) 19(38.0) 44(28.2) 26(59.1) 31(62.0) 112(71.8) 0.181
Q11- don’t find the environment conducive to study Agree Neutral Disagree 12(52.2) 14(29.8) 55(30.6) 11(47.8) 33(70.2) 125(69.4) 0.104 Q12- feel sick often Agree Neutral Disagree 17(47.2) 18(36) 46(28.2) 19(52.8) 32(64) 117(71.8) 0.074
Q13-. I feel unhappy Agree Neutral Disagree 9(27.3) 9(25.7) 63(34.6) 24(72.7) 26(74.3) 119(65.4) .468
Q14-. I feel threatened Agree Neutral Disagree 9(52.9) 13(34.2) 58(29.9) 8(47.1) 25(65.8) 136(70.1) 0.143
Q15- I don’t belong to the
group Agree Neutral Disagree 10(58.8) 12(32.4) 59(30.1) 7(41.2) 25(67.6) 137(69.9) 0.053 Q16- not able to study
on my own
Agree Neutral Disagree 17(51.5) 15(48.4) 49(26.3) 16(48.5) 16(51.6) 137(73.7) 0.002 Q17- need additional help in learning Agree Neutral Disagree 20(39.2) 20(32.3) 41(29.9) 31(60.8) 42(67.7) 96(70.1) 0.481 Q18- not confident regarding the subject Agree Neutral Disagree 13(35.1) 20(37) 48(30.2) 24(64.9) 34(63) 111(69.8) 0.603
Q19- I don’t understand what is read
Agree Neutral Disagree 6(46.2) 19(39.6) 56(29.6) 7(53.8) 29(60.4) 133(70.4) 0.233 Q20- feel frustrated as I can’t study
Agree Neutral Disagree 20(46.5) 21(34.4) 40(27.4) 23(53.5) 40(65.6) 106(72.6) 0.058
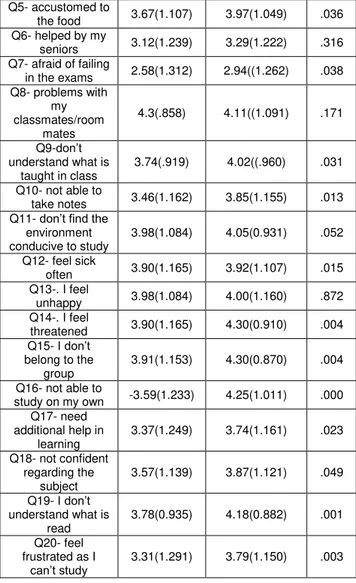
Table 2.Mean scores of different performance compared among low and high achievers.
Variables <50% N=81 Mean(SD) >50% N=169 Mean(SD) P-value
Q1- problem in understanding the
language
3.9(1.22) 4.49(.914) 0.005
Q2- interest in
doing Medicine 4.5(6.9) 4.70(.662) .049 Q3- parents forced 4.4(.808) 4.73(.632) .008 Q4- anxious 3.06(1.307) 3.38(1.268) .063
Q5- accustomed to
the food 3.67(1.107) 3.97(1.049) .036 Q6- helped by my
seniors 3.12(1.239) 3.29(1.222) .316 Q7- afraid of failing
in the exams 2.58(1.312) 2.94((1.262) .038 Q8- problems with
my classmates/room
mates
4.3(.858) 4.11((1.091) .171
Q9-don’t understand what is
taught in class
3.74(.919) 4.02((.960) .031
Q10- not able to
take notes 3.46(1.162) 3.85(1.155) .013 Q11- don’t find the
environment conducive to study
3.98(1.084) 4.05(0.931) .052
Q12- feel sick
often 3.90(1.165) 3.92(1.107) .015 Q13-. I feel
unhappy 3.98(1.084) 4.00(1.160) .872 Q14-. I feel
threatened 3.90(1.165) 4.30(0.910) .004 Q15- I don’t
belong to the group
3.91(1.153) 4.30(0.870) .004
Q16- not able to
study on my own -3.59(1.233) 4.25(1.011) .000 Q17- need
additional help in learning
3.37(1.249) 3.74(1.161) .023
Q18- not confident regarding the
subject
3.57(1.139) 3.87(1.121) .049
Q19- I don’t understand what is
read
3.78(0.935) 4.18(0.882) .001
Q20- feel frustrated as I
can’t study 3.31(1.291) 3.79(1.150) .003
Table2 shows the mean scores of different performance compared among low and high achievers, It has been showed in the question 1,3,14,15,16,19 and 20 that among the low and high achievers both have agreed to the reasons quoted in these questions which ranges from 3.3.06 -3.92 and these differences is found to have statistically significant p<0.005.
Table-3Binary logistic regression model
Variables β S.E of β Exponential β Wald test
Signific ance
Sex -.642 .303 .526 4.506 0.034
Q1 -.562 .240 .570 5.474 0.019
Q8 -.676 .297 1.966 5.180 0.023
Q12 -.537 .217 .584 6.130 0.013
Q13 .439 .246 1.551 3.185 0.074
Q16 -.674 .212 .509 10.12 0.001
INTERNATIONAL JOURNAL OF SCIENTIFIC & TECHNOLOGY RESEARCH VOLUME 4, ISSUE 03, MARCH 2015 ISSN 2277-8616
61 IJSTR©2015
www.ijstr.org Note: Q denotes responses of participants on each variable
To analyze simultaneously on all the variables, the step wise logistic regression procedure has resulted in six important variables they are sex, understanding the language, unable to study on their own, unhappy with the subjects and problem with their class mates. These answers differ significantly among low performers compared to high performers.
Discussion:
Present study prevalence of slow learners contributed to be as low achievers was contributed to 82(32.4) has scored less than 50 percentages of marks in internal assessment examination. Majority of them were from nuclear family which contributed 204(81.6) and remaining of them come from joint family system 41(16.4) and very few belong to other family system 5(2).And when compared to their attendance many who have scored more than 80% of attendance 165 were from nuclear family and remaining were only 39 who have scored less than 80% of attendance these difference was not statistically significant. When compared with the performance of marks obtained in their internal examination more than 50 percentage of was obtained by students who come from nuclear family which contributed 82.8% when compared to other family system. This difference of family and their scoring pattern is not statistically significant. Similar studies have been contributed by various authors and had no progressive differences. It is evident that the marks are following normal distribution with a mean of 55.We considered 50 percent is cutoff marks to pass the examination.The reason shown by the students among low and high achievers in internal examination that among the low achievers of those who has scored less than 50 percentage of marks in internal examination have promptly agreed the to the reason for their low performance in problem in language, Interest to work along with peer groups and, these difference of observation is statistically significant p<0.005. similarly many studies Kolar by vinutha et al3the exact cause of student performance in the academic career is based on multiple factors such as understanding the language,problem in studying on their own,adjustability with peer groups and understanding of the subject taught in the class. There are other extracurricular and co curricular activities that may contribute to poor performance of the students such as peer and parental pressure, impact in learning the subjects andpersonal, medical and other domestic problems etc. In conclusion: low achievers (slow learners) needs to concentrate on their regularity of attending their classes so that to have a better performance in their subsequent internal examinations. Many students felt they were not able to study on their own and perform in their internal assessment examination so students can be encouraged group discussions and effective mentorship programme can be generated in order to have better performance in their internal examinations.
References:
[1] Shoukat Ali et al.,Factors Contributing to the Students Academic Performance: American Journal of Educational Research, 2013, Vol. 1, No. 8, 283-289
[2] Oregon State University (2003). Graduate admissions policy proposal. Retrieved November
23, 2006
Fromhttp://eepm.orst.edu/dept/senate/committees/ aac/agen/reports/20030115.
[3] Vinitha et all.NTTC bulletin 2005-Low achievers- are they really slow learners?