A Research Over The Relationship Between Fast Food Consumption
And Consumer’s Values&Lifestyles in Turkey
Hızlı Gıda Tüketimi
v
e Tüketicilerin Değerleri&Yaşam Tarzlarının İlişkisi
Üzerine Bir Araştırma
Figen YILDIRIM, Assistant Professor, Istanbul Commerce University, [email protected]
Özgür ÇENGEL, Associate Professor, Istanbul Commerce, [email protected]
ABSTRACT In the emergence of globalization, fast food industry has become an important focus of study in today’s business models.In this sense, food industry has been reshaped and eating cultures
have changed. Companies in the food industry responded to this change as an attempt to offer standardized products by meeting the ever-changing consumer needs and wants. To a higher
justification, fast food is initiated to be classified in terms of a system, company, or a product which offers a set menu with a key focus on low cost and standardized products sold worldwide at high quality standards. By looking at cross cultural studies, it is known that the industry has roots in the Americanism and change of eating habits along with cultural transformation process. On the other hand, wellness concept is on the rise putting the primary focus on healthy food even though it is quickly made and served. Besides, with respect to changes in needs and wants, consumer’s lifestyles are changed that effect consumer’s choices. In this study, it is aimed to analyze the relationship between the factors having an impact on fast food preferences and values & lifestyles of university students by taking into consideration the main aspects cited in literature.
Key Words fast food consumption, life style, VALS 2, Turkey.
ÖZET Günümüzde, küreselleşmenin gelişimi ile, değişime uğrayan işletme modellerini açıklamaya yönelik yapılan birçok çalışmanın odak noktası hızlı gıda endüstrisi olmaktadır. Bu anlayışla, gıda endüstirisi yeniden şekil almış ve yemek kültürü değişmiştir. Bu gelişimkarşısında işletmeler, tüketicilerin istek ve ihtiyaçlarını karşılamaya yönelik standart ürünler sunmaya başlamıştır. Hızlı gıda kavramı bir sistem, bir işletme veya ürün olarak sınıflandırılmaktadır. Ürün boyutu ile değerlendirildiğinde, dünyaçapında aynı görünüm, daha önceden belirlenmiş menülerin nispeten düşük fiyatlar ile pazara sunumu şeklinde tanımlanmaktadır. Kültürlerarası çalışmalara bakıldığında, hızlı gıda markalarının kökeni “Amerikan tarzı”tüketim anlayışına dayanmakta ve sözkonusu markalar girdikleri pazarda yemek kültürü ve yeme alışkanlıklarında büyük değişime yol açmaktadır. Bununla beraber, günümüzde “sağlıklı, iyi görünüm” kavramı gelişmiş ve sağlıklı ürünlerin hızlı sunumu konusu önem kazanmıştır. Bununla beraber değişen tüketici istek ve ihtiyaçları doğrultusunda tüketici kararları etkileyen önemli bir unsur olarak değerlendirilen yaşam tarzları değişmiştir. Bu çalışmada, hızlı gıda tüketimine yönelik önceki araştırma bulgularından yola çıkarak hızlı gıda tüketimini etkileyen unsurlar ile üniversite öğrencilerinin değer ve yaşam tarzlarının ilişkisini incelemek amaçlanmıştır.
1. Conceptual Framework and Literature Review
Starting fom the second half of 19th century, there has been a migration to cities from the villages and an industrialization process along with the urban growth in the era of Industrial revolution took place. Consumers have started to change their nutrition habits due to the fact that there are more women in the work force, technology has developed, urbanization is on the rise, more heavy work load is typical, more travelling is mandatory, and more living alone is preferred. Thus, there is a tendency to stay away from traditional nutrition habits (Öncü et al., 2007: 319). On the other side, economic conditions require families to control their expenditures on food and beverages consumed out of home. It can be said that traditional restaurants are relatively highly priced compared to fast food restaurants. Thus, such restaurants better serve the mid-income level families (Atılgan et al., 2005: 238).
The best known product line among the fast consuming products is fast food products. As eating out culture is becoming popular, consumers tend to move towards the concept of experiencing standardized practical products without spending any effort in reaching them. In this sense, the advancement of internet technology has enabled consumers to experience this easiness as well (Baig & Saeed, 2012: 3). E-business has enabled many consumers to order fast food products online to either homes or offices which brought a great level of convenience to consumers. In return, such approach has increased the purchasing volume of fast food products without consumers spending any effort (Şahingöz,
2011: 378).
The term of fast food can be classified on the grounds of a system, company, or a product. In a product definition, a fast food product is declared as anything that can be sold in a restaurant(Shortman, 2010: 318). Fast food is also known as “american experience” or “the taste of american lifetsyle” ( Grier et al., 2007: 223). The major driving force of fast food is its being low cost and quick service. Fast food products are usually in the shape of a finger and called “finger products” not requiring any forks and knives. As a system, it is described as offering a fast food with a limited menu serving a large number of consumers at short period of time focusing on standardized methods. In fast food restaurants, fast food is cooked and preserved at a certain heat or reheated on the order process by offering a value for money (Öncü et al, 2007: 319).
The fast food restaurants differ from regular restaurants in terms of production (cooking), marketing, and customer profile. First of all, fast food restaurants either focus on a specific group of products such as hamburgers, or product lines such as fish products, or country products such as Chinese foods. They are mostly managed by large chains or franchises. They offer convenience products suchs as frozen food or concentrated drinks and syrups. The form of cooking is partially or fully automated. Food service method is simplified and standardized (Kara et al., 1997: 319).
entered the market, some local imitators arose, however the fast food companies who became successful in the branding process moved forward in the competition and offered great alternatives to the consumers (Atılgan et al, 2005: 238).
Among the many reasons that may be potentially listed, the major preference reason of fast food restaurants derives from the fact that the eating habits have changed tremendously in the emergence of modern economy, and cultural transformation process(Baig & Saeed, 2012: 79)in terms of socio-cultural change, change in nutrition habits, socio-economic change, and technological advances. Cultural influences can be cited as the major source of how fast food restaurants have initially started in the American society as a result of cultural change and then moved towards the European countries. This cultural influences factor may also be titled McDonaldism (Kara et al., 1997: 320). In the Turkish society as a result of quick structural and social change, a new lifestyle and rules have been established. In addition, since there are more women in the work force and all the family members are working, the lifestyles of individuals and thus their consumption behaviors have changed. A justification for this change in consumption behavior can be associated with the recent increase in the number of McDonald’s, Pizza Hut and Burger King restaurants, especially in the big cities of Turkey. Especially, as numbers of shopping malls within food courts are becoming increased, consumers can easily consume fast food (Şahingöz, 2011: 378).
Even though consumers are used to fast food products, “wellness” concept is the new trend in this industry as consumers are willing to consume healthy fast food. In the era of healthy living, consumers are highly concerned about their choice of food as they are sensitive on the issue of nutritional value products which in return offer a high level of quality and value for them. As the consumers become well aware of the products as a result of them being more informed and educated, such factors as safety, freshness, storage, preparation, consumption, price, packaging, and place of purchase become the dominant forces in the consumer’s purchase intention along with quality and safety as cited in the recent literature (Binkley, 2006: 373). A reputable number of survey indicates that price by itself is not the major factor of purchase intention, however it is a common research output that seeking a better value for money is the crucial aspect of conducting business (Bagozzi, et al., 2000: 98). Several researches identify that food quality and fresh ingredients are the most critical factors of success in the fast food industry (Öncü, 2007: 321; Knutson, 2000: 67).
the calorie levels of consumers dramatically satifying the significant portion of daily enery need required. In this concept, fast food companies who offer salads, healthy drinks, and diet menus are on the rise. There are numerous studies on the topics of the incease in fast food consumption and consumer preferences of nutrition (Şahingöz, 2011: 378).
There are eleven aspects of deciding on a fast food preference in the process of consumption. These are listed as price, responsiveness of employees, diversity of menu, service swiftness, calorie content, cleanliness/environment of the outlet, convenience, business hours/elimination of gap in meal, delivery service, inventiveness for children, seating facilities. In this strategy, fast food restaurants strived hard to fulfill the gap in meal through offering breakfasts, lunch and dinners. Besides, they engaged in vertical expansion rather than conducting horizontal menü expansions. Most successfully, they generated discount coupons, targeted youngsters, provided play land areas, and organized birthday parties for children. In addition, food is most of the time delivered to the work environment or homes as part of an attempt in being convenient to the consumer groups (Ahlgren et al, 2004: 161). On the other hand, as poisoning due to the fast food is on the rise, food safety has been a topic of interest for fast food restaurants (Knutson, 2000: 69).
Besides, one of the important choice criteria about the fast food consumption is service quality. Service quality is dependent upon production (cooking) speed. Overall, production and service speed is dependent upon technological capabilities (Kara et al., 1997: 320). Especially, within the aid of technological advances, there is more efficiency on the preservation, packaging, and freezing process of fast food products (Baig & Saeed, 2012: 4).
There are numerous studies on the topics of the incease in fast food consumption and consumer preferences of nutrition. Many studies have stated that the reason why young consumers go to fast food restaurants is that they are more fun and they go there for a change to stay away from routine life (Bagozzi et al, 2000: 98). On the other side, Cullen (1994) states that Americanism of eating out has reshaped the fast food industry and provided a feedback for convenience.
The trend nowadays in the fast food industry is low calorie, light, and low fat products. In addition, increased customer service is the differentiating factor in this industry. For example, McDonald’s values customer care, while Dominos Pizza promises a 30 minute delivery (Baig & Saeed, 2012: 4).
Life style measurements:
The research of lifestyle is critical in consumer behavior in terms of psychographic variables. In this sense, it is perceived as a means to spend time, energy while paying the ultimate attention in understanding what kind of priorities consumers have and what consumers think of others around their environment (Schiffman et al, 1991:87; Sheth et. al,1991:160; Solomon et al., 2010: 97)
So, it can be said that people with the same education and income may vary in their lifestyles. Thus they may not have a common point of view (Solomon et al., 2010: 88).
In order to measure personal values, several scales have been used. The most used measurement scales are named activities, interests and opinions (AIO), Rokeach Value System (RVS), List of Values(LOV), Values and Lifestyle System(VALS), and values and life style 2 (VALS2) (Solomon et al., 2010: 99).
AIO is found by Wells in 1972 by observing the profiles of consumers. Thus he has focused on 406 questions specifically paying attention to individual’s activities, points of interest, and ideas (Deniz et al, 2011: 83). This study establishes the basis for further studies on psychographic and lifestyle studies. In AIO studies, the major area of study is to understand the consumer’s lifestyle and predict the personality traits based on their area of interest and ideas. The activity areas consist of understanding what consumers do, what they buy, how they spend their leisure time etc. Areas of interest is associated with consumer preferences, however ideas are associated with consumer’s perception of issues related to world, local, moral, economic, and social relations (Bearden & Netemeyer, 1999: 118).
Secondly, Rokeach Value System is found by Milton Rokeach in 1973. Rokeach, in his book “The Structure of Human Values” state that all humans have values but that all are in different patterns. He stated that personal values affect attitudes. So, he claimed that values are more important to analyze in understanding human behavior (Bearden & Netemeyer, 1999: 118). Rokeach defines eighteen values under two topics: instrumental values and functional values. Functional values constitute to the ideal needs of consumers such as convenience, freedom, family safety etc. Instrumental values are the behaviour patterns to reach the functional values such as being kind, brave, honest, and eager etc. These two values are titled value system in Rokeach Value System.
Another scale is List of Values found in 1983 by Kahle. In the generation of LOV, Maslow’s and Rokeach’s studies have been revealed. Based on Kahle’s point of view, individual’s value depends on the roles they play in the society. Thus individual’s value improves based on interaction within the society and experiences earned such as marriage, work environment etc (Bearden & Netemeyer, 1999: 115).
On the other hand, value and life style system is generated in 1978 in Stanford Institute. VALS takes psychographic factors into consideration. Maslow’s Needs Hierarchy is highly referred to in the formation of VALS. In addition, individual demographic characteristics and life style has been considered. VALS 2 has been generated as VALS is not applicable to marketing problems. VALS 2 mainly focuses on the purchasing pattern of individuals based on their characters. In this process, eight categories have been identified.
aspects of self confidence, interpersonal skills, inventiveness, intelligence, eagerness to buy, money, position, and education.
Consumer life style groups based on consumers’s resources and personal communication are as follows:
Actualizers: A group of people who are researchers, successful, highy educated, and carry leadership skills. These people follow new ideas/technology and they act based on their principles and sometimes they aim to behave based on affecting people around themselves. They are active consumers and purchase products of upper social classes. Image, power, and statue are determinants of their freedom and personality. They deal with social activities and open to change.
Fulfilleds: These people are relaxed and mature people who value responsibility and knowledge. Most of them are highly educated and research oriented before making a decision. They are responsive to current news in their country and the World and are keen on developing themselves. They value social rules and social authority and are open to new ideas. They have high income level but are logical consumers. Reliability, functionality, and value of products are important to them.
Achievers: They aim to control their lives and value work environment and success in work environment. Their social life is structured around their families and career. They have traditional lives and their political view is conservative. They are respectful to the current authority. They see the future opportunities and focus on their expertise rather than taking risks and having sincere relations. They are active consumers as they have tremendous needs and wants. Image is important for this group of consumers. They seek prestigious products and services to prove their success.
Experiencers: These people are young, dynamic and crazy consumers who seek excitement, extraordinary and innovative products. Their ideas of change and excitement are temporary which changes from time to time. Most of their activities are related with sports, entertainment, and social activities. Most of their income is spent on clothing, readily available food, music, films and cinema.
Believers: They are traditional people who are conservative and attached to their traditions. They value their families, religion, society, and social rules. They are highly religious people. Their social activities are based upon their families, homes and social/religious groups they belong to. They have limited income and they prefer local products.
Strivers: They value fashionable products and entertainment. They give importance to the view of others as they are uncapable in terms of economic, social, psychological resources. Money means success to them as they behave unplanned and get bored quickly. They purchase products that are similar to the products bought by affluent people.
Strugglers: These people are poor, low educated, old, and unqualified people who don’t have tight social links. They are sceptic about their health and are shy. They have very low income which is not enough to support their daily needs. Thus they can not purchase anything targeted towards their pleasure. They are not the target market for many products. However, they are loyal to products and brands of their choice.
In this sense, consumers’ values and lifestyles is a key determinant to understand the consumer buying decision making process. Respect to the previous studies, the aim of this research is determining fast-food consumption habits of university students regards to different values and lifestyles.
2. Research Methodology
Major focus of the research has been invested on the specific indication of;
- the process in observing the general attitude towards fast food consumption
- the relationship between consumer’s values and lifestyles concerning reasons for
preferring fast food products.
Research consists of two topics: factors affecting fast food consumption and types of consumers’ values and lifestyles.
Self administered questionnaire is conducted to survey of fast food consumption habits used different versions of scale determined by previous studies (David and Lockwood,1994; Kotler.et al.,2003; Öncü.et al., 2007; Sahingoz, 2011). The questionnaire consists of four parts. The first part is about general questions regarding fast food product consumption and shopping behavior. The second part includes questions regarding dimensions of consumer’s fast food product preferences. At the third part, VALS 2 scale is used to determine consumers’ values and lifestyles types. All items in second and third part are rated on a five point Likert scale (1-strongly disagree, 5- strongly agree). In the last section, demographic information is being revelaed.
The people who responded to the survey are undergraduate students in Istanbul. In the same sense, many studies are cited to focus on university students considering their frequency of consumption and their higher level of preferences for fast food products. Convenience sampling has been conducted to 448 university students in Istanbul, however the surveys that have been taken into consideration is 416, leaving 32 surveys idle.
factor analysis and correlation analysis have been utilized to determine the relations between factors affecting fast food consumption and types of consumer’s values and lifestyles.
3. Findings
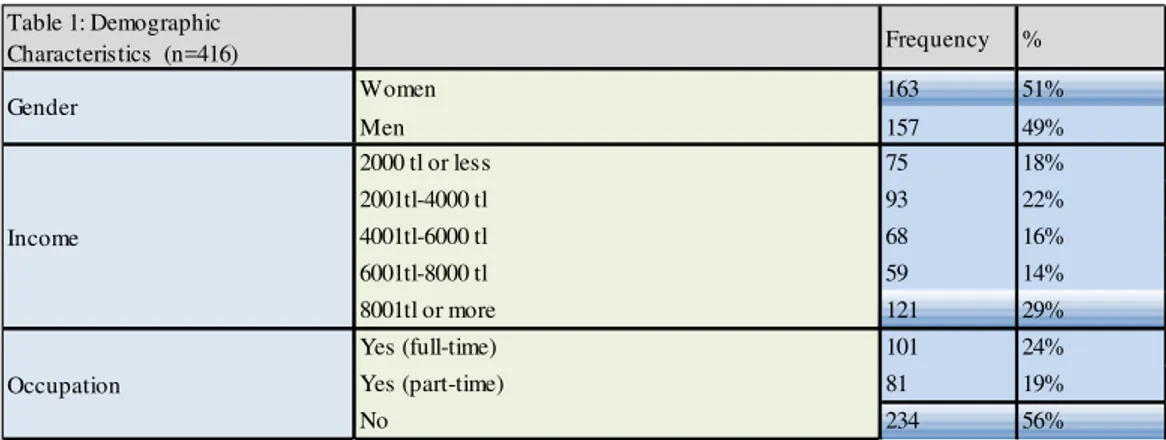
The descriptive statistics about people who responded to the survey may be summarized as shown below;
Table 1: Demographic
Characteristics (n=416) Frequency %
Women 163 51%
Men 157 49%
2000 tl or less 75 18%
2001tl-4000 tl 93 22%
4001tl-6000 tl 68 16%
6001tl-8000 tl 59 14%
8001tl or more 121 29%
Yes (full-time) 101 24%
Yes (part-time) 81 19%
No 234 56%
Gender
Income
Occupation
Table 2: Fast Food Consumption
Frequencies (n=416) Frequency %
Yes 245 59%
No 171 41%
Service speed 188 45%
No opportunity to have proper meal 52 13%
Convenient 41 10%
Delivery service 29 7%
Wide variety of menu 29 7%
Square meal/ calorie content 25 6%
Low price 17 4%
Likes to try new tastes 15 4%
Other reasons 20 5%
Everyday 33 8%
More than once per week 150 36%
Once per week 43 10%
More than once per month 105 25%
Once or less than once per month 85 20%
Breakfast 10 2%
Lunch 223 54%
Snacks between meals 69 17%
Dinner 114 27%
ARBYS 20 5%
BAMBI 20 5%
BURGER KING 189 45%
DOMINOS PIZZA 15 4%
HACIOGLU LAHMACUN 16 4%
KENTUCKY FRIED CHICKEN 22 5%
MC DONALDS 66 16%
PIZZA HUT 10 2%
RAMIZ KOFTE 28 7%
SUBWAY 13 3%
Fast food consumption mostly prefered period
Factors influencing the acquisition of fast-food consumption habit
Fast food consumption frequency
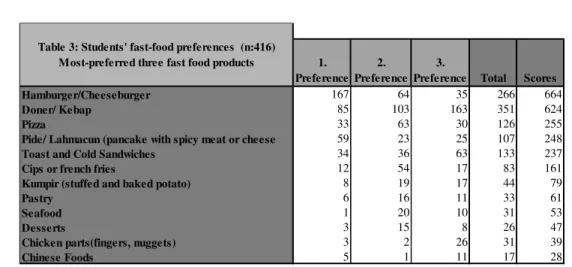
For more obvious comparisons of university students' fast-food preferences, the formula Pre = 3Pre1 +2Pre2 + Pre3 is used for calculating weighted scores. In this formula, Pre shows total score, Pre1 shows first preference, Pre2 shows second preference, and Pre3 shows third preference (Yardımcı, et.al., 2012). As a result it can easily seen that hamburger is most preferable fast food products, following Doner/Kebap product category which are traditional Turkish food is highly prefered. If the weighted scores were not included; Pide/Lahmacun could be considered as following Doner/Kebap. To have an obvious comparison, looking scores results that pizza is considered highly second choice of the responents and follows the Doner/Kebap category.
Factor Analysis of Fast Food Consumption
In this part of the paper, the data is being analyzed by exploratory factor analysis has been generated for each dimension in rotation component matrix. In confirmatory factor analysis, items whithin the result of less than 0,50 disregarded from data analysis. The scale in general has been calculated with the Cronbach’s Alpha value which change from 0,52 to 0,81. In order to proceed with factor analysis, KMO and Bartlett’s test should be 0.60 or higher the factor analysis data is appropriate with the value of 0,81 and significant.
1. Preference
2. Preference
3.
Preference Total Scores
Hamburger/Cheeseburger 167 64 35 266 664
Doner/ Kebap 85 103 163 351 624
Pizza 33 63 30 126 255
Pide/ Lahmacun (pancake with spicy meat or cheese 59 23 25 107 248
Toast and Cold Sandwiches 34 36 63 133 237
Cips or french fries 12 54 17 83 161
Kumpir (stuffed and baked potato) 8 19 17 44 79
Pastry 6 16 11 33 61
Seafood 1 20 10 31 53
Desserts 3 15 8 26 47
Chicken parts(fingers, nuggets) 3 2 26 31 39
Chinese Foods 5 1 11 17 28
Factor Analysis for Consumer’s Values and Lifestyles- VALS 2
Factor analysis has been generated for each scale and it has been verified that prior structural features have been kept. Construct reliability estimates has been calculated with the Cronbach’s Alpha values for five types of consumers’values and lifestyles- experiencers, strivers, fulfilleds, believers, makers different than the original scale (within eight lifestyle types) which are friendly with the inner coherence (α>0,50) and the reliability is obtained. According to KMO and Bartlett’s test the factor analysis data is appropriate with the value of 0,83 and significant.
1 2 3 4 5
Physical apperance of the restaurants are important for me. ,784 ,241 ,223 ,056 ,015
I am mostly influenced by advertising and promotional campaign of the fast food brands. ,771 ,073 ,052 ,089 ,110 Store atmosphere is one of the main factor for fast food brand choices for me. ,692 ,169 ,398 ,103 ,034
Pricing strategy of the fast food brands usually affect my choices. ,635 ,116 ,000 ,152 ,489 Comfort is important for me while having a fast food consumption. ,631 ,190 ,357 ,101 ,207
Brand image of the fast food brands is so important. ,614 ,209 ,109 ,120 ,449
I can easily find fast food restaurants' branches. ,199 ,803 ,061 ,179 ,099
I prefer fast food store near my house/work has branches. ,218 ,737 ,177 ,279 ,044
The main reason of preference of consuming fast food is their service speed. ,204 ,719 ,077 -,095 ,206
I can easily reach fast food brands that I prefered. ,050 ,699 ,133 ,267 ,168
Parking advantage is one of the important criteria for my choice. ,083 ,074 ,716 ,084 ,102 Treating equally to each customer philoshopy is one of the important reason for me in adopting
much more in fast food consumption.
,173 ,077 ,695 ,231 ,322
Employees to be well-groomed is important for fast food brand preference. ,467 ,152 ,592 ,014 -,042
Employess' interest and involvement to my needs are important for me. ,369 ,194 ,524 ,213 ,140
I find fast food products more tasty. ,183 ,088 ,053 ,803 ,194
Temperatures of products at fast food services are always same. ,019 ,166 ,140 ,775 ,093
The freshness of products is main reason for my preference on having fast food consumption. ,159 ,357 ,269 ,563 -,083
Fast food consumption is highly related with fast food products' appropriate prices. ,186 ,165 ,143 ,119 ,811 Standard presentation of portions of the fast food products is important for me. ,137 ,274 ,414 ,087 ,622 PERCEIVED VALUE
Rotated Component Matrixa
Component
BRAND IMAGE
SPEED & CONVENIENCE
SERVICE STAFF & ADDITIONAL SERVICE
OFFERINGS
PRODUCT FEATURES
,810 Approx.
Chi-Square 6057,755
df 351 Sig. ,000 KMO and Bartlett's Test
Correlation Matrix
**Correlation is significant at 0.01 LEVEL(2-tailed)
1 2 3 4 5
I enjoy to have excitement in my life. ,895 ,117 -,009 ,028 -,001 Mostly I am looking for enthusiasm. ,864 ,077 ,112 ,093 -,017 I like the challenge of doing something I have never done before. ,842 ,096 ,220 -,006 ,170 I like to try new things. ,767 ,047 ,357 ,100 ,067 I seek for a thrill. ,763 ,164 -,094 -,013 ,188 I like to do new and different activities.. ,731 ,179 ,156 -,015 ,197 I like a lot of variety in my life. ,699 ,036 ,416 ,141 ,044 I like extraordinary people and unusual things. ,579 ,187 ,311 -,214 -,026 I follow the latest trends and fashions. ,099 ,854 ,185 ,085 ,085 I like to wear fashionable clothes. ,161 ,826 ,039 ,114 ,019 I want to be stylish and admired by people as an fashion pioneer. ,138 ,812 -,048 ,020 ,060 I dress fashionably than the most people. ,119 ,801 ,102 -,032 ,061 I would like to understand more how the universe works. ,076 ,059 ,749 ,063 ,049 I closely follow developments around the world. ,262 ,133 ,729 ,054 ,071 I like to learn about history, art and culture. ,281 ,034 ,688 ,151 ,256
The government should encourage religious education in schools. ,003 ,038 -,027 ,842 ,084 There are many immoral television programs. -,022 ,073 ,106 ,829 -,012 As it mentioned in Quran, the world was created within six days. ,086 ,041 ,145 ,730 ,126 I like doing things requiring hand skill and handcraft. ,096 ,063 ,111 ,100 ,924 I like doing things requiring hand skill and things I can use. ,213 ,138 ,180 ,112 ,877 MAKERS
Rotated Component Matrixa
Component EXPERIENCERS STRIVERS FULFILLEDS BELIEVERS ,829 Approx. Chi-Square 4801,274 df 190 Sig. ,000
KMO and Bartlett's Test
Kaiser-Meyer-Olkin Measure of Sampling Adequacy.
Bartlett's Test of Sphericity
BRAND IMAGE
SPEED & CONVENIENCE
SERVICE STAFF & ADDITIONAL
SERVICE
PRODUCT FEATURES
PERCEIVED
VALUE EXPERIENCERS STRIVERS FULFILLEDS BELIEVERS MAKERS Pearson
Correlation
1 ,000 ,000 ,000 ,000 ,169**
,168** ,084 ,045 ,106*
Sig. (2-tailed) 1,000 1,000 1,000 1,000 ,001 ,001 ,086 ,364 ,031
N 416 416 416 416 416 416 416 416 416 416
Pearson Correlation
,000 1 ,000 ,000 ,000 ,236** -,057 ,325** ,054 ,013
Sig. (2-tailed) 1,000 1,000 1,000 1,000 ,000 ,250 ,000 ,268 ,791
N 416 416 416 416 416 416 416 416 416 416
Pearson Correlation
,000 ,000 1 ,000 ,000 ,098* ,134** ,039 ,122* ,064
Sig. (2-tailed) 1,000 1,000 1,000 1,000 ,045 ,006 ,432 ,013 ,191
N 416 416 416 416 416 416 416 416 416 416
Pearson Correlation
,000 ,000 ,000 1 ,000 ,093 ,080 ,006 ,056 ,211**
Sig. (2-tailed) 1,000 1,000 1,000 1,000 ,057 ,103 ,902 ,253 ,000
N 416 416 416 416 416 416 416 416 416 416
Pearson Correlation
,000 ,000 ,000 ,000 1 ,241** -,068 ,111* ,032 ,080
Sig. (2-tailed) 1,000 1,000 1,000 1,000 ,000 ,169 ,024 ,514 ,104
N 416 416 416 416 416 416 416 416 416 416
Pearson Correlation
,169**
,236**
,098* ,093 ,241** 1 ,000 ,000 ,000 ,000
Sig. (2-tailed) ,001 ,000 ,045 ,057 ,000 1,000 1,000 1,000 1,000
N 416 416 416 416 416 416 416 416 416 416
Pearson Correlation
,168** -,057 ,134** ,080 -,068 ,000 1 ,000 ,000 ,000
Sig. (2-tailed) ,001 ,250 ,006 ,103 ,169 1,000 1,000 1,000 1,000
N 416 416 416 416 416 416 416 416 416 416
Pearson Correlation
,084 ,325** ,039 ,006 ,111* ,000 ,000 1 ,000 ,000
Sig. (2-tailed) ,086 ,000 ,432 ,902 ,024 1,000 1,000 1,000 1,000
N 416 416 416 416 416 416 416 416 416 416
Pearson Correlation
,045 ,054 ,122* ,056 ,032 ,000 ,000 ,000 1 ,000
Sig. (2-tailed) ,364 ,268 ,013 ,253 ,514 1,000 1,000 1,000 1,000
N 416 416 416 416 416 416 416 416 416 416
Pearson Correlation
,106* ,013 ,064 ,211** ,080 ,000 ,000 ,000 ,000 1
Sig. (2-tailed) ,031 ,791 ,191 ,000 ,104 1,000 1,000 1,000 1,000
N 416 416 416 416 416 416 416 416 416 416
BRAND IMAGE
SPEED & CONVENIENCE
*Correlation is significant at 0.05 LEVEL(2-tailed)
Correlation coefficients between consumer’s values and lifestyles and fast food consumption are calculated. The calculated coefficients are presented above.
According to correlation analysis;
Brand image, speed & convenience and perceved value are a significant influence on fast food consumption of experiencers.
The significant influence to strivers during their fast food consumption are brand image and service staff & additional service offerings.
Whereas fulfilleds lifestyle has a relation with convenience factor, makers are influenced by fast food product features during their consumption.
4. Conclusion
In this study, consumer’s value and lifestyles are researched in the context of fast food consumption. Based on the findings, service speed and convenience are cited as the major concepts that are given priority in fast food consumption. Besides, because of highly speed lifestyles(experiencers) people mostly have no chance to eat their proper meal prefers fast food products practically.
Fast food brands should pay the greatest attention to point of purchase communications while establishing their marketing strategies. In addition, they should motivate the consumers through extensive promotional strategies by enabling the consumers to try new tastes. Based on the research findings, it is seen that consumers expect lower prices in fast food consumption which is justified by the current literature. Fast food brands have to learn more about consumers values and lifestyles. By detailed targeting group’s lifestyles, remarket their products.
Since the constraints of this study include the university students in Istanbul, it may be recommended that the research can be applied to consumers who have different socio-economic profiles and characteristics. Besides, comparison between different fast food brands and fast food product categories can be considered (recommended to be conducted) in future research initiatives. In additional, cross-cultural studies can also be done (recommended to be conducted) including Turkey.
BIBLIOGRAPHY
Ahlgren, M., Gustafsson, I. & Hall, G.(2004). Attitudes and beliefs directed towards
ready-meal consumption. Blackwell Publishing Ltd.,Food Service Technology,
Atılgan E., Aksoy Ş.& Akıncı S.(2005). Determinants of brand equity: A verification
approach in the beverage industry in Turkey. Marketing Intelligence & Planning, 23(3), 237-248.
Baig A.K.& Saeed M.(2012). Review of trends in fast food consumption, European
Journal of Economics, Finance and Administrative Sciences, 48.
Bearden W.O. & Netemeyer, R.G. (1999) Handbook of marketing scales: multi- item
measures for marketing and consumer behavior research. Sage Press Inc., 2nd Edition.
Binkley J.K.(2006). The effect of demographic, economic, and nutrition factors on the frequency of food away from home. The Journal of Consumer Affairs, Winter, 372-391.
Grier, S.A., Mensinger J., Huang S.H., Kumanyika S.K. & Stettler N.(2007) Fast Food Marketing and Children’s Fast Food Consumption: Exploring parents’
influences in an ethnically diverse sample. American Marketing Association,
26(2), 221-235.
Kara, A., Kaynak, E., Küçükemiroğlu, O.(1995). Marketing Strategies for Fast-food
Restaurants: A Customer View. International Journal of Hospitality Management,
7(4),16-22.
Knutson, B. J.,(2000). College Students and Fast Food – How Students Percieve Restaurant
Brands, Cornell Hotel and Restaurant Administration Quarterly,41(3), 2000, 68-74.
Öncü M.A., Çatı K. & Özbay G.(2007). Hızlı yiyecek işletmelerinin tercihinde etkili
olan faktörler. Dokuz Eylül Üniversitesi Sosyal Bilimler Enstitüsü Dergisi.
9(1),317-336.
Parasuraman, A., Zeithaml V. A.& Berry L. L.(1988). Servqual: a multiple-item scale
for measuring consumer perceptions of service quality. Journal of Retailing,
64(1),12-40.
Schiffman L.G., Hansen H.& Kanuk L.L. (1991). Consumer Behaviour, (4.ed.), Englewood Cliffs, Prentice Hall.
Schortman A.(2010). “The children cry for Burger King” modernity, development,
and fast food consumption in Northern Honduras, Interdisciplinary Journal of
Contemporary Research in Business, 318-337.
Sheth, J., Newman, B. & Gross, B.(1991). Why we buy what we buy: a theory of
consumption values, Journal of Business Research, 22(1), 159-170.
Solomon, M.R., Bamossy, G., Askegaard S. & Hogg M.K.(2010). Consumer Behaviour:
A European Perspective,(Fourth edition), UK, PrenticeHall.
Şahingöz S.A.(2011). Fast food and snack food consumption of adolescents in Turkey,
Journal of Society for development in new net environment in B&H. 5(2), 378-387.
Yardımcı H.Ozdogan Y., Ozcelik A.O. & Surucuoglu M.S.(2012). Fast food
consumption habits of university students: the sample of Ankara. Pakistan