ABSTRACT:Objective: To identify areas and risk factors in cardiovascular disease (CD) mortality associated with air pollution from high exposure to vehicular traic. Methods: Cross-sectional study of CD mortality in 2,617 individuals aged 45-85 years living in the urban area of Cuiabá and Várzea Grande, Mato Grosso State, Brazil, between 2009 and 2011. We used the residential proximity of up to 150 meters to a roadway of great vehicle low as a proxy of high exposure to air pollution from vehicular traic. The association between age, gender, income, and traic intensity with vehicular traic exposure was assessed through the multiple logistic regression. We conducted stratiied analyses to observe the inluence of seasons and groups of causes. We used Bernoulli’s spatial model of probability to identify high-risk clusters. Results: Risk factors for CD mortality associated with high exposure to vehicular traic were: living in census tracts with very unequal income (OR = 1.78; 95%CI 1.36 – 2.33), heavy traic (OR = 1.20; 95%CI 1.01 – 1.43), and female gender (OR = 1.18; 95%CI 1.01 – 1.38). The CD mortality risk increases about 10% during the dry season period. We identiied nine areas of risk. Conclusion: High exposure to traic is associated with CD mortality in Cuiabá and Várzea Grande. Income inequality, traic intensity, and female gender presented as the main determiners for this exposure. The dry season period enhances the efects of traic exposure.
Keywords: Socioeconomic factors. Air pollution. Spatial analysis Epidemiological surveillance. Environmental management.
Risk factors in cardiovascular
disease mortality associated with
high exposure to vehicular traic
Fatores de risco para mortalidade por doenças
cardiovasculares associados à alta exposição ao tráfego veicular
Poliany Cristiny de Oliveira RodriguesI, Emerson Soares dos SantosII, Sandra de Souza HaconIII, Eliane IgnottiI
IUniversidade do Estado de Mato Grosso– Cáceres (MT), Brazil. IIUniversidade Federal do Mato Grosso– Cuiabá (MT), Brazil. IIIEscola Nacional de Saúde Pública– Rio de Janeiro (RJ), Brazil.
Corresponding author: Poliany Cristiny de Oliveira Rodrigues. Rua 07, Quadra D, Lote 06 – Residencial Marechal Rondon, CEP 78200-000 – Cáceres (MT), Brasil.
Conlict of interests: nothing to declare – Financial support:Rede Brasileira de Pesquisas sobre Mudanças Climáticas Globais (Rede Clima) in partnership with Brazilian Funding Authority for Studies and Projects (FINEP).
INTRODUCTION
The harmful efect of air pollution that results in cardiovascular diseases (CD) mortality has been widely demonstrated in literature1. Although the action mechanisms and charac-teristics of individuals still need to be identiied more clearly, there is evidence that great part of the side efects for human health regarding air pollution in large urban centers may be attributed to emissions from vehicular traic2,3.
Car emissions represent a complex mixture of air pollutants, including carbon mon-oxide (CO), nitrogen mon-oxides (NOx), particulate matter (MP), sulfur dioxide (SO2), and ozone (O3). These emissions signiicantly contribute to the increase of air pollution levels, mainly around roadways2. Several epidemiological studies have pointed out that residential proximity to a great vehicle low or to heavy traic areas is associated with CD mortality4-6.
The most observed dose-response relationship has been for a proximity of up to 150 meters to a roadway of great vehicle low3. However, this relationship may considerably increase or decrease, depending on traic intensity, concentrations and kinds of emitted pollutants, and weather conditions. Some authors have also reported that low socioeconomic popula-tions may present higher residential exposure to traic and air pollution7,8. In addition, fac-tors such as age, gender, race, and medical conditions might also enhance the harmful air pollution efects related to human health9-11.
RESUMO:Objetivo: Identiicar áreas e fatores de risco para a mortalidade causada por doenças cardiovasculares (DC) associados à poluição do ar proveniente da alta exposição ao tráfego. Métodos: Estudo transversal da mortalidade por DC em 2.617 indivíduos de 45 a 85 anos residentes na zona urbana de Cuiabá e Várzea Grande, Mato Grosso, entre 2009 e 2011. Utilizou-se a proximidade residencial de até 150 metros de uma via de grande luxo de veículos como proxy da alta exposição à poluição atmosférica proveniente do tráfego. A associação entre idade, sexo, renda e intensidade do trânsito com a exposição ao tráfego foi avaliada por meio de regressão logística múltipla. Foram realizadas análises estratiicadas para observar a inluência das estações do ano e dos grupos de causas. Utilizou-se modelo espacial de probabilidade de Bernoulli para identiicação de áreas de risco. Resultados: Os principais fatores de risco para mortalidade por DC associados à alta exposição ao tráfego foram: residir em setores censitários com renda muito desigual (OR = 1,78; IC95% 1,36 – 2,33), trânsito intenso (OR = 1,20; IC95% 1,01 – 1,43) e sexo feminino (OR = 1,18; IC95% 1,01 – 1,38). O risco de mortalidade por DC aumenta cerca de 10% no período de seca. Foram identiicadas nove áreas de risco. Conclusão: A alta exposição ao tráfego está associada à mortalidade por DC em Cuiabá e Várzea Grande. A desigualdade de renda, a intensidade do trânsito e o sexo feminino apresentaram-se como os principais determinantes dessa exposição, além da estação seca potencializá-la.
Knowledge of the factors associated with CD mortality associated with high traic expo-sure may provide comprehension on the diferent risks in several subgroups and subsidize the creation of more efective socioenvironmental policies. Furthermore, residential prox-imity to heavy vehicular traic roadways is presented as a simple and viable solution to cap-ture the local variation of exposure to pollutants related to traic, mainly in areas where season data are not available. This study aims to identify areas and risk factors in CD mor-tality associated with air pollution from high exposure to vehicular traic.
MATERIALS AND METHOD
STUDY DESIGN
Cross-sectional study to identify areas and factors that result in CD mortality associated with high exposure to vehicle traic.
STUDY POPULATION AND AREA
The study was carried out in the cities of Cuiabá and Várzea Grande that form a large urban area with around 800 thousand residents in the metropolitan area of Vale do Rio Cuiabá in Mato Grosso, Brazil. The demographic density is about 155.19 residents/km2 and there is a 96% urbanization level12. The leet size has had a huge increase in the area. For instance, during the 2004-212 period, this growth presented a percentage variation of 118% for Cuiabá and 127% for Várzea Grande. The cities are surrounded by important roadways in the state and federal scenario, which are responsible for a great vehicle low in the main roadways13.
The study population comprises 2,617 individuals aged 45-85 years living in the urban area of Cuiabá and Várzea Grande that died due to CD (Chapter IX of the Tenth Review of the International Classiication of Diseases — ICD-10 — codes I00 to I99) between January 1st of 2009 and December 31st of 2011.
DATA SOURCE
DATA ANALYSES
The dependent variable was used for investigating the risk factors that cause CD mor-tality associated with pollution from high traic exposure; and the independent variables were the potential factors associated with CD death (age, gender, income ratio of cen-sus tract, and date of death). Variables that presented p ≤ 0.2 in univariate analyses were included in the multiple logistic regression model. The inal model only included vari-ables that presented p ≤ 0.05. The maximum likelihood estimation test veriied the signii-cance of the variables in the inal model.The model inal adjustment was assessed through Hosmer-Lemeshow test.
The logistic regression is part of a category of statistical models called generalized lin-ear models (GLM) that aims to predict a dichotomic result for single cases by means of Bernoulli’s probability model. Thus, the perspective of success or failure is calculated and the analysis results are presented as the probability ratio: the odds ratio (OR). This is obtained through a comparison of individuals that are only diferent in the interest characteristic and that have the values of other constant variables, herein named as: living close or not close to a roadway of heavy traic3,14.
The residential addresses of each individual were georeferenced through GPS visualizer free program (http://www.gpsvisualizer.com/geocoder/) by using Google maps database. The individual exposure to traic was assessed by means of distance calculations between the residency address and the date of death and the closest roadway. Structural and main roadways4-6 were used according to the classiication followed by city halls15, because they are large-sized roadways that aim to receive more vehicles and more vehicular traic.
Individuals were classiied according to two categories: (0) individuals with low traf-ic exposure; and (1) individuals with high tratraf-ic exposure. High exposure was deined as an individual’s residential proximity of up to 150 meters to at least a roadway with a great number of vehicles, whereas low traic exposure is related to a residential proximity above 150 meters to roadways with great vehicle low. The group with low traic exposure was used as the reference category in the analysis.
Age was divided into: (0) 45 to 64 years old and (1) 65 to 85 years old. The date of death was used as an indirect measure of pollutant concentration. Weekdays were then divided, according to the traic intensity, into: (0) light traic (Saturdays and Sundays); and (1) heavy traic (Mondays to Fridays). There are not data available regarding each individual proit; therefore, the census income ratio was used as a proxy of their socioeconomic condition, which was classiied from percentile 90 into: not very unequal (≤ 5.2) and very unequal (> 5.2). The variable was calculated by dividing the proportion of individuals with an income lower than one minimum wage and the income higher than ive minimum wages.
A purely spatial analysis was performed to identify high-risk clusters for CD mortality associated with high vehicular exposure, in which Bernoulli’s probability model was used under a round ray of 1,713.86 meters16 and considering a cluster of up to 50% of the risk population. The parameters used in this exam were: number of deaths per census tract (adjusted by gender, age, and income ratio) and plane coordinates (UTM Projection, South Fuse 21, metric units) of the centroids from the census tracts. Each potential cluster fol-lowed a maximum likelihood estimate to test the null hypothesis for spatial randomization17. The p-value was obtained through Monte Carlo tests (999 iterations) at a 5% signiicance level. Only statistically signiicant clusters were considered.
The logistic regression analyses were conducted using the SPSS 20 program. The spatial scan statistical tests were performed in the SaTScan™ software, version 9.3 ( www. satscan. org). Calculation of the residential distances and map edition were carried out at ArcGis 10. The Ethics Committee of Escola Nacional de Saúde Pública approved this study under CAAE 18634613.0.0000.5240.
RESULTS
The total urban population of individuals aged 45-85 years from Cuiabá and Várzea Grande was around 492,040 residents, distributed into 1,160 census tracts based on 2010 census. About 48.02% of this population, distributed into 488 census tracts, were classiied as liv-ing in areas of high vehicular traic exposure, i.e. up to 150 meters distant to a roadway of great vehicle low.
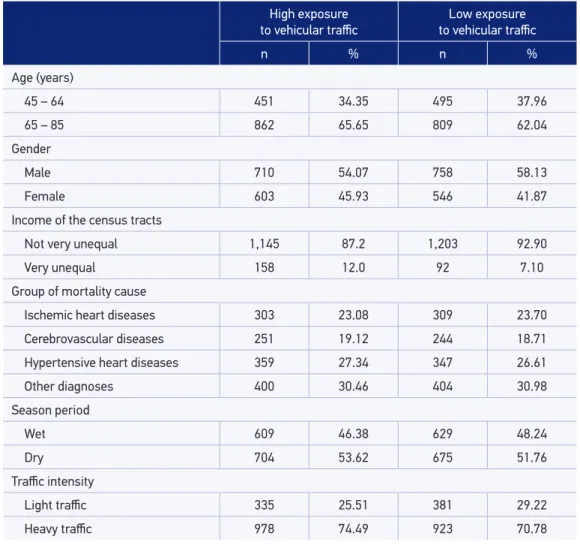
Between 2009 and 2010, 2,617 deaths were registered and 50.17% of them occurred in areas of great vehicular source. Among residents of these areas, the highest rate of deaths due to CD occurred in 65-85-year-old aged subjects (65.65%), in male individuals (54.07%), during the dry season period (53.62%), and in heavy traic days (74.49%) (Table 1).
In the multivariate logistic model for the entire period, living in census tracts with very unequal income (OR = 1.78, 95%CI 1.36 – 2.33); heavy traffic days (OR = 1.20, 95%CI 1.01 – 1.43); and female gender (OR = 1.18, 95%CI 1.01 – 1.38) remained inde-pendently associated with death by CD in areas of high exposure to vehicle traic. In the multivariate model stratiied by seasons, the risk of CD mortality in these areas increases around 15% during the dry season period for all variables (Table 2).
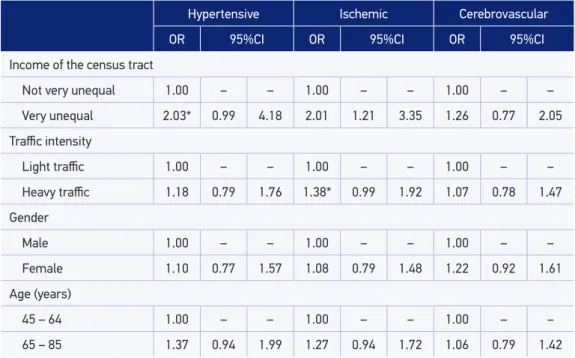
In the multivariate model stratiied by group of causes, only ‘living in census tracts with a very unequal income’ (OR = 2.03; 95%CI 0.99 – 4.18) remained a factor associated with deaths by hypertensive heart diseases in areas of high exposure to traic. Only the variable ‘heavy traic days’ (OR = 1.38; 95%CI 0.99 – 1.92) remained associated with deaths by isch-emic heart diseases in these areas (Table 3).
High exposure
to vehicular traic to vehicular traicLow exposure
n % n %
Age (years)
45 – 64 451 34.35 495 37.96
65 – 85 862 65.65 809 62.04
Gender
Male 710 54.07 758 58.13
Female 603 45.93 546 41.87
Income of the census tracts
Not very unequal 1,145 87.2 1,203 92.90
Very unequal 158 12.0 92 7.10
Group of mortality cause
Ischemic heart diseases 303 23.08 309 23.70
Cerebrovascular diseases 251 19.12 244 18.71
Hypertensive heart diseases 359 27.34 347 26.61
Other diagnoses 400 30.46 404 30.98
Season period
Wet 609 46.38 629 48.24
Dry 704 53.62 675 51.76
Traic intensity
Light traic 335 25.51 381 29.22
Heavy traic 978 74.49 923 70.78
Table 1. Characteristics of the study population according to exposure classiication.
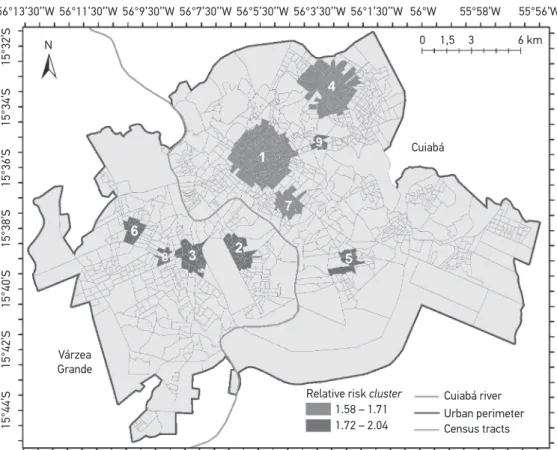
central part, included 111 census tracts and presented RR = 1.65 (Figure 1). The clusters remained the same before and after adjustment, but clusters 8 and 9 only presented statis-tical signiicance after adjustments by age, gender, and income inequality.
DISCUSSION
Entire period Wet Dry
OR 95%CI OR 95%CI OR 95%CI
Income of the census tract
Not very unequal 1.00 – – 1.00 – – 1.00 – –
Very unequal 1.78* 1.36 2.33 1.76* 1.22 2.53 1.86* 1.24 2.80
Traic intensity
Light traic 1.00 – – 1.00 – – 1.00 – –
Heavy traic 1.20* 1.01 1.43 1.07 0.83 1.38 1.34* 1.05 1.70
Gender
Male 1.00 – – 1.00 – – 1.00 – –
Female 1.17* 1.01 1.37 1.03 0.82 1.30 1.30* 1.05 1.62
Age (years)
45 – 64 1.00 – – 1.00 – – 1.00 – –
65 – 85 1.14 0.97 1.33 1.06 0.84 1.34 1.20 0.96 1.50
OR: Odds Ratio; 95%CI: 95% conidence interval; *p ≤ 0.05.
Table 2. Multivariate logistic model of the determining factors of cardiovascular diseases mortality in high exposure areas to vehicular traic pollution for the entire period and stratiied by seasons.
Hypertensive Ischemic Cerebrovascular
OR 95%CI OR 95%CI OR 95%CI
Income of the census tract
Not very unequal 1.00 – – 1.00 – – 1.00 – –
Very unequal 2.03* 0.99 4.18 2.01 1.21 3.35 1.26 0.77 2.05
Traic intensity
Light traic 1.00 – – 1.00 – – 1.00 – –
Heavy traic 1.18 0.79 1.76 1.38* 0.99 1.92 1.07 0.78 1.47
Gender
Male 1.00 – – 1.00 – – 1.00 – –
Female 1.10 0.77 1.57 1.08 0.79 1.48 1.22 0.92 1.61
Age (years)
45 – 64 1.00 – – 1.00 – – 1.00 – –
65 – 85 1.37 0.94 1.99 1.27 0.94 1.72 1.06 0.79 1.42
Table 3. Multivariate logistic model stratiied by group of causes.
be related to continuous exposure, which would make the efects gradual on health and cumulative throughout life7,19.
Several authors have found that chronic exposure to air pollution from vehicular traf-ic increases the progression and instability of atherosclerosis through inlammatory pro-cesses, thus promoting other ischemic events4,5,18 that not only create the disease, but also enhance an existing pathological condition4,6. Data analyzed in this study did not allow to deine the correct time that the individual lives in the provided address and the place of death occurrence. However, our studies show more vulnerability of individuals that lived closer to roadways of great vehicle low. Therefore, such relations might be associated with high exposure to several air pollutants, considering that vehicular traic is one of the most important sources of air pollution in urban areas18,20 and has been reported as an important risk factor in CD in many studies1.
Living in areas of poor socioeconomic conditions has been associated with 78% of the mortality risk by CD associated with high exposure to traic, which might double for hyper-tensive and ischemic heart disease bearers. Several authors have found that people with
Figure 1. High-risk mortality clusters due to cardiovascular diseases related to high vehicular traic exposure adjusted by age, gender, and income ratio.
55°56’W 56°13’30’’W
N
15°44’S
15°42’S
15°40’S
15°38’S
15°36’S
15°34’S
15°32’S
56°11’30’’W
Várzea Grande
Relative risk cluster Cuiabá river
Urban perimeter 1.58 – 1.71
1.72 – 2.04 Census tracts 56°9’30’’W 56°7’30’’W 56°5’30’’W 56°3’30’’W 56°1’30’’W
Cuiabá
1,5 3 6 km 0
lower socioeconomic status tend to live closer to roadways of great vehicle low7,8, mainly because these areas are not very valued by the real state market21. On the other hand, this relation might be associated with the fact that people of poor socioeconomic conditions might be exposed to a higher number of risk factors. Income inequality is connected to sev-eral social inequalities, such as low educational levels, poor households, preexisting mor-bidities, diiculty regarding health services access, as well as higher exposure to the most diferent environmental and occupational risks22,23. Some authors also believe that people with lower purchasing power tend to have more diiculties in modifying their risk behav-iors, such as stopping smoking, enhancing their diet, and working out more, which could raise the expectation for cardiovascular diseases21,24.
The female gender presented 17 to 30% of higher mortality risk due to CD related to high traic exposure. Although the relation between gender and pollution is still contra-dictory in literature, many studies have observed that women are more susceptible to the efects of air pollution, especially adolescents and elderly or when the residential exposure assessment is used25. Increase of female gender risk has also been observed for CD mor-bimortality related to PM2.5-10, O3, NOx and SO29,11,26,27. This association might be related to the biological mechanisms through which air pollution might afect men and women, such as size of airways, genetic factors, or hormone diferences11,28. Another possibility is in dif-ferent exposures and patterns of activities to which men and women would be related to, such as kind of physical activity, free air time, time spent on traic, kind of diet, consump-tion of cigarettes and alcohol, stress, among others that are directly connected to psycho-social and socioeconomic factors25,27.
An increase of almost 15% in the mortality risk by CD associated with high traic exposure during the dry season period was observed. In the same region of the study, some authors observed an increase of morbidity and mortality during the same period. They approached that such advance is associated with increase of air pollutants related to the prevalence of biomass burns in the region16,29-31. Urban waste burning, which is a common practice in Cuiabá and Várzea Grande, can also contribute to the concentration increase of air pollutants, as well as to their toxicity, because they present more proximity of the individual and have a great mixture of toxic components (plastic, fuel, electronic device)32. The local weather variability should also be considered because weather param-eters, such as temperature, humidity, and seasons, can change the efects of air pollution related to CD mortality33-35.
air pollutants36,37. In Cuiába, larger concentrations of PM
10 were registered from Mondays to Fridays, not only in wet season periods but also in dry season periods, and the average weekly concentrations of PM10 reached 88 μg/m3 during the dry season period and did not overcome 33 μg /m3 during the wet season period38.
High-risk clusters for CD mortality associated with high traic exposure were identi-ied in areas where the largest concentrations of roadways of great vehicle low are located. The adjustment by income, age and gender inequality did not eliminate agglomerates, so the harmful efects of air pollution from traic might occur independently of these factors. These areas show how priority actions regarding air pollution should be directed and point how the use of geoprocessing and spatial analysis techniques are useful tools to report on public policies and determine the areas that deserve speciic intervention.
Padilla et al.23,39 and Jerrett et al.40,41 have used spatial analysis techniques to ind pri-ority areas of intervention and to test the eiciency of policy measures taken regarding the efects of urban air pollution. They discuss that air pollution might create or enhance socioeconomic inequalities regarding many diseases, including cancer, asthma, and CD39,42. Therefore, intervention and mitigation measures in high-risk areas should be considered a priority for the efects of air pollution.
The main limitation of this study concerns the measure of exposure to air pollutants from traic, which are the result of residential address georeferencing. Considering that the address is a self-referred variable and there is a lack of standardization of city public areas, these may result in exposure classiication mistakes. In addition, this study did not consider proximity to another roadway, amount and kinds of vehicle circulating through these roads, period of individual activity spent at home and/or traic, traic noises, weather conditions, time living in the provided address, topography and/or standards for land use, among other factors that might work as a cause, confusion or interact by changing the associations between air pollution and mortality. Anyhow, the results should be considered conservative, consid-ering that inherent limitations point out underestimation of risks. It is noteworthy this is a cross-sectional epidemiological study of ecological base, in which it is not possible to stab-lish links of causality at individual level.
CONCLUSION
1. Franchini M, Mannucci PM. Air pollution and cardiovascular disease. Thrombosis Research. 2012; 129(3): 230-4.
2. Brugge D, Durant JL, Rioux C. Near-highway pollutants in motor vehicle exhaust: A review of epidemiologic evidence of cardiac and pulmonary health risks. Environ Health. 2007; 6(1): 23.
3. Health Efects Institute. Traic-related air pollution: a critical review of the literature on emissions, exposure, and health efects. Boston, MA: HEI; 2010. (Panel on the Health Efects of Traic-Related Air Pollution; Special Report 17).
4. Chen H, Goldberg MS, Burnett RT, Jerrett M, Wheeler AJ, Villeneuve PJ. Long-Term Exposure to Traic-Related Air Pollution and Cardiovascular Mortality. Epidemiology. 2013; 24(1): 35-43.
5. Gan WQ, Tamburic L, Davies HW, Demers PA, Koehoorn M, Brauer M. Changes in residential proximity to road traffic and the risk of death from coronary heart disease. Epidemiology. 2010; 21(5): 642-9.
6. Houston D, Li W, Wu J. Disparities in Exposure to Automobile and Truck Traic and Vehicle Emissions Near the Los Angeles-Long Beach Port Complex. Am J Public Health. 2014; 104(1): 156-64.
7. Brender JD, Maantay JA, Chakraborty J. Residential proximity to environmental hazards and adverse health outcomes. Am J Public Health. 2011; 101(Suppl. 1): S37-52.
8. Chakraborty J. Automobiles, Air Toxics, and Adverse Health Risks: Environmental Inequities in Tampa Bay, Florida. Ann Assoc Am Geographers. 2009; 99(4): 674-97.
9. Zeka A, Zanobetti A, Schwartz J. Individual-level modiiers of the efects of particulate matter on daily mortality. Am J Epidemiol. 2006; 163(9): 849-59. 10. Zanobetti A, Schwartz J. Race, gender, and social
status as modiiers of the efects of PM10 on mortality. J Occup Environ Med. 2000; 42(5): 469-74. 11. Bell ML, Son J-Y, Peng RD, Wang Y, Dominici F.
Ambient PM2.5 and Risk of Hospital Admissions: Do Risks Difer for Men and Women? Epidemiology. 2015; 26(4): 575-9.
12. Instituto Brasileiro de Geografia e Estatística. IBGE Cidades: indicadores e dados populacionais [Internet]. 2010 [cited on 2013 May 6]. Available from: http://www.ibge.gov.br/cidadesat/xtras/peril. php?codmun=510340&search=mato-grosso|cuiaba 13. Brasil. Ministério do Meio Ambiente. Programa de
Controle de Poluição do Ar por Veículos Automotores
(PROCONVE) [Internet]. Brasília: Ministério do Meio Ambiente; 2013 [cited 2013 May 06]. Available from: http://www.mma.gov.br/estruturas/163/_arquivos/ proconve_163.pdf.
14. Hofmann B, Moebus S, Stang A, Beck E-M, Dragano N, Mohlenkamp S, et al. Residence close to high traic and prevalence of coronary heart disease. Eur Heart J. 2006; 27(22): 2696-702.
15. Santos AB, Pedrollo JM, Eds. Peril Socioeconomico de Cuiabá [Internet]. Cuiabá: Central de Texto; 2010 [cited 2013 May 06]. v. 4. 400p. Available from: http://www.cuiaba.mt.gov.br/upload/arquivo/ peril_socioeconomico_de_cuiaba_Vol_IV.pdf. 16. Rodrigues PCO, Santos ES, Ignotti E, Hacon SS.
Space-Time Analysis to Identify Areas at Risk of Mortality from Cardiovascular Disease. BioMed Research Int [Internet]. 2015 [cited on 2015 Oct. 6];2015. Available from: http://www.hindawi.com/ journals/bmri/2015/841645/abs/,
17. Jones SG, Kulldorf M. Inluence of Spatial Resolution on Space-Time Disease Cluster Detection. PLoS ONE. 2012; 7(10): e48036.
18. Members WG, Lloyd-Jones D, Adams RJ, Brown TM, Carnethon M, Dai S, et al. Executive Summary: Heart Disease and Stroke Statistics – 2010 Update A Report From the American Heart Association. Circulation. 2010; 121(7): 948-54.
19. Chum A, O’Campo P. Cross-sectional associations between residential environmental exposures and cardiovascular diseases. BMC Public Health [Internet]. 2015 [cited on 2016 Jan. 26];15:438. Available from: http:// www.ncbi.nlm.nih.gov/pmc/articles/PMC4438471/. 20. Zhu Y, Hinds WC, Kim S, Sioutas C. Concentration
and size distribution of ultraine particles near a major highway. J Air Waste Manag Assoc. 2002; 52(9): 1032-42. 21. Deguen S, Zmirou-Navier D. Social inequalities resulting from health risks related to ambient air quality – A European review. Eur J Public Health. 2010; 20(1): 27-35.
22. Cho C-M. The relationship between cardiovascular disease risk factors and gender. Health. 2012; 4(6): 309-15.
23. Padilla CM, Kihal-Talantikite W, Vieira VM, Rosselo P, LeNir G, Zmirou-Navier D, et al. Air quality and social deprivation in four French metropolitan areas – A localized spatiotemporal environmental inequality analysis. Environ Res. 2014; 134:315-24.
24. Fiscella K, Tancredi D. Socioeconomic status and coronary heart disease risk prediction. JAMA. 2008; 300(22): 2666-8.
25. Clougherty JE. A Growing Role for Gender Analysis in Air Pollution Epidemiology. Environ Health Perspect. 2010; 118(2): 167-76.
26. Franklin M, Zeka A, Schwartz J. Association between PM2.5 and all-cause and speciic-cause mortality in 27 US communities. J Expo Sci Environ Epidemiol. 2007; 17(3): 279-87.
27. Kan H, London SJ, Chen G, Zhang Y, Song G, Zhao N, et al. Season, sex, age, and education as modiiers of the efects of outdoor air pollution on daily mortality in Shanghai, China: The Public Health and Air Pollution in Asia (PAPA) Study. Environ Health Perspect. 2008; 116(9): 1183-8.
28. Rossouw JE. Hormones, genetic factors, and gender diferences in cardiovascular disease. Cardiovasc Res. 2002; 53(3): 550-7.
29. Nunes KVR, Ignotti E, Hacon S de S. Circulatory disease mortality rates in the elderly and exposure to PM2. 5 generated by biomass burning in the Brazilian Amazon in 2005. Cad Saúde Pública. 2013; 29(3): 589-98. 30. Ignotti E, Valente JG, Longo KM, Freitas SR, Hacon
S de S, Artaxo Netto P. Impact on human health of particulate matter emitted from burnings in the Brazilian Amazon region. Rev Saúde Pública. 2010; 44(1): 121-30.
31. Silva AMC da, Mattos IE, Freitas SR, Longo KM, Hacon SS. Particulate matter (PM2.5) of biomass burning emissions and respiratory diseases in the south of the Brazilian Amazon. Rev Bras Epidemiol. 2010; 13(2): 337-51.
32. Silva FCP. Queimadas urbanas em Cuiabá-MT: origens e suas consequências socioambientais [Internet]. Cuiabá: Instituto Federal de Educação, Ciência e Tecnologia de Mato Grosso; 2011 [cited on 2016 Jan. 30]. Available from: http://docslide.com.br/documents/queimadas- urbanas-em-cuiaba-mt-origens-e-suas-consequeencias-socioambientais.html
33. Kioumourtzoglou M-A, Schwartz J, James P, Dominici F, Zanobetti A. PM2.5and mortality in 207 US cities: Modiication by temperature and city characteristics. Epidemiology. 2016; 27(2): 221-7.
34. Ravljen M, Bilban M, Kajfež-Bogataj L, Hovelja T, Vavpotič D. Influence of Daily Individual
Meteorological Parameters on the Incidence of Acute Coronary Syndrome. Int J Environ Res Public Health. 2014; 11(11): 11616-26.
35. Qiu H, Yu IT, Wang X, Tian L, Tse LA, Wong TW. Cool and dry weather enhances the effects of air pollution on emergency IHD hospital admissions. Int J Cardiology. 2013; 168(1): 500-5.
36. Batterman S, Cook R, Justin T. Temporal variation of traic on highways and the development of accurate temp-63.
37. Wang J, Mao Y, Li J, Xiong Z, Wang W-X. Predictability of Road Traffic and Congestion in Urban Areas. PLoS One [Internet]. 2015 [cited on 2016 Jan. 29];10(4):e0121825. Available from: http://www. ncbi.nlm.nih.gov/pmc/articles/PMC4388623/ 38. Marques R. A poluição atmosférica em Cuiabá-MT:
a água da chuva, deposição seca e material particulado inalável [dissertação de mestrado]. Cuiabá: Universidade Federal de Mato Grosso; 2006.
39. Padilla CM, Deguen S, Lalloue B, Blanchard O, Beaugard C, Troude F, et al. Cluster analysis of social and environment inequalities of infant mortality. A spatial study in small areas revealed by local disease mapping in France. Sci Total Environ. 2013; 454-5: 433-41. 40. Jerrett M, Burnett RT, Ma R, Pope CA, Krewski D,
Newbold KB, et al. Spatial Analysis of Air Pollution and Mortality in Los Angeles. Epidemiology. 2005; 16(6): 727-36.
41. Jerrett M, Burnett R, Brook J, Kanaroglou P, Giovis C, Finkelstein N, et al. Do socioeconomic characteristics modify the short term association between air pollution and mortality? Evidence from a zonal time series in Hamilton, Canada. J Epidemiol Community Health. 2004; 58(1): 31-40.
42. Forastiere F, Stafoggia M, Tasco C, Picciotto S, Agabiti N, Cesaroni G, et al. Socioeconomic status, particulate air pollution, and daily mortality: diferential exposure or differential susceptibility. Am J Ind Med. 2007; 50(3): 208-16.
Received on: 08/23/2016