Fuzzy model to estimate the number of
hospitalizations for asthma and pneumonia
under the effects of air pollution
Luciano Eustáquio ChavesI,II, Luiz Fernando Costa NascimentoIII,IV, Paloma Maria Silva Rocha RizolV
I Departamento de Mecânica. Faculdade de Engenharia de Guaratinguetá. Universidade Estadual Paulista.
São Paulo, SP, Brasil
II Fundação Universitária Vida Cristã. Faculdade de Pindamonhangaba. Pindamonhangaba, SP, Brasil III Departamento de Medicina. Universidade de Taubaté. Taubaté, SP, Brasil
IV Departamento de Energia. Faculdade Engenharia de Guaratinguetá. Universidade Estadual Paulista.
Guaratinguetá, SP, Brasil
V Departamento de Engenharia Elétrica. Faculdade de Engenharia de Guaratinguetá. Universidade Estadual
Paulista. Guaratinguetá, SP, Brasil
ABSTRACT
OBJECTIVE: Predict the number of hospitalizations for asthma and pneumonia associated with exposure to air pollutants in the city of São José dos Campos, São Paulo State.
METHODS: his is a computational model using fuzzy logic based on Mamdani’s inference method. For the fuzziication of the input variables of particulate matter, ozone, sulfur dioxide and apparent temperature, we considered two relevancy functions for each variable with the linguistic approach: good and bad. For the output variable number of hospitalizations for asthma and pneumonia, we considered ive relevancy functions: very low, low, medium, high and very high. DATASUS was our source for the number of hospitalizations in the year 2007 and the result provided by the model was correlated with the actual data of hospitalization with lag from zero to two days. he accuracy of the model was estimated by the ROC curve for each pollutant and in those lags.
RESULTS: In the year of 2007, 1,710 hospitalizations by pneumonia and asthma were recorded in São José dos Campos, State of São Paulo, with a daily average of 4.9 hospitalizations (SD = 2.9). he model output data showed positive and signiicant correlation (r = 0.38) with the actual data; the accuracies evaluated for the model were higher for sulfur dioxide in lag 0 and 2 and for particulate matter in lag 1.
CONCLUSIONS: Fuzzy modeling proved accurate for the pollutant exposure efects and hospitalization for pneumonia and asthma approach.
DESCRIPTORS: Air Pollution, adverse efects. Asthma, epidemiology. Pneumonia, epidemiology. Hospitalization. Fuzzy Logic.
Correspondence:
Luiz Fernando Costa Nascimento Av Tiradentes, 500 Bom Conselho 12030-180 Taubaté, SP, Brasil E-mail: [email protected]
Received: 25 Jun 2015
Approved: 19 Apr 2016
How to cite: Chaves LE, Nascimento LFC, Rizol PMSR. Fuzzy model to estimate the number of hospitalizations for asthma and pneumonia under the effects of air pollution. Rev Saude Publica. 2017;51:55.
Copyright: This is an open-access article distributed under the terms of the Creative Commons Attribution License, which permits unrestricted use, distribution, and reproduction in any medium, provided that the original author and source are credited.
INTRODUCTION
Air pollution is a serious environmental issue, given its impact on human health, especially cardiovascular and respiratory systems1,2.
In Brazil, especially in large urban centers, exposure to pollutants like particulate matter (PM10), sulfur dioxide (SO2), ozone (O3), carbon monoxide (CO) and nitrogen oxides (NOx)
is associated with hospitalizations for respiratory diseases such as asthma and pneumonia,
thanks to the pollutants easy reach to the respiratory tract3,16.
Currently, this issue extends beyond major urban centers7,11 and is afecting cities of medium and small size1,6,8. Exposure to air pollutants represents the high inancial cost for the public
network. he cost of 900,000 hospitalizations for pneumonia and asthma in 2011 reached US$350 million in Brazil, US$70 million in São Paulo State, with 150,000 hospitalizations, and US$800,000 in the city of São José dos Campos, with 1,900 hospitalizationsa, representing a public health problem.
he statistical techniques of logistic regression and Poisson’s regression (Generalized Linear Models or Generalized Additive Models) are often used to estimate the chance or risk of
hospitalization or death for respiratory diseases9.
A new form of epidemiological data analysis in public health is fuzzy logic. he fuzzy set theory was introduced by Loti A. Zadeh23, in 1965, and can work with the vague aspect of
information particular to human understanding and very common in the medical ield, in which descriptions of diseases often comprise language terms that are inevitably vague, such as fever (high or low)15. Unlike the classical set theory, in which an element belongs
or does not belong to a set, in the theory of fuzzy sets an element may belong to more than one set with diferent degrees of relevance (varying between zero and one). hese fuzzy sets are represented by the relevancy function, whose determination depends on the specialist’s individual perception and the data at hand17.
he ability to deal with linguistic terms can explain the increase in the number of studies that use fuzzy logic in biomedicine problems. In fact, the fuzzy logic theory has become an important approach in diagnosis systems, prognosis, forecasting models, medical treatment and, more recently, in epidemiology and public health13,15,17,18,20,22,23,b.
his study’s objective was to develop a computational model using fuzzy logic to estimate the inluence of exposure to air pollutants in the number of hospital admissions for asthma
and pneumonia.
METHODS
his is a computational model using fuzzy logic to estimate the number of hospitalizations
for pneumonia and bronchial asthma per the concentrations of the pollutants particulate
matter (PM10), ozone (O3) and sulfur dioxide (SO2) and the apparent temperature (TEMPap), calculated by considering ambient temperature and relative air humidity2.
he environmental pollutants and climatic variables data in this study were obtained from the Environmental Company of the State of São Paulo (CETESB), which has a measuring station in the city of São José dos Campos. he data of the number of hospitalizations for pneumonia and bronchial asthma (ICD-10: J12 to J18 and J45) in individuals of all ages residing in São José dos Campos, in the period from 1/1/2007 to 12/31/2007, were obtained from the Department of Information and Computer Science of the Brazilian Uniied Health System (DATASUS).
his study was carried out in São José dos Campos, a medium-sized city in the State of São Paulo, which has an important industrial park. It is located at 23°10’S and 45°52’O, in the
a Ministério da Saúde (BR),
Departamento de Informática do Sistema Único de Saúde – Datasus. Brasília (DF); c2008 [cited 2012 Aug 12]. Available from: http://www2.datasus.gov. br/DATASUS/index.php
b Ortega NRS. Aplicação da
Alto Vale do Paraíba, 600 m above sea level, has wet weather and tropical altitude, located between São Paulo and Rio de Janeiro – the two largest cities in Brazil; is cut through by the Via Dutra, the most important highway in the country with heavy traic of buses and trucks. Its population is estimated to be around 650,000 inhabitants.
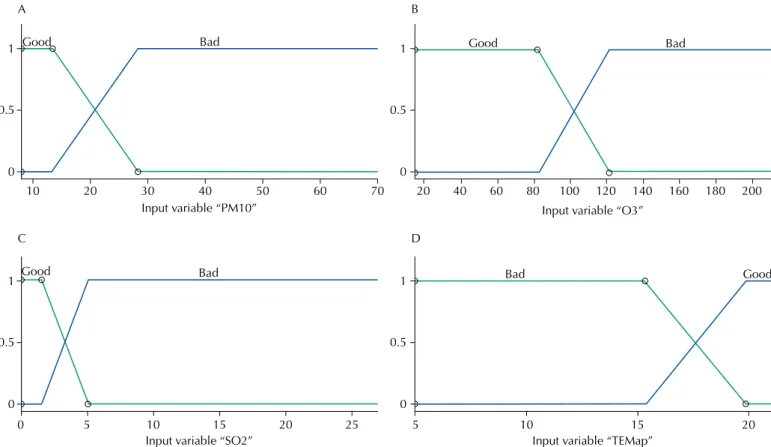
The model was developed with the help of a specialist who created two functions of relevance for the input variables: PM10 – good and bad; O3 – good and bad; SO2 – good and bad; and TEMPap – good and bad. These fuzzy sets were drawn based on the data obtained from CETESBc.
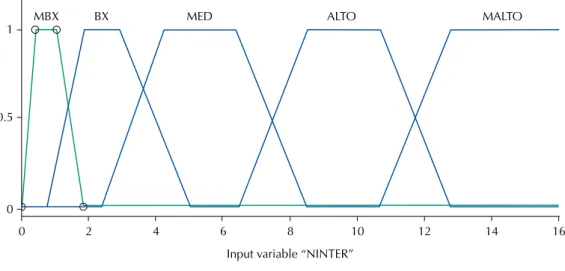
The output variable was the number of hospitalizations for asthma and pneumonia and its five relevance functions we classified as follows: very low, low, medium, high and very high.
he fuzzy linguistic model is a rule-based inference system using fuzzy set theory to address the phenomenon. Its structure includes four components:
• he fuzziier, which transforms real inputs (also known as crisp) into fuzzy values; • he rule base, which deines the connection between the system’s inputs and outputs.
A fuzzy rule has the following form: if precedent, then consequent, in which the precedent can be composed of one or more fuzzy sets connected by fuzzy operators. And the consequent represents the fuzzy values of output variables;
• The inference system, which evaluates all rules, checks which have been activated
(with degree of relevance greater than zero) and combines the resulting weights of all the rules enabled on a single output (in this study, we used the Mamdani’s inference system); and
• he defuzziier that performs the reverse process of the fuzziier, that is, it transforms
the fuzzy output into an actual value (crisp)21.
When performing the combination of all possible entries, it was possible to develop 16 rules resulting from the combination of the four entries with two functions of relevance each (2 × 2 × 2 × 2), drawn up with the aid of an expert. For example, two combinations could be:
IF PM10 IS GOOD AND O3 IS GOOD AND SO2 IS GOOD AND TEMPAP IS GOOD THEN THE NUMBER OF HOSPITALIZATIONS IS VERY LOW
IF PM10 IS BAD AND O3 IS BAD AND SO2 IS BAD AND TEMPAP IS BAD THEN THE NUMBER OF HOSPITALIZATIONS IS VERY HIGH
he number of hospitalizations of the fuzzy linguistic model was determined by the inference method ( fuzzy) proposed by Mamdani23, which consists in calculating the minimum
(degrees of activation) of the rule’s precedents and, subsequently, the aggregation of the rule’s consequents (maximum operator). Finally, the defuzziication is performed, based on
the area center method17.
Through a routine (toolbox fuzzy) that is part of the program MATLAB21, we
obtained the numerical output resulting from the fuzzy model, providing the number of hospitalizations for each combination of the database entry. After obtaining the model’s result, we performed a Pearson correlation with actual admissions data, using up to two days of lag (lag 2) because the display effect can manifest on the same day (lag 0) or on subsequent days. The accuracy, along with its 95% confidence interval was estimated using the ROC curve.
Because the data are available on the network and cannot be identiied, a submission to the Research Ethics Committee was unnecessary.
c CETESB - Companhia Ambiental
RESULTS
In the period study, 1 January, 2007 to 31 December, 2007, 1,710 hospitalizations were recorded according to DATASUSa.
Table 1 shows the mean value, standard deviation, the minimum and maximum value of the PM10, O3, SO2, TEMPap variables and the number of hospitalizations.
Twelve times ozone exceeded the value used by the National Council for the Environment (CONAMA)d. Particulate matter and sulfur dioxide did not exceed those limits.
Relevancy functions of input variables: PM10; O3; SO2 and TEMPap are shown in Figure 1 (A-D). he output variable: number of hospitalizations for asthma and pneumonia with its ive relevancy functions are shown in Figure 2.
he results obtained by the ROC curve are presented in Table 2. he best result was obtained for the zero-day lag (lag 0), PM10 and SO2 showed the best performance per the ROC curve, with statistically signiicant values.
d Ministério do Meio Ambiente
(BR). Resolução Conama nº 003, de 28 de junho de 1990.
Diario Oficial Uniao. 22 ago
1990 [cited 2012 Aug 10]; Seção 1:15937-9. Available from: http:// www.mma.gov.br/port/conama/ res/res90/res0390.html
Table 1. Values of the averages, standard deviation (SD), minimum and maximum of the variables particulate matter (PM10), ozone (O3), sulfur dioxide (SO2), apparent temperature (TEMPap) and the number of hospitalizations (NINTER). São José dos Campos, State of São Paulo, Brazil, 2007.
Input/output variables Average SD Minimum Maximum
PM10 (μg/m3) 26.0 11.3 8.0 89.0
O3 (μg/m3) 91.0 67.9 17.0 162.0
SO2 (μg/m3) 3.8 3.3 0.9 27.0
TEMPap (°C) 17.9 0.9 5.7 20.2
NINTER 4.9 2.9 0 16.0
Figure 1. Input function of relevance: (A) Particulate matter (PM10), (B) Ozone (O3), (C) sulfur dioxide (SO2) and (D) apparent temperature (TEMPap), of the fuzzy model for estimation of the number of hospitalizations in the city of São José dos Campos, State of São Paulo, Brazil, 2007.
1
0.5
0
10 20 30
Input variable “PM10”
40 50 60 70
Good Bad
Input variable “SO2” Input variable “TEMap”
Input variable “O3”
Good Bad Bad Good
Good Bad
1
0.5
0
1
0.5
0
1
0.5
0
0 5 10 15 20 25
20 40 60 80 100 120 140 160 180 200
5 10 15 20
A B
he Pearson correlation coeicient between the output of the fuzzy model and the actual data were 0.38 for lag 0; 0.36 for lag 1 and 0.30 for lag 2 (p < 0.01); even though the values are not high, they were signiicant.
DISCUSSION
This article presents the development of a computational model using fuzzy logic to
estimate the number of hospitalizations for asthma and pneumonia associated with
air pollutants in a midsize industrial town. The results showed good accuracy when predicting the number of hospitalizations when exposure occurred on the same day and up to two days later. Additionally, we saw the acute effect the exposure to pollutants
has in hospitalizations.
his study showed a maximum concentration of PM10 of 89 μg/m3, which is lower than the
air quality advocated by CETESBc, which is 120 μg/m3. According to CETESB, PM
10 indexes
between 51 and 100 μg/m3 classify an air of moderate quality and can cause symptoms such
as a dry cough and fatigue in patients with respiratory diseases. In the study by Arbex et al.2, PM
10 may lead to airway irritation, inlammation, increased
bronchial reactivity and decreased mucociliary activity, and its consequences are an increase in asthma attacks and respiratory infections.
In research conducted by Gouveia et al.12 in the city of São Paulo, State of São Paulo, PM 10
presented an average of 54.5 μg/m3, a value well above this study’s average, which was
26 μg/m3. We found that, with a 10 μg/m3 increase in the concentration of particulate
matter, there was an increase of approximately 5% in the number of hospitalizations for asthma in children. Similarly, Nascimento et al.16 observed that, with an increase
of 24.7 μg/m3 on the average concentration of PM
10, there was an increase of 9.8% in
Table 2. Roc curve values for lag 0, lag 1 and lag 2 of the pollutants PM10, O3, and SO2, per output
type, the number of hospitalizations up to 2. São José dos Campos, State of São Paulo, Brazil, 2007.
Input variable Lag 0 (95%CI) Lag 1 (95%CI) Lag 2 (95%CI)
PM10 0.92 (0.88–0.96) 0.75 (0.64–0.85) 0.71 (0.60–0.81)
O3 0.87 (0.82–0.92) 0.64 (0.52–0.76) 0.62 (0.51–0.73)
SO2 0.95 (0.92–0.97) 0.73 (0.63–0.82) 0.79 (0.72–0.87)
Figure 2. Output functions of relevance (number of hospitalizations) very low (MBX), low (BX), medium (MED), alto (ALTO) and very high (MALTO) for the fuzzy model in the city of São José dos Campos, State of São Paulo, Brazil, 2007.
Input variable “NINTER”
MALTO ALTO
1
0.5
0
0 2 4 6 8 10 12 14 16
MED BX
hospitalizations for pneumonia in children in the city of São José dos Campos, with an
average PM10 concentration of 40 μg/m3.
In the study performed with data from 2004 and 2005 in the same city1, the average was
25.2 μg/m3, a value close to the one found in this study, and hospitalizations for asthma
were associated with exposure to PM10.
As for O3, the average value found in this study was o 91 μg/m3 for the period of 2007, close
to the value found by Amâncio and Nascimento1 in São José dos Campos with an average
of 74.3 μg/m3, by Gouveia et al.12, with an average of 71.8 μg/m3, and greater than the one
observed by Negrisoli and Nascimento19, with an average of 37.1 μg/m3. On 12 days, the O 3
exceeded the values of acceptable levels (up to 160 μg/m3) at CONAMAd. In CETESB’sc report,
the inappropriate values for O3 are between 180μg/m3 and 200 μg/m3 and can aggravate
asthma symptoms in children with respiratory disease. In the general population, it can lead to the following symptoms: a dry cough, fatigue and burning sensation in the nose, throat, and eyes. he concentration of O3 had a signiicant growth in the last year in the city of São José dos Campos, per CETESB’s latest reportc.
he concentration of SO2 had an average of 3.8 μg/m3, which is within the values tolerated
by the World Health Organization (WHO), which accepts a maximum exposure level of up to 20 μg/m3 for 24 hours. his value was like the one found previously (4.6 μg/m3) in the same city1, with data collected between 2004 and 2005, and another study, also in São José
dos Campos, averaging 6.2 μg/m3, with data from 2000 and 200116.
In a research conducted in the city of São Paulo, Gouveia and Fletcher10 found an average
concentration of SO2 of 17.71 μg/m3, which difers from the value found in this study.
his diference can be explained by the larger leet of vehicles in São Paulo, a major source
of this pollutant.
he pollutants cited in this article and their magnitudes are described in national articles about
this subject1-7 and it is important to note that the data of hospital admissions are related to
hospitalization in the public health system. Even at concentrations considered safe, the pollutants can cause adverse health efects, especially on the cardiovascular and respiratory systems. his study difers from other studies that estimate risks or chances of hospitalizations caused by exposure to air pollutants using logistic regression, retrospective studies or Poisson’s regression1,3,5,6. In these models, fuzzy logic has the advantage of dealing with the uncertainty
of information present in the meanings of words, facilitating dialogue between health care
professionals and computational experts.
he fuzzy model showed itself to be very satisfactory by associating exposure to pollutants
with the number of hospitalizations when compared with real outputs, with Pearson
correlation coeicient of 0.38. his methodology was used recently in the same city to analyze the average time of hospitalization arising from pneumonia18. In the national literature,
there are also articles with fuzzy application in establishing the risk of neonatal death15,17 and neonatal resuscitation prediction20.
In epidemiological studies, it is common to ind an association between the concentrations of air pollutants and the health efects on the next day, after two days or even after a week. Researchers generally adjust the model for diferent arrangements of the same database with lags. In time-series studies, lags of one to seven days are often used4,14.
he actual data regarding the number of hospitalizations ranged from zero to 16 and those obtained by the fuzzy model ranged from 0.7 to 13.9. his diference between minimum and maximum is due to the defuzziication method of the fuzzy inference system, in that the result is obtained by calculating the area center. herefore, it would be mathematically diicult to obtain the area center around the ends of the universe of discourse of the output variable. To improve the model, we can include more relevance functions in the input variables, which would involve a larger number of rules; or use diferent formats of relevance functions, such as Gaussian or triangular. he concentrations of pollutants are considered homogeneous for the
implementation of this approach, which can be considered a limitation, since concentrations
in other areas of the same city may difer from those recorded near the monitoring station. his research is a low-cost inancial tool and can be presented in a speciic computer program (expert system) for this purpose, and does not require the opinion of experts. he model can be implemented in public health systems and can serve as an important instrument for prevention and decision-making regarding changes in the level of pollutants. It can also be applied in any locations where there are available data on pollutants and climatic conditions.
REFERENCES
1. Amâncio CT, Nascimento LFC. Asma e poluentes ambientais: um estudo de séries temporais.
Rev Assoc Med Bras. 2012;58(3):302-7. https://doi.org/10.1590/s0104-42302012000300009. 2. Arbex MA, Cançado JED, Pereira LAA, Braga ALF, Saldiva PHN. Queima
de biomassa e efeitos sobre a saúde. J Bras Pneumol. 2004;30(2):158-75. https://doi.org/10.1590/s1806-37132004000200015.
3. Arbex MA, Santos UP, Martins LC, Saldiva PHN, Pereira LAA, Braga ALF. A poluição do ar e o sistema respiratório. J Bras Pneumol. 2012;38(5):643-55. https://doi.org/10.1590/s1806-37132012000500015.
4. Bakonyi SMC, Danni-Oliveira IM, Martins LC, Braga ALF. Poluição atmosférica e doenças respiratórias em crianças na cidade de Curitiba, PR. Rev Saude Publica. 2004;38(5):695-700. https://doi.org/10.1590/s0034-89102004000500012.
5. Barnett AG, Tong S, Clements ACA. What measure of temperature is the best predictor of mortality? Environ Res. 2010:110(6):604-11. https://doi.org/10.1016/j.envres.2010.05.006. 6. Bueno FF, Fonseca AR, Braga FA, Miranda PSC. Qualidade do ar e internações por doenças
respiratórias em crianças no município de Divinópolis, Estado de Minas Gerais. Acta Sci Health Sci. 2010;32(2):185-9. https://doi.org/10.4025/actascihealthsci.v32i2.7344.
7. Cançado JED, Braga A, Pereira LAA, Arbex MA, Saldiva PHN, Santos UP. Repercussões clínicas da exposição à poluição atmosférica. J Bras Pneumol. 2006;32 Suppl2:S5-11. https://doi.org/10.1590/S1806-37132006000800003.
8. Carmo CN, Hacon S, Longo KM, Freitas S, Ignotti E, Ponce de Leon A, Artaxo P. Associação entre material particulado de queimadas e doenças respiratórias na região sul da Amazônia brasileira. Rev Panam Salud Publica. 2010;27(1):10-6. https://doi.org/10.1590/s1020-49892010000100002.
9. Duan Z, Han X, Bai Z, Yuan Y. Fine particulate air pollution an hospitalization for pneumonia: a case-crossover study in Shijiazhuang, China. Air Qual Atmos Health. 2016;9(7):1-11. https://doi.org/10.1007/s11869-015-0383-y.
10. Gouveia N, Fletcher T. Respiratory diseases in children and outdoor air pollution in São Paulo, Brazil: a time series analysis. Occup Environ Med. 2000;57(7):477-83. https://doi.org/10.1136/oem.57.7.477.
11. Gouveia N, Mendonça GAS, Ponce-de-Leon A, Correia JEM, Junger WL, Freitas CU, et al. Poluição do ar e efeitos na saúde nas populações de duas grandes metrópoles brasileiras. Epidemiol Serv Saude. 2003;12(1):29-40. https://doi.org/10.5123/s1679-49742003000100004.
12. Gouveia N, Freitas CU, Martins LC, Marcílio IO. Hospitalizações por causas respiratórias e cardiovasculares associadas à contaminação atmosférica no município de São Paulo, Brasil.
13. Jensen R, Lopes MHBM, Silveira PSP, Ortega NRS. Desenvolvimento e avaliação de um software que verifica a acurácia diagnóstica. Rev Esc Enferm USP. 2012;46(1):184-91.
https://doi.org/10.1590/S0080-62342012000100025.
14. Martins MCH, Fatigati FL, Véspoli TC, Martins LC, Pereira LAA, Martins MA, et al. Influence of socioeconomic conditions on air pollution adverse health in elderly people: an analysis of six regions in São Paulo, Brazil. J Epidemiol Community Health. 2004;58(1):41-6. https://doi.org/10.1136/jech.58.1.41.
15. Nascimento LFC, Ortega NRS. Fuzzy linguistic model for evaluating the risk of neonatal death.
Rev Saude Publica. 2002;36(6):686-92. https://doi.org/10.1590/s0034-89102002000700005. 16. Nascimento LFC, Pereira LAA, Braga ALF, Módolo MCC, Carvalho Jr JA. Efeitos da
poluição atmosférica na saúde infantil em São José dos Campos, SP. Rev Saude Publica.
2006;40(1):77-82. https://doi.org/10.1590/s0034-89102006000100013. 17. Nascimento LFC, Rizol PMSR, Abiuzi LB. Establishing the risk of neonatal
mortality using a fuzzy predictive model. Cad Saude Publica. 2009;25(9):2043-52.
https://doi.org/10.1590/s0102-311x2009000900018.
18. Nascimento LFC, Rizol PMSR, Peneluppi AP. Estimating the average length of hospitalization due to pneumonia: a fuzzy approach. Braz J Med Biol Res. 2014;47(11):977-81.
https://doi.org/10.1590/1414-431x20143640.
19. Negrisoli J, Nascimento LFC. Atmospheric pollutants and hospital admissions due to pneumonia in children. Rev Paul Pediatr. 2013;31(4):501-6.
https://doi.org/10.1590/s0103-05822013000400013.
20. Reis MAM, Ortega NRS, Silveira PSP. Fuzzy expert system in the prediction of neonatal resuscitation. Braz J Med Biol Res. 2004;37(5):755-64.
https://doi.org/10.1590/s0100-879x2004000500018.
21. Sivanandam SN, Sumathi S, Deepa SN. Introduction to fuzzy logic using MATLAB. Berlin: Springer; 2007.
22. Sousa CA, Duarte PS, Pereira JCR. Lógica fuzzy e regressão logística na decisão para prática de cintilografia das paratiróides. Rev Saude Publica. 2006;40(5):898-906. https://doi.org/10.1590/s0034-89102006000600021.
23. Zadeh LA. Fuzzy sets: information and control. New York: Academic Press; 1965. p.338-53.
Funding: Conselho Nacional de Desenvolvimento Cientíico e Tecnológico (CNPq – Productivity Scholarship for Research on Nascimento LFC – Process 308297/2011-3).