O
ri
gi
na
l
a
rt
ic
le
s
Profile of drug spend among elderly individuals from different
socioeconomic groups
Christiane de Fátima Colet1 Paulo Eduardo Mayorga Borges2 Tânia Alves Amador2
1 Universidade Regional do Noroeste do Estado do Rio Grande do Sul, Departamento de Ciências da
Vida, Curso de Farmácia. Ijuí, Rio Grande do Sul, Brasil.
2 Universidade Federal do Rio Grande do Sul, Faculdade de Farmácia, Departamento de Produção e
Controle de Medicamentos. Porto Alegre, Rio Grande do Sul, Brasil. Correspondence
Christiane de Fátima Colet E-mail: [email protected]
Abstract
The increase in the elderly population is associated with increased health care costs. The objective of the present study was to describe the results of research conducted in groups of elderly persons from different socioeconomic classes in Porto Alegre in the state of Rio Grande do Sul, and to compare the drugs spending profiles of different groups. A cross-sectional study was performed using a sample of individuals aged 60 years or older
who participated in community groups. Analysis of variance (ANOVA) and the Tukey
test were used to analyze the difference in costs of drugs among different socioeconomic classes. A total of 225 seniors were interviewed and females were predominant in all classes. The most common chronic diseases included hypertension, which occurred in 21.0%, 36.0% and 38.0% of elderly persons in social classes A, C and E, respectively. The average number of medications was 5.34 (±2.64) in social class A, 4.07 (±2.73) in social class C and 4.28 (±2.39) in social class E. The share of household income spent on medication for elderly persons in classes A, C and E was 4.0%, 5.7% and 10.0%, respectively. The drugs with the highest monthly cost for each patient in class A, C and E, respectively, were antipsychotic and anti-Parkinson's medication, diabetes medicine, and medication for the treatment of bone disease. It was concluded that there are specific differences in the cost and expenses incurred on spending on medication for the elderly of different socioeconomic classes.
Key words: health; diseases;
INTRODUCTION
The growth of the elderly population is associated with an increase in healthcare costs, notably spending on drugs, due to the multiple diseases that occur among this segment of the
population, most notably chronic diseases.1-3
Elderly persons use an average of two to five drugs, a value greater than the average of the younger population.3,4
The use of drugs in the elderly population accounts for a substantial proportion of healthcare costs in developing countries.5,6 An example of this
consumption can be found from prescription data. In Canada, the elderly account for only 12.0% of the total population, but 40.0% of prescriptions are written for this group, while in the United States, the elderly account for only 11.7% of the population, but receive 31.0 % of drug prescriptions.7,8
The amount of prescriptions dispensed for the elderly can be evaluated in terms of the cost this represents for health systems and/or patients. Analyzing data from developed countries, spending per capita on medicines in Canada increased by 10.8% between 1996 and 2002. Taking into account age and the costs of acquiring drugs, population aging is responsible for 1.0 point in the annual rate of increase in health spending.9 Another study
investigated the use of drugs among Belgian elderly persons and found the average expenditure per month on the acquisition of medicines for chronic diseases was €140.10
In developing countries, access to medicines is a major challenge for health professionals. In public health, the available resources are insufficient to meet demand, leading to rationing and more stringent management of resources.11,12
In Brazil today, the population receives drugs in two ways: (1) through the public health system, in which the patient receives free medicine, provided the drug is included in a list of essential drugs established by the government or (2) through commercial pharmacies, where the cost of the
drug is the responsibility of the individual. There is also the Programa Farmácia Brasil Popular (Brazil Popular Pharmacy Program), in which the patient receives some medicines for chronic use, which are included on the essential drug list, free of charge or subsidized by the government. In Brazil, while the total health expenditure increased by 9.6% from 2002 to 2006, drug related spending increased by 123.9%. In 2006, while gross domestic product (GDP) grew by 3.7%, there was a 7.5% increase in spending by the Ministry of Health, and drug-related spending rose by 26.0%, generating a discrepancy between drug expenditures and total expenditures on health.13
Epidemiological, population-based data about the health of elderly persons remains scarce, as it is limited to certain cities and is unrepresentative of the population as a whole. A broader survey of the population base, including issues relating to the health of the elderly, was carried out in 1998. This survey included 29,976 older people, but did not include the northern regions of the country. Among the health issues examined, spending on drugs was studied in depth, and it was found that in the month prior to interview elderly persons spent an average of US$45.50 on regular medications.14 In terms of studies of individual
cities, a survey conducted of 667 elderly persons in Belo Horizonte, Minas Gerais, evaluating the spending of the elderly population on drugs in both the public and private sector, found that the average expenditure incurred in the public sector was US $7.89, while the average spending in the private sector was US $69.48.15
Another Brazilian cross-sectional population based study, conducted in 2009 with 1,720 adults living in the urban area of Florianópolis, in the state of Santa Catarina in southern Brazil, noted that the average spending on drugs was US $23.70, with higher rates among women, older individuals and among the highest socioeconomic class.16 To
of the health profile of the elderly population in Brazil, it is necessary to carry out economic analysis and research in the health sector that can be used to support decisions on the allocation of financial resources.
The aim of the present study was to describe the results of research carried out in groups of different socioeconomic classes of elderly persons in the city of Porto Alegre, in the state of Rio Grande do Sul in Brazil, and to compare profiles and consumer spending on drugs between these classes.
METHOD
The study adopted a cross-sectional model and used a structured questionnaire administered between March and July 2007 as a data collection instrument.
The study population included elderly participants of social groups, which are social spaces that allow senior citizens, aged 60 years, to participate in humanitarian activities, seeking to improve social relations through a range of activities.
The sample was intentional and convenience based, selecting individuals aged over 60 years living in the city of Porto Alegre, Rio Grande do Sul, who participated in selected social groups. The sample was divided into six groups: (a) two groups from socioeconomic class A, (b) two groups from socioeconomic class C, and (c) two groups from socioeconomic class E. The classification of groups by socioeconomic status was determined using the family income of the individual respondent as a parameter.17 The groups were chosen by district,
according to the socioeconomic characteristics of the inhabitants of each region. The data for the selection of the groups was provided by the Municipal Council of the Elderly. After selecting the groups, all active participants were invited to participate and the interviews were conducted at the end of group meetings, when the elderly persons brought their medication bags, or in the homes of the participants. The interviews were
conducted by trained researchers. The elderly were asked about socioeconomic characteristics, general health data and the use of medications.
The study excluded individuals who had trouble answering the questionnaire, as observed by the interviewer. Drug use was considered to be validated in situations where the original box or prescription was provided, and medications used both continuously and sporadically were included. In the present study, the direct costs incurred from spending on drugs were considered in two ways: a) the reference price of the product, according to the place of purchase (public or commercial pharmacy), which calculated the cost based on price per unit, dosage and pharmaceutical form.18 For example,
the cost of medicines in the public sector was calculated considering the purchase price of the public health system of the city of Porto Alegre, in Rio Grande do Sul. The calculation of the cost through the private sector was performed based on: a) the maximum consumer price established by the Brazilian government; b) the social cost of the drugs, irrespective of whether they were acquired via the public or private sector. The calculation considered the average price of three commercial pharmacies.19
In the data collection period, the minimum wage (MW) in southern Brazil was US$210.00, and the dollar was worth R$2.13. The average monthly cost was calculated as the percentage of the family income of the elderly person committed to such spending.
The drugs were categorized by the Anatomical Therapeutic Chemical classification system (ATC) at the first and third levels.20
the average cost of medications, considering the reference price and the social cost, between social classes A and E; A and C; C and E.
The project was approved by the Ethics Committee of the Universidade Federal do Rio Grande do Sul (Federal University of Rio Grande do Sul), under No. 2006647/2007. All participants signed a free and informed consent form prior to data collection.
RESULTS
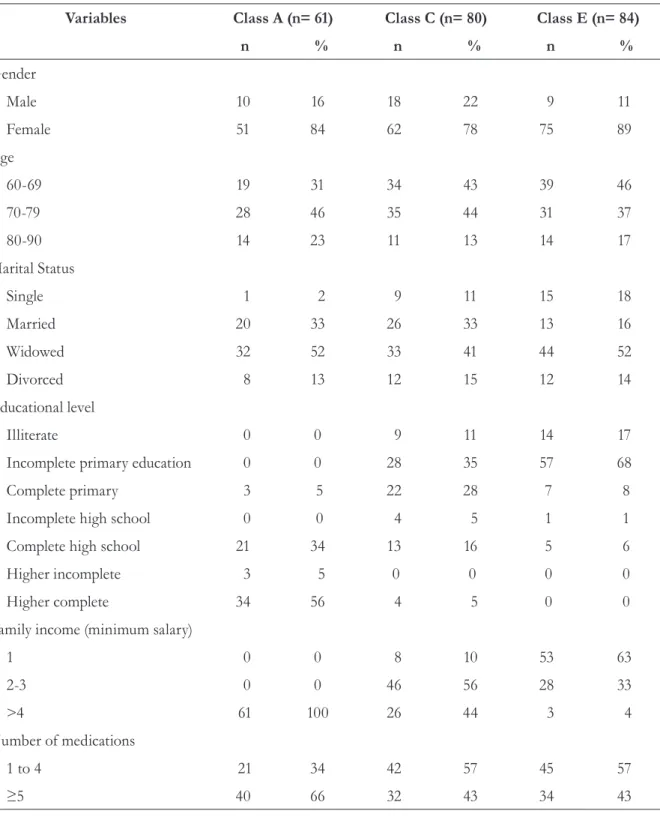
A total of 225 elderly people were interviewed, 61 of whom were from socioeconomic class A, 80 from socioeconomic class C and 84 from socioeconomic class E. Females predominated in all social classes, with 84.0% in class A, 78.0% in class C and 89.0% in class E. The age of the elderly respondents ranged from 60 to 99 years and the mean age was 74.25 (±7.8) years in class A, 72.07 (±7.4) years in class C, and 71.4 (±7.8) years in class E. In class A, 56.0% of the elderly persons had studied for an average of 15 years, while in classes C and E most had studied less than eight years. This data is presented in Table 1.
In terms of the use of drugs, it was found that 100.0% of the elderly persons in class A used some kind of medication during the period in which the interview was conducted. In class C, this frequency was 91.0%, while in Class E, 94.0% of the elderly persons used medication. The number of drugs used ranged from 0 to 15. In class A, the average number of drugs used was 5.34 (±2,64), while in class C it was 4.07 (±2.73) and in class E 4.28 (±2.39).
The most common chronic diseases were hypertension, which occurred in 21.0%, 36.0% and 38.0% of the elderly persons in classes A, C and E, respectively. Diabetes occurred in 3.0%, 9.0% and 24.0% of the elderly in classes A, C, and E, respectively. Furthermore, there was a high frequency of hypercholesterolemia (38.0%, 19.0% and 23.0% in classes A, C and E, respectively) and heart problems (20.0%, 11, 0%, and 18.0% in classes A, C and E, respectively).
Table 1. Socioeconomic characteristics and number of medications used by elderly persons participating in social groups. Porto Alegre, Rio Grande do Sul, 2007.
Variables Class A (n= 61) Class C (n= 80) Class E (n= 84)
n % n % n %
Gender
Male 10 16 18 22 9 11
Female 51 84 62 78 75 89
Age
60-69 19 31 34 43 39 46
70-79 28 46 35 44 31 37
80-90 14 23 11 13 14 17
Marital Status
Single 1 2 9 11 15 18
Married 20 33 26 33 13 16
Widowed 32 52 33 41 44 52
Divorced 8 13 12 15 12 14
Educational level
Illiterate 0 0 9 11 14 17
Incomplete primary education 0 0 28 35 57 68
Complete primary 3 5 22 28 7 8
Incomplete high school 0 0 4 5 1 1
Complete high school 21 34 13 16 5 6
Higher incomplete 3 5 0 0 0 0
Higher complete 34 56 4 5 0 0
Family income (minimum salary)
1 0 0 8 10 53 63
2-3 0 0 46 56 28 33
>4 61 100 26 44 3 4
Number of medications
1 to 4 21 34 42 57 45 57
Based on the reference price, it was found that the share of family income spent on drugs for elderly persons in classes A, C and E was 4.0%, 5.7% and 10.0%, respectively.
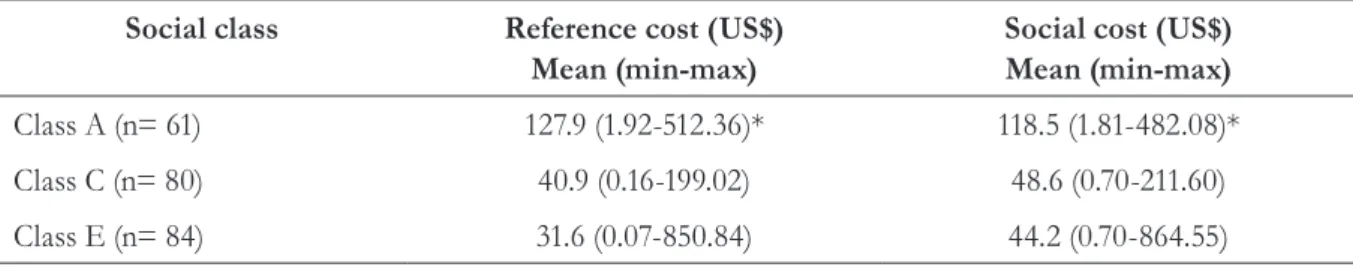
Table 3 shows the average cost of medication for each social class, subdivided into the price of acquisition in the public system and the sales price in private establishments. In Class A, the lowest price per drug was US$0.70, while the highest price was
US$371.18. In class C, prices ranged from US$0.16 to US$107.15. In social class E, prices acquired from the public sector ranged from US$0.17 to US$851.30, compared with the private sector, where the maximum price was US$62.81. These figures are calculated based on the reference price of the drugs. It is important to note that statistical analysis was not performed to see if there was a difference between spending in the public and the private sector, which can be considered a limitation of this study.
It is also noteworthy that the acquisition costs of drugs were only compared statistically between classes, but spending between the public and private sectors was not compared.
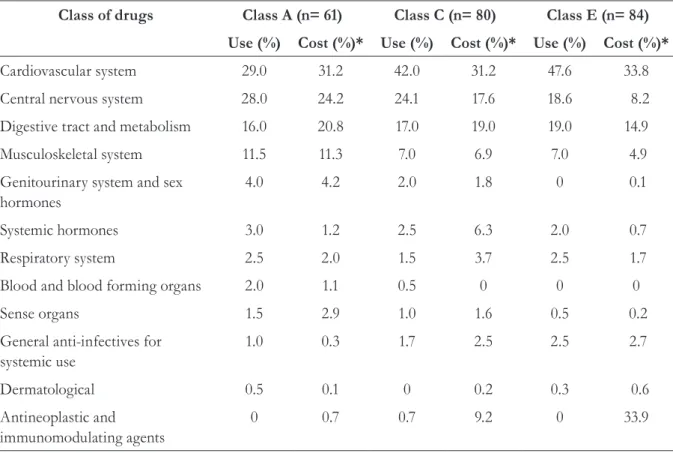
The drugs were grouped into anatomical systems, at the first level of the ATC classification,
and based on the reference price, the percentages of use and the percentages of spending of each level of the ATC were calculated. Drugs to treat diseases of the cardiovascular system were the most frequently used in all social classes, and this data is presented in Table 4.
Table 2. Comparison of reference cost and social cost of medications used by elderly persons from social groups. Porto Alegre, Rio Grande do Sul, 2007.
Social class Reference cost (US$)
Mean (min-max)
Social cost (US$) Mean (min-max)
Class A (n= 61) 127.9 (1.92-512.36)* 118.5 (1.81-482.08)*
Class C (n= 80) 40.9 (0.16-199.02) 48.6 (0.70-211.60)
Class E (n= 84) 31.6 (0.07-850.84) 44.2 (0.70-864.55)
US$= US dollar; *p<0.001; min=minimum; max=maximum; ANOVA/Tukey.
Table 3. Average monthly cost of medication acquired from the Sistema Único de Saúde (Unified Health Service) (SUS) and private establishments, consumed by elderly persons from social groups. Porto Alegre, Rio Grande do Sul, 2007.
Social class Public system Private system
Nº drugs Mean(min-max)
(US$)
Nº drugs Mean (min-max) (US$)
Class A (n= 61) - - 130 50.52 (1.25-657.00)
Class C (n= 80) 36 8.82 (0.18-332.50) 92 32.10 (1.64-235.87)
Class E (n= 84) 48 5.44 (0.02-1.485) 72 20.71 (0.37-111.18)
Table 5 shows the average monthly cost of drugs classified at the second level of the ATC, and the number of elderly people who used these drugs. The drugs that represented the highest
monthly cost for each patient in classes A, C and E respectively, included: anti-Parkinsonian and antipsychotic drugs, drugs for diabetes and drugs for the treatment of bone disease.
Table 4. Distribution of use and cost of drugs of elderly persons from social groups, according to the Anatomical Therapeutic Chemical Classification System (ATC). Porto Alegre, Rio Grande do Sul, 2007.
Class of drugs Class A (n= 61) Class C (n= 80) Class E (n= 84)
Use (%) Cost (%)* Use (%) Cost (%)* Use (%) Cost (%)*
Cardiovascular system 29.0 31.2 42.0 31.2 47.6 33.8
Central nervous system 28.0 24.2 24.1 17.6 18.6 8.2
Digestive tract and metabolism 16.0 20.8 17.0 19.0 19.0 14.9
Musculoskeletal system 11.5 11.3 7.0 6.9 7.0 4.9
Genitourinary system and sex hormones
4.0 4.2 2.0 1.8 0 0.1
Systemic hormones 3.0 1.2 2.5 6.3 2.0 0.7
Respiratory system 2.5 2.0 1.5 3.7 2.5 1.7
Blood and blood forming organs 2.0 1.1 0.5 0 0 0
Sense organs 1.5 2.9 1.0 1.6 0.5 0.2
General anti-infectives for systemic use
1.0 0.3 1.7 2.5 2.5 2.7
Dermatological 0.5 0.1 0 0.2 0.3 0.6
Antineoplastic and immunomodulating agents
0 0.7 0.7 9.2 0 33.9
DISCUSSION
Aging is directly associated with a rise in medical expenses. The elderly participants in the present study were from three different economic profiles, which were selected in order to analyze the differences in drug spending between different socioeconomic classes.
The means of acquiring the drugs varied according to the socioeconomic status of individuals. In Class A, the average cost of drugs consumed by the elderly people, considering both the reference price and the social cost, was higher than the same cost for classes C and E. Applying the ANOVA and Tukey test, a significant difference in the average cost of medicines was Table 5. Average spending by pharmacological groups most used by elderly persons from social groups. Porto Alegre, Rio Grande do Sul, 2007.
Pharmacological groups
Class A (n= 61) Class C (n= 80) Class E (n= 84)
M Mean
(min-max)* M
Mean
(min-max)* M
Mean (min-max)*
Cholesterol and triglyceride reducing agents 19 74.37 (42.36-214.38) 16 28.30 (3.45-56.33) 17 39.18 (3.45-88.90)
Analgesics 28 3.72
(1.25-13.16)
12 3.89
(0.29-12.12)
36 1.84
(0.29-6.96)
Anxiolytics and hypnotics 14 35.05
(10.09-123.18)
14 30.64
(0.9-41.86)
10 5.59
(0.13-8.74)
Antidepressants 12 102.53
(21.24-242.64)
13 18.07
(1.34-45.90)
11 13.17
(0.72-44.75)
Antihypertensives 31 50.25
(2.63-94.86)
44 24.62
(0.37-107.49)
60 12.63
(0.02-98.87)
Antiallergics 6 27.47
(9.59-102.51) 2 37.64 (5.90-45.56) 5 10.97 (2.56-17.72) Nonsteroidal anti-inflammatory drugs 2 19.54 (19.52-19.59) 12 6.53 (0.49-23.19) 21 3.51 (0.29-13.73)
Antidiabetics 2 44.81
(38.44-51.18)
5 64.64
(0.18-189.66)
17 8.76
(0.18-36.06)
Sex hormones during menopause 7 81.64 (17.35-157.58) 3 34.45 (12.54-52.87) 0 0 Antiparkinsonian / Antipsychotics 4 215.99 (51.37-657.00) 4 14.61 (0.42-235.87) 1 6.48
Antiulcer drugs 11 45.31
(5.74-71.13)
7 19.09
(1.65-38.69)
13 10.58
(1.65-35.42)
Drugs affecting bone structure and mineralization
21 45.39 (5.00-78.76) 13 43.21 (5.35-57.28) 6 40.17 (5.00-58.47)
Vitamins 16 54.66
(16.88-132.03)
5 18.33
(10.02-33.35)
2 9.49
(1.20-11.40)
Thyroid drugs 6 27.47
(8.00-46.54)
5 9.46
(8.00-11.74)
3 10.82
(8.00-8.47)
found, in terms of both the reference price and the social cost, between social classes A and E (F=29.59; p<0.001) and between classes A and C (F=19.09; p<0.001). The cost of medications consumed in class A was significantly higher than in other classes; however, there was no significant difference between classes C and E.
The elderly persons in socioeconomic class A mainly purchased their drugs in private institutions, which contributed to the fact that their spending on drug treatment was greater than among those from classes C and E, who have direct access to free medicines distributed by the Brazilian public health system. The cost of drugs purchased from the public health system may be undervalued as it does not consider other expenses such as human resources or the logistical costs of product distribution to different health facilities.
Comparing average monthly expenditure on medicine as a percentage of family income, it was observed that the Class A group spent the most on the purchase of medicines (60.0% of the national minimum wage and 4.0% of individual incomes). These figures represent a smaller impact on this class than the other classes interviewed: 19.0% (5.7% of the minimum wage) for Class C and 15.0% (10.0% of the minimum wage) for class E. However, this data represents only an estimated calculation, as both class C and class E get part of their medicines via the public sector.
This data corroborates the study by Boing et al.16
which reports that while high-income populations use drugs prescribed by doctors, preferring those that have been recently made available in the market and are therefore technologically advanced, these costs represent only a small portion of their total income. While the consumption of drugs by the middle-income population is influenced by changes in prices, the low-income population has an inelastic demand in relation to price, as even when there is a significant drop in drug prices, the limited income of class E users limits their consumption capacity. In Brazil, the use of medications by the low-income population depends on the essential drug list adopted by public authorities.
Cross-sectional studies such as this can assess the prevalence of drug use and relate it to other variables such as social and demographic factors, health conditions, health system characteristics and factors related to drug costs. A study conducted in the metropolitan region of Belo Horizonte, in the state of Minas Gerais, showed that elderly persons from lower socioeconomic levels and health problems were associated with abandoning medication, particularly due to the high cost. Among the women in this study, nonadherence was associated with a low perception of health or with deteriorating health status. On the other hand, a low perception of health was connected with different neighborhoods, with a poor perception of physical environment contributing independently to adhesion.15
The drugs most frequently used by respondents of this study were related to the cardiovascular system, which is connected with the fact that cardiovascular diseases are the most prevalent among the elderly, as discussed by Metge et al (2004).5
Classes of drug related to the central nervous system, digestive tract and metabolism are often used in research regarding the elderly. In class C, the use of drugs for the digestive tract and metabolism was higher than for diseases of the nervous system. This frequency of consumption is reversed in class E, with a higher consumption of drugs to treat diseases of the nervous system than those for the digestive and metabolic systems.
slogans such as "preventive medicine" or "dietary supplement", such as vitamins, was observed among elderly persons in Class A. Therefore, new drugs and combinations represent an increase in the cost of pharmacological treatment21 and may
have contributed to the higher drug costs of elderly persons in class A.
The present study found that the cost of acquisition of medication is not directly related to the gender of an individual (t-test for independent samples; p=0.945). Similarly, no difference was found between greater spending on the use of drugs and the increasing age of the respondents (t-test for independent samples; p=0.139). The association between increased drug costs and age, which was not observed in this study, could be credited to the fact that older people tend to consume a larger amount of drugs due to chronic diseases.22
In terms of the cost of drugs purchased, the amounts spent by individuals from class A were higher than those from other classes. The highest cost per drug class was antipsychotics [US$121.80 (±191.40)] and anti-Parkinsonian medication, while the cost of treatment for elderly persons from class C was US$8.20 (±4.30), emphasizing that, in this study, the elderly with higher purchasing power used newer drugs, which tend to incur higher costs.
In class E, the two therapeutic classes with the highest cost to patients were the drugs for the treatment of bone disease and lipid modifying agents. The most frequently used medications were those containing calcium associated with vitamin D and simvastatin. Although these drugs are included in the list of essential medicines in Brazil, they are not available for free distribution in all cities. In addition, such drugs incur a relatively high cost, considering the income of the elderly, which limits their acquisition in private pharmaceutical establishments.
The main limitations of this study were that it did not monitor changes in the use of drugs, the sample was convenience based and private sector costs were not evaluated by purchase receipt, but by prevailing market values.
CONCLUSIONS
The present study showed that there are specific differences in relation to the cost and the spending on drugs by elderly persons from different socioeconomic classes.
Individuals from class A tend to purchase medications in the private sector, while classes C and E use the Brazilian public health system and private institutions to access required medicines. The most commonly purchased drugs are related to the pharmacological groups recommended for the treatment of diseases prevalent among the elderly, such as hypertension and heart problems. Nevertheless, elderly persons from class A tend to use more recently commercialized or newer drugs than those from classes C and E. This factor increases the costs of such products for Class A. If the elderly in classes C and E were to acquire all their prescription drugs in commercial establishments, there would be a negative impact on their family income of 5.7% and 10.0%, respectively. However, most products can be purchased in the Brazilian public health system.
REFERENCES
1. McAlister DA, Hughes CM, Fleming I, O’neill C. Cost of pharmacological care of elderly patients. Rev Clin Gerontol 2005;14(1):71-8.
2. González CG, García SS, Cedillo TJ, Carrasco OR, Robledo LMG, Peña CG. Health care utilization in the elderly Mexican population: expenditures and determinants. BMC Public Health 2011;11(1):192-8.
3. Glynn LG, Valderas JM, Healy P, Burke E, Newell J, Gillespie P, et al. The prevalence of multimorbidity in primary care and its effect on health care utilization and cost. Fam Pract 2011;28(5):516-23.
4. Xu KT. Financial disparities in prescription drug use between elderly and nonelderly Americans. Health Aff 2003;22(5):210-21.
5. Metge C, Grymonpre R, Dahl M, Yogendran M. Pharmaceutical use among older adults: using administrative data to examine medication related issue. Can J Aging 2005;24(1):81-95.
6. Goldman DP, Joyce GF, Zheng Y. Prescription drug cost sharing: associations with medication and medical utilization and spending and health. JAMA 2007;298(1):61-9.
7. Law MR, Cheng L, Dhalla IA, Heard D, Morgan SG. The effect of cost on adherence to prescription medications in Canada. CMAJ 2012;184(3):297-302.
8. Lu WH, Wen YW, Chen LK, Hsiao FY. Effect of polypharmacy, potentially inappropriate medications and anticholinergic burden on clinical outcomes: a retrospective cohort study. CMAJ 2015;187(4):130-7.
9. Morgan SG. Prescription drug expenditures and population demographics. Health Serv Res 2006l;41(2):411-28.
10. Elseviers MM, Vander Stichele RR, Van Bortel L. Drug utilization in Belgian nursing homes: impact of residents' and institutional characteristics. Pharmacoepidemiol Drug Saf 2010;19(10):1041-8.
11. Velden MEV, Severens J, Novak A. Economic evaluation of healthcare programmes and decision making. Pharmacoeconomics 2005;23(11):1075-82.
12. Drummond MF. Guidelines for authors and peer reviewers of economic submission to the BMJ. BMJ 1996;313:275-83.
13. Brasil. Ministério da Saúde. Evolução dos gastos do Ministério da Saúde com medicamentos [Internet]. Brasília, DF: MS; 2015 [acesso em 10 out 2015]. Disponível em: http://portal.saude.gov.br/portal/ saude/area.cfm?id_area=1001
14. Costa MFL, Barreto SM, Giatti L. Condições de saúde, capacidade funcional, uso de serviços de saúde e gastos com medicamentos da população idosa brasileira: um estudo descritivo baseado na Pesquisa Nacional por Amostra de Domicílios. Cad Saúde Pública 2003;19(3):735-43.
15. Lima MG, Ribeiro AQ, Acúrcio FS, Rozenfeld S, Klein CH. Composição dos gastos privados com medicamentos utilizados por aposentados e pensionistas com idade igual ou superior a 60 anos em Belo Horizonte, Minas Gerais, Brasil. Cad Saúde Pública 2007;23(6):1423-30.
16. Boing AC, Bertoldi AD, Peres KG. Desigualdades socioeconômicas nos gastos e comprometimento da renda com medicamentos no Sul do Brasil. Rev Saúde Pública 2011;45(5):897-905.
17. Associação Brasileira De Empresas De Pesquisa. Critério Brasil e Atualização da Distribuição de Classes [Internet]. 2008. [Acesso em 2013 mar 2]; 8(3). Disponível em URL: http://www.abep.org/ codigosguias/ABEP_CCEB.pdf.
18. Lista de preços. In: Guia da Farmácia. São Paulo: Price; 2007. p.173.
19. Iunes RF. A concepção econômica de custos. In: Piola SF, Vianna SM. Economia da Saúde: conceitos e contribuição para a gestão da saúde. 3 ed. Brasília: IPEA; 2002. p. 227-47.
20. World Health Organization. Collaborating Centre for Drug Statistics Methodology. ATC/DDD Index 2006 [Internet]. Genebra: WHO; 2015 [acesso em 20 nov 2015]. Disponível em: www.whocc.no/atcddd
21. Hernandez Perella JA, Mas GX, Riera CD, Quintanilla CR, Gardini CK, Torrabadella FJ. Inappropriate prescribing of drugs in older people attending primary care health centres: detection using STOPP-START criteria Rev. Esp Geriatr. Gerontol. 2013; 48(6): 265-8.
22. Thomas CP, Ritter G, Wallack SS. Growth in prescription drug spending among insured elders. Health Aff 2001;20(5):265-78.