Objective: To build a fuzzy computational model to estimate the number of hospitalizations of children aged up to 10 years due to respiratory conditions based on pollutants and climatic factors in the city of São José do Rio Preto, Brazil.
Methods: A computational model was constructed using the fuzzy logic. The model has 4 inputs, each with 2 membership functions generating 16 rules, and the output with 5 pertinence functions, based on the Mamdani’s method, to estimate the association between the pollutants and the number of hospitalizations. Data from hospitalizations, from 2011–2013,
were obtained in DATASUS — and the pollutants Particulate
Matter (PM10) and Nitrogen Dioxide (NO2), wind speed and temperature were obtained by the Environmental Company of São Paulo State (Cetesb).
Results: A total of 1,161 children were hospitalized in the period and the mean of pollutants was 36 and 51 µg/m3 — PM
10 and NO2, respectively. The best values of the Pearson correlation (0.34) and accuracy measured by the ReceiverOperatingCharacteristic (ROC) curve (NO2 – 96.7% and PM10 – 90.4%) were for hospitalizations on the same day of exposure.
Conclusions: The model was efective in predicting the number
of hospitalizations of children and could be used as a tool in the hospital management of the studied region.
Keywords: Fuzzy logic; Air pollutants; Respiratory tract diseases; Particulate matter; Nitrogen dioxide.
Objetivo: Construir um modelo computacional fuzzy para estimar o número de internações de crianças até 10 anos por doenças respiratórias, com base nos dados de poluentes e fatores climáticos da cidade de São José do Rio Preto, Brasil.
Métodos: Foi construído modelo computacional utilizando a lógica fuzzy. O modelo tem 4 entradas, cada uma com 2 funções de pertinência gerando 16 regras, e a saída com 5 funções de pertinência, baseado no método de Mamdani, para estimar a associação entre os poluentes e o número de internações. Os dados de internações, de 2011–2013, foram obtidos no Departamento de Informática do Sistema de Saúde (DATASUS) e os poluentes material particulado (PM10) e dióxido de nitrogênio (NO2), a velocidade do vento e a temperatura foram obtidos pela Companhia Ambiental do Estado de São Paulo (Cetesb).
Resultados: Foram internadas 1.161 crianças no período analisado, e a média dos poluentes foi 36 e 51 µg/m3 — PM
10 e NO2, respectivamente. Os melhores valores da correlação de Pearson (0,34) e da acurácia avaliada pela curva Receiver Operating Characteristic – ROC (NO2 – 96,7% e PM10 – 90,4%) foram para internações no mesmo dia da exposição.
Conclusões: O modelo mostrou-se eicaz na predição do número
de internações de crianças, podendo ser utilizado como ferramenta na gestão hospitalar da região estudada.
Palavras-chave: Lógica fuzzy; Poluentes do ar; Doenças respiratórias; Material particulado; Dióxido de nitrogênio.
ABSTRACT
RESUMO
*Corresponding author. E-mail: [email protected] (P.M.S.R. Rizol).
aSchool of Engineering, Universidade Estadual Paulista “Júlio de Mesquita Filho”, Guaratinguetá, SP, Brazil.
Received on December 14, 2016; approved on May 1st, 2017; available online on October 26, 2017.
FUZZY COMPUTATIONAL MODELS TO EVALUATE
THE EFFECTS OF AIR POLLUTION ON CHILDREN
Modelos computacionais
fuzzy
para
avaliar efeitos da poluição do ar em crianças
11
INTRODUCTION
he association between air pollution and respiratory1-8 and
cardiovascular diseases2,9 is a subject of study, and the global
concern about the quality of air has been increasing. In Brazil, the patterns established by the National Environment Council (CONAMA) are followed, in Resolution n. 03/1990,10 even if
these are above the current patterns adopted in other coun-tries, which updated their legislation. In the State of São Paulo, Decree n. 59,113 is currently valid,11and it aims at reaching
the standard of the World Health Organization (WHO) using intermediate goals.12,13
he most studied pollutants that are damaging to health are: particulate matter (PM10), nitrogen oxides (NO and NO2), sulfur dioxide (SO2), ozone (O3) and carbon dioxide (CO2). In general, the major sources of these pollutants are vehicles, industries, thermoelectric and biomass burn. PM10 is composed of solid and liquid particles suspended in the air, lower than or equal to 10 μm, whose ine fraction — PM2,5 — reaches the location where gases are exchanged in the lung. NO2 is an oxi-dation agent able to reach the peripheral portions of the lung, and is the precursor of the O3 formation.1,4
From October 2011 to September 2013, there were about 2,7 million hospitalizations caused by respiratory conditions in Brazil; of these, approximately 1.1 million was of children aged up to 10 years – the State of São Paulo alone was respon-sible for about 200 thousand of them. he expenses with this type of hospitalization in the country, during the same period of this study, was of about 2.5 billion Reais, and approximately one third of this amount was destined to hospitalizations of children aged up to 10 years – of this total, 173 million Reais were spent only in the State of São Paulo.14
Statistical techniques, like the Poisson regression, are largely used in studies involving air pollution and health outcomes. In general, these studies demonstrate the associ-ation between pollutants and cardiorespiratory conditions, estimating the risk of death or hospitalization.2,3 he fuzzy
approach has been used as an alternative for several areas, such as Medicine. Its great advantage is the facility to handle linguistic terms and inaccurate and uncertain information, besides the low computational cost. Unlike the classic the-ory, in which each element belongs to a set or not, in the fuzzy logic there is a degree of pertinence, so there may be an element that belongs to a speciic group to a higher or lower level.15
Like, for instance, the input variable PM10 with 24 µg/m3.
he fuzzy logic allows to attribute to the “acceptable” fuzzy subset a 0.55 level of pertinence, and to the “unacceptable” subset, a 0.45 level of pertinence, resulting in the uncertain-ties inherent to this record. Indeed, the measurement of the
input value of the particulate matter of 23 µg/m3 and another
of 25 µg/m3, which, by the classic logic, would be classiied as
acceptable and unacceptable, respectively, did not present sig-niicant diferences. In the fuzzy approach, each element could be compatible with several categories, with diferent levels of pertinence, making the classiication even more realistic.
he objective of this study was to estimate, using a fuzzy model, the number of hospitalizations of children aged up to 10 years for respiratory diseases, based on the data regarding pollutants and environmental factors in the city of São José do Rio Preto, Brazil, strongly afected by the pollution from the burning of sugarcane straw and the roads in the region12,16 —
this city presents with levels of pollution comparable to (and, sometimes, higher than) those found in the Metropolitan Region of São Paulo, as opposed to the paradigm that countryside cit-ies necessarily have better quality of the air.4
METHOD
São José do Rio Preto is in the countryside of the State of São Paulo, to the northwest of the capital (latitude: 20° 48’ S and longitude: 49° 22’ W), with approximately 400 thousand inhab-itants and a leet of about 340 thousand vehicles.17
he burn-ing of sugarcane straw is the main cause of air pollution in this region – there are about 130 thousand hectares/year -, and the black smoke resulting from the burning of fuel by diesel motors is the second biggest cause. he administrative region of São José do Rio Preto has an agro-industrial proile based mainly on the production of sugar and alcohol, from the sugarcane, and on the manufacture of furniture.16
A computational fuzzy model was developed to assess the number of hospitalizations caused by respiratory disease in chil-dren aged up to 10 years, according to the concentrations of PM10 and nitrogen dioxide (NO2), and the values of air tem-perature and wind speed, obtained from the Environmental Company of São Paulo State (Cetesb), in São José do Rio Preto. he database of the number of hospitalizations caused by respi-ratory diseases in children was obtained from the website of the Department of Informatics in the Uniied Health System (DATASUS)14 for the diseases in chapter X of the International
statistical classiication of diseases and related health problems – 10th revision (J00 – J99), for the city of São José do Rio Preto, from October 1st, 2011, to September 30, 2013.
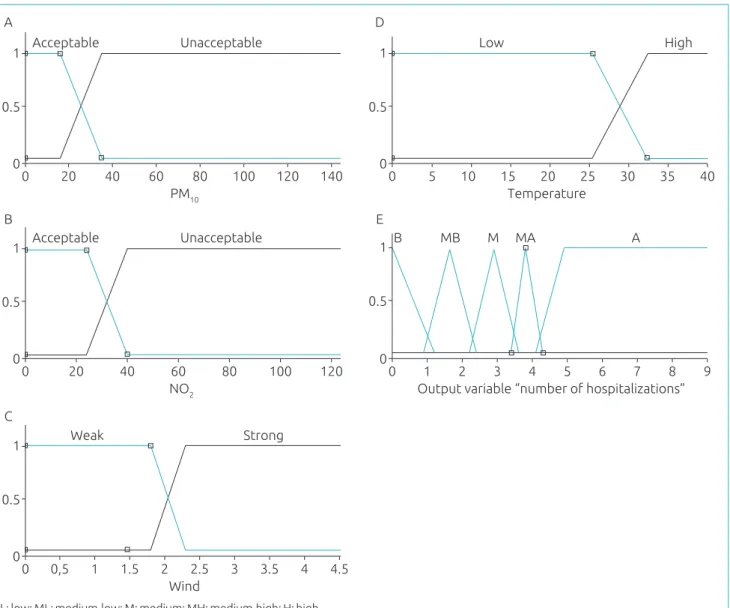
12 he four input variables were “fuzziied” with two trapezoidal pertinence functions each, and the output has ive pertinence functions (four triangular and one trapezoidal), according to the expert. herefore, 16 rules were deined (2x2x2x2), con-sidering the efects of the pollutants and the climactic variables in respiratory diseases in children. he rules relating the inputs and outputs are shown in Table 2.
he input variables are “fuzziied” by pertinence levels. hen, the Mamdani’s inference process is conducted, also known as maximum and minimum. Finally, the centroid “defuzzii-cation” method is applied to obtain the output (number of hospitalizations).15
For the validation of the model, the Pearson correlation was performed between the real data and the fuzzy model,
1
0.5
0
0 20 40 60 80 100 120 140
Acceptable Unacceptable
PM10
1
0.5
0
0 20 40 60 80 100 120
Acceptable Unacceptable
NO2
1
0.5
0
0 0,5 1 1.5 2 2.5 3 3.5 4 4.5
Weak Strong
Wind
1
0.5
0
0 5 10 15 20 25 30 35 40
Low High
Temperature
1
0.5
0
0 1 2 3 4 5 6 7 8 9
B MB M MA A
Output variable “number of hospitalizations”
Figure 1 Input variables in the system of fuzzy inference with the level of pertinence in axis y – (A) particulate matter(μg/m³), (B) nitrogen dioxide (μg/m³), (C) wind speed (m/s²) and (D) air temperature and output (E) number of hospitalizations for respiratory diseases in children, São José do Rio Preto, Brazil 2011–2013.
L: low; ML: medium-low; M: medium; MH: medium-high; H: high.
A D
B E
C
with 0 to 3-day lag – that is, from the day of exposure to the third day – after the inhalation of pollutants. he ROC curves of the pollutants were also assessed, with a cutof point of up to 2 hospitalizations, in which values referring to the accuracy of the model with 5% signiicance level were obtained.
RESULTS
13
Mean Standard
deviation Minimum Maximum
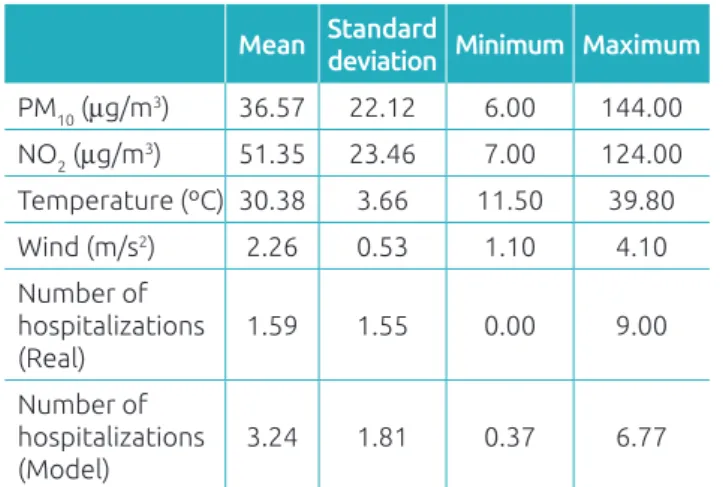
PM10 (μg/m3) 36.57 22.12 6.00 144.00
NO2 (μg/m3) 51.35 23.46 7.00 124.00
Temperature (ºC) 30.38 3.66 11.50 39.80
Wind (m/s2) 2.26 0.53 1.10 4.10
Number of hospitalizations (Real)
1.59 1.55 0.00 9.00
Number of hospitalizations (Model)
3.24 1.81 0.37 6.77
Table 1 Values of means, standard deviation, minimum and maximum of particulate matter, nitrogen dioxide, temperature and wind speed, and real number of hospitalizations (Real) and estimated by model (Model), São José do Rio Preto, Brazil, 2011-2013.
PM10 : particulate matter; NO2: nitrogen dioxide.
1. If (PM10 is Acceptable) and (Temperature is High) and (NO2 is Acceptable) and (Wind is Strong) then (Number of hospitalizations is L) (1)
2. If (PM10 is Acceptable) and (Temperature is High) and (NO2 is Acceptable) and (Wind is Weak) then (Number of hospitalizations is L) (1)
3. If (PM10 is Acceptable) and (Temperature is Low) and (NO2 is Acceptable) and (Wind is Strong) then (Number of hospitalizations is L) (1)
4. If (PM10 is Acceptable) and (Temperature is Low) and (NO2 is Acceptable) and (Wind is Weak) then (Number of hospitalizations is L) (1)
5. If (PM10 is Acceptable) and (Temperature is High) and (NO2 is Unacceptable) and (Wind is Strong) then (Number of hospitalizations is ML) (1)
6. If (PM10 is Acceptable) and (Temperature is High) and (NO2 is Unacceptable) and (Wind is Weak) then (Number of hospitalizations is M) (1)
7. If (PM10 is Acceptable) and (Temperature is Low) and (NO2 is Unacceptable) and (Wind is Strong) then (Number of hospitalizations is M) (1)
8. If (PM10 is Acceptable) and (Temperature is Low) and (NO2 is Unacceptable) and (Wind is Weak) then (Number of hospitalizations is M) (1)
9. If (PM10 is Unacceptable) and (Temperature is High) and (NO2 is Acceptable) and (Wind is Strong) then (Number of hospitalizations is ML) (1)
10. If (PM10 is Unacceptable) and (Temperature is High) and (NO2 is Acceptable) and (Wind is Weak) then (Number of hospitalizations is ML) (1)
11. If (PM10 is Unacceptable) and (Temperature is Low) and (NO2 is Acceptable) and (Wind is Strong) then (Number of hospitalizations is M) (1)
12. If (PM10 is Unacceptable) and (Temperature is Low) and (NO2 is Acceptable) and (Wind is Weak) then (Number of hospitalizations is M) (1)
13. If (PM10 is Unacceptable) and (Temperature is High) and (NO2 Unacceptable) and (Wind is Strong) then (Number of hospitalizations is M) (1)
14. If (PM10 is Unacceptable) and (Temperature is High) and (NO2 Unacceptable) and (Wind is Weak) then (Number of hospitalizations is MH) (1)
15. If (PM10 is Unacceptable) and (Temperature is Low) and (NO2 Unacceptable) and (Wind is Strong) then (Number of hospitalizations is MH) (1)
16. If (PM10 is Unacceptable) and (Temperature is Low) and (NO2 Unacceptable) and (Wind is Weak) then (Number of hospitalizations is H) (1)
Table 2 Base of rules in the fuzzy model inserted in Matlab. São José do Rio Preto, Brazil, 2011– 2013.
L: low; medium-low: ML; M: medium; MA: medium-high; H: high.
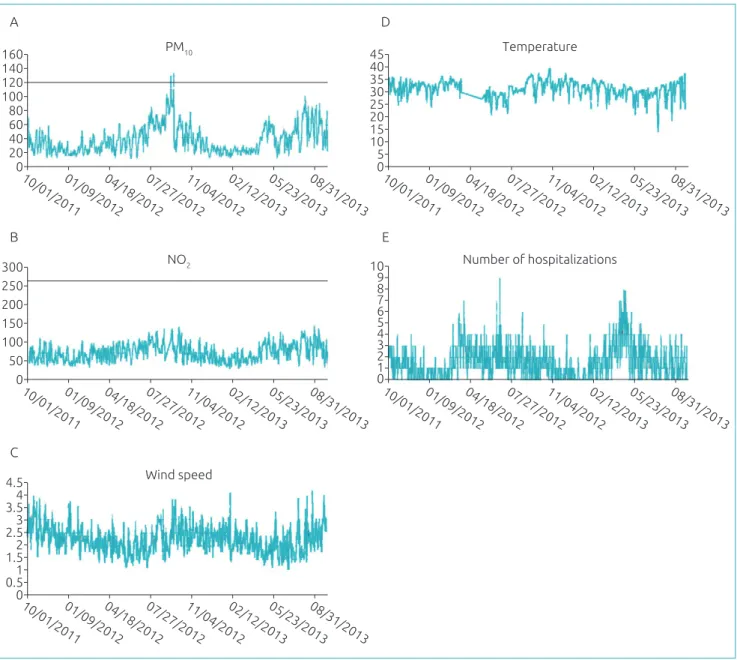
Figure 2 shows the distribution of values for PM10, NO2, temperature, wind speed and number of hospitalizations. It is possible to observe some seasonality in the concentrations of pollutants. In the period known as the burn of biomass and the lack of rains (between July and September), there is increase in pollutants, usually attributed to this burning practice to facili-tate the manual sugarcane harvesting. herefore, the increasing amount of pollutants leads to the increasing number of hospi-talizations; temperature and wind show an inverse relationship: its increase reduces the number of hospitalizations.
he Pearson correlation between the real number of hospi-talizations and the model presented signiicant results for the 0 to 3-day lag, and the best correlation was r=0.34 for the 0-day lag, followed by the r=0.29 correlation for the 1-day lag, r=0.29 for the 2-day laf, and r= 0.27 for the 3-day lag (p-value<0.05). he area values under the ROC curve for the 0 to 3-day lags are presented in Table 3, observing that the best perfor-mance was that of the 0 lag of 96.7% (95%CI 95.4–98.0) for NO2 and 90.4% (95%CI 88.1–92.6) for PM10.
DISCUSSION
his study showed the feasibility of the fuzzy logic application for the prediction of the number of hospitalizations of chil-dren for respiratory diseases, based on the concentrations of pollutants and on the values of temperature and wind speed.
In the literature, it is possible to find previous studies that approached the effects of air pollution on the hospital-izations caused by respiratory diseases in children2,3,7 using
14
Lag 0 Lag 1 Lag 2 Lag 3
PM10 0.904 (0.881 – 0.926) 0.775 (0.739 – 0.811) 0.730 (0.691 – 0.769) 0.709 (0.669 – 0.749)
NO2 0.967 (0.954 – 0.980) 0.803 (0.769 – 0.838) 0.716 (0.675 – 0.756) 0.684 (0.641 – 0.726) Table 3 ROC curve values and respective 95% conidence intervals for 0 to 3-day lags of the particulate matter
pollutants and nitrogen dioxide, São José do Rio Preto, Brazil, 2011–2013.
PM10: particulate matter; NO2: nitrogen dioxide.
Figure 2 Temporal distribution of the values of variables — (A) particulate matter (μg/m³), (B) nitrogen dioxide (μg/m³), (C) wind speed (m/s2) and (D) wind temperature (ºC) — and (E) number of hospitalizations of children, São José do Rio Preto, Brazil, 2011–2013.
160 140 120 100 60 40 20 80
0
10/01/201101/09/201204/18/201207/27/201211/04/201202/12/201305/23/201308/31/2013 10/01/201101/09/201204/18/201207/27/201211/04/201202/12/201305/23/201308/31/2013
10/01/201101/09/201204/18/201207/27/201211/04/201202/12/201305/23/201308/31/2013 10/01/201101/09/201204/18/201207/27/201211/04/201202/12/201305/23/201308/31/2013
10/01/201101/09/201204/18/201207/27/201211/04/201202/12/201305/23/201308/31/2013
PM10
300 250 200 150
50 100
0
NO2
10 9 8 7 5 4 3 2 1 6
0
Temperature
Number of hospitalizations
4.5 4 3.5 3 2 2.5 1.5 1 0.5 0
Wind speed
45 40 35 30 20 15 10 5 25
0
A D
B E
C
also studies that used the fuzzy approach to estimate the period of hospitalization caused by respiratory diseases5
and heart conditions9, besides risk of neonatal death.18,19
This study showed the number of hospitalizations of
15
REFERENCES
1. César AC, Nascimento LF, Mantovani KC, Vieira LC. Fine particulate matter estimated by mathematical model and hospitalizations for pneumonia and asthma in children. Rev Paul Pediatr. 2016;34:18-23.
2. Gouveia N, Freitas CU, Martins LC, Marcilio IO. Hospitalizações por causas respiratórias e cardiovasculares associadas à contaminação atmosférica no Município de São Paulo, Brasil. Cad Saúde Pública. 2006;22:2669-77.
3. Cesar AC, Nascimento LF, Carvalho Jr JA. Associação entre exposição ao material particulado e internações por doenças respiratórias em crianças. Rev Saúde Pública. 2013;47:1209-12.
4. Ribeiro H. Sugar caneburning in Brazil: respiratory health
efects. Rev Saúde Pública. 2008;42:370-6.
5. Nascimento LF, Rizol PM, Peneluppi AP. Estimating the
average length of hospitalization due to pneumonia: a fuzzy
approach. Braz J Med Biol Res. 2014;47:977-81.
6. Negrisoli J, Nascimento LF. Poluentes atmosféricos e internações por pneumonia em crianças. Rev Paul Pediatr. 2013;31:501-6.
7. Nascimento LF, Rizol PM, Medeiros AP, Fontoura IG. Association between concentrations of air pollutants and mean time of hospitalization due to pneumonia in children. Rev Ambient Água. 2014;8:221-7.
8. Arbex MA, Santos UP, Martins LC, Saldiva PH, Pereira LA, Braga AL. A poluição do ar e o sistema respiratório. J Bras Pneumol. 2012;38:643-55.
9. Coutinho KM, Rizol PM, Nascimento LF, Medeiros APP. Fuzzy model approach for estimating time of hospitalization due to cardiovascular diseases. Cienc Saúde Coletiva. 2015;20:2585-90.
10. Brasil. Ministério do Meio Ambiente. Resolução CONAMA 03/90 [homepage on the Internet]. 1990 [cited April 2017]. Available from: http://www.mma.gov.br/port/conama/res/ res90/res0390.html
11. São Paulo. Assembleia Legislativa do Estado de São Paulo - Decreto n.º 59.113, de 23 de abril de 2013. Estabelece novos padrões de qualidade do ar e dá providências correlatas. [homepage on the Internet]. [cited April 2017]. Available from: http://www.mma.gov.br/port/conama/processos/ C1CB3034/DECRETO_SAO_PAULO_59113_2013.pdf
12. Instituto Saúde e Sustentabilidade. Avaliação do Impacto da Poluição Atmosférica no Estado de São Paulo sob a visão da saúde [homepage on the Internet]. 2013 [cited May 2015]. Available from: http://www.saudeesustentabilidade.org.
br/site/wp-content/uploads/2013/09/Documentoinalda
pesquisapadrao_2409-FINAL-sitev1.pdf
performance in the prediction of the number of hospital-izations with lags of up to 3 days.
he mean of concentrations of pollutants in São José do Rio Preto is comparable to the mean in the city of São Paulo. In the analyzed period, the mean concentration of pollutants in the city of São Paulo was 33 µg/m3 for PM
10 and 75 µg/m 3 for
NO2. In São José do Rio Preto it was 36 µg/m3 for PM 10 and
51 µg/m³ for NO2. In this period, the concentration of PM10 was considered moderate (>50 µg/m3) in 164 days (22.4% of
the studied days), poor (>100 µg/m3) on 7 days (0.1% of the
studied days), and crossed the limit for 2 dayss (>120 µg/m3).
Regarding the mean concentration of the pollutant NO2, it remained within the values accepted by the current law in the entire studied period.13,20
he sensitivity of the model built for the pollutants PM10 and NO2, assessed by the ROC curve, presented good value. Accuracy was signiicant for the 0-day lag with NO2, with an area under the 96.7% curve, sensitivity of about 92.0%, and approximate speciicity of 90.0%.
It is important to consider that the number of hospital-izations obtained from data coming from Datasus14 does not
include hospitalizations by private insurance plans and other health operators, outpatient treatments and errors in address (which is common in central cities, in which individuals claim
to live in diferent city). However, these data are used in several studies, and are suicient for the model proposed.
One limitation of this study is that the concentration of pollutants measured may not represent the entire territory of São José do Rio Preto. For this study, however, the concentra-tion was considered homogeneous. Other factors, such as the predisposition to respiratory diseases and pollution in closed environments were not considered.
On the other hand, this study presents a low-cost and fea-sible model, which can be used in any town that provides data (pollutants and environmental factors) using applications for tablets or smartphones, for example. It can also be used to help the public health management, providing health teams and public policies managers with an estimation of the expected number of hospitalizations.
Funding
Oice of Graduate Studies at Universidade Estadual Paulista «Júlio de Mesquita Filho» (Unesp) – Proex, Scholarship of Academic Support and Extension I, Campus de Guaratinguetá – SP.
Conflict of interests
16
13. São Paulo. Secretaria do Meio Ambiente. Companhia Ambiental do Estado de São Paulo. Qualidade do ar no estado de São Paulo 2015. São Paulo: CETESB; 2016.
14. Brasil. Ministério da Saúde. DATASUS. Portal da Saúde SUS [homepage on the Internet]. [cited June 2015]. Available from: http://www2.datasus.gov.br/DATASUS/index.php
15. Tanaka K. An Introduction to Fuzzy Logic for Practical Applications. Berlim: Springer; 1996.
16. São Paulo. Secretaria de Planejamento e Desenvolvimento
Regional. Caracterização Socioeconômica das Regiões SP –
região Administrativa de São José do Rio Preto. São José do Rio Preto; 2012.
17. Brasil. Ministério do Planejamento, Orçamento e Gestão.
Instituto Brasileiro de Geograia e Estatística [homepage on
the Internet]. [cited October 2015]. Available from: http:// www.cidades.ibge.gov.br
18. Chaves LE, Nascimento LF. Estimando o desfecho no recém-nascido usando lógica fuzzy. Rev Paul Pediatr. 2014;32:164-70.
19. Nascimento LF, Rizol PM, Abiuzi LB. Establishing the risk of neonatal mortality using a fuzzy predictive model. Cad Saúde Pública. 2009;25:2043-52.
20. São Paulo. Secretaria do Meio Ambiente. Companhia Ambiental do Estado de São Paulo. Sistema Qualar [homepage on the Internet] [cited May 2015]. Available from: http:// qualar.cetesb.sp.gov.br/qualar/home.do