1. Salgado de Oliveira University – Campus of Juiz de Fora, Estácio de Sá University – Campus of Juiz de Fora, M S in Human M otricity Sciences/ PROCIM H (UCB-RJ), Human M otricity Biosciences Laboratory (LABIM H/ UCB-RJ).
2. Federal University of Juiz de Fora, Sports and Physical Education School, M otor Evaluation Laboratory, Campus of M artelos, Juiz de Fora – M G. 3. Estácio de Sá University – Campus of Juiz de Fora.
4. Federal University of Rio de Janeiro, FUNADESP M S fellow ship in Hu-man M otricity Sciences/PROCIM H (UCB-RJ), HuHu-man M otricity Bio-sciences Laboratory (LABIM H/UCB-RJ).
Received in 13/3/05. 2nd version received in 30/3/05. Approved in 20/4/05. Correspondence to: Vinicius Oliveira Damasceno, Rua Quintino Bocaíu-va, 655/403, Jardim Glória – 36015-010 – Juiz de Fora, M G. E-mail: vinicius [email protected]
Ideal physical type and body image
satisfaction of regular w alkers
Vinicius Oliveira Damasceno1,Jorge Roberto Perrout Lima2, Jeferson M acedo Vianna2,
Viviane Ribeiro Ávila Vianna3 and Jefferson Silva Novaes4
ORIGINAL ARTICLE
Key w ords: Body image. Body mass index. Fat percentage. ENGLISH VERSION
ABSTRACT
The objective of the present study w as to quantify the ideal phys-ical type and to verify the body image satisfaction level of regular w alkers. One hundred and eighty six individuals participated in this study as follow s: 87 w omen (age = 28.70 ± 12.6 years, stature = 161.6 ± 6.2 cm, body mass = 58.9 ± 12.0 kg, and fat = 25.7 ± 7.8 F% ), and 98 men (age = 27.9 ± 12.9 years, stature = 177.2 ± 6.9 cm, body mass = 75.0 ± 12.3 kg, and fat = 13.3 ± 6.1 F% ). The individuals w ere asked to indicate w hich profile corresponded to his/her body and w hich profile they w anted to reach. Only 24% of w omen are satisfied. Profile 3 w as pointed as ideal to be reached by 55% of w omen (profile 2 = 18% ; and profile 4 = 21% ). Profile 3, according to results of this study, corresponded to F% of 20.5 ±
0.9% (EPM ) and to M BI of 20.0 ± 0.3 kg/m2 (EPM ). In relation to
men, only 18% are satisfied. Profile 4 w as pointed as ideal by 47% of men (profile 3 = 23% ; and profile 5 = 19% ). Profile 4
corre-sponds to F% of 9.8 ± 1.4% (EPM ) and to BM I of 23.1 ± 0.4 kg/m2
(EPM ). There is an ideal physical type for both genders. No differ-ence w ith body image satisfaction degree betw een genders w as verified.
INTRODUCTION
M edia, family circle and friends condition individuals to exercise themselves, to take care of their bodies, leading them to desires,
habits, cares and dissatisfaction w ith their body visual appearance(1).
Body image is a multidimensional construction that w idely describes the inner representations of body structure and physical
appear-ance in relation to ourselves and to others(2). The body image
for-mation process may be influenced by gender, age and media as w ell as by the relations of body w ith cognitive processes such as beliefs, values and attitudes w ithin a culture(1,3-5).
Some authors admit the existence of a strong cultural tendency in considering leanness as an ideal situation of social acceptance
for w omen(6-10). There are also strong correlations betw een social
pressure of being thin and body dissatisfaction among young adult
w omen(6,11). According to the female leanness ideal tendency,
Vo-racek and Fisher(12) presented the modifications on the
anthropo-metrical standards of w omen w ho w ere photographed in the Play-boy magazine during the last decades. Through descriptive study,
a tendency of reduction on the body mass index (M BI) values and of increase on the w aist/hip relation (WHI) w as observed, demon-strating a body linearity tendency. On the other hand, among men,
a stronger and larger body is considered as the ideal profile(13-17).
Reinforcing this statement, Cohane and Pope Jr.(9) mention the
study of M cCreary and Sasse (2000), performed w ith 96 young individuals w ith average age of 18 years, w ho w anted to be heavi-er and strongheavi-er in relation to their actual bodies. In both cases, men and w omen aimed their attitudes in relation to their bodies tow ards fulfilling cultural pressures of society in w hich they be-long to(19).
The tireless search for a better physical appearance of those w ho practice regular physical activities is a sociocultural phenome-non many times more significant than the ow n economic, affec-tive or professional satisfaction(20). The dissatisfaction w ith the ow n
body, or better, w ith the image one has about it, is maybe one of the main reasons people involve themselves into physical activity
programs(21-24). It is possible that the body image satisfaction
de-gree w ould influence the w ay how young adults perceive them-selves in terms of the relation betw een body mass, fat percentage (F% ) and stature. The body dissatisfaction is strongly related to the exposition of beautiful bodies by media and this fact has deter-mined a compulsion for searching for the ideal anatomy in the last decades(25,26).
Although there are adequate BM I and F% values for the mainte-nance of a good health condition, the physical type idealized by
individuals is culturally determined(24,27,29), and it seems that there
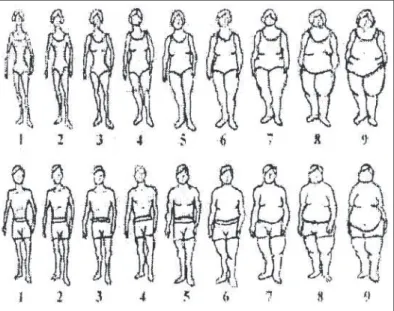
is an ideal physical type that individuals w ho practice regular phys-ical activity search to reach. Thus, the objectives of this w ork w ere,
using the set of profiles of Stunkard et al.(29) (figure 1), to quantify
the ideal physical type and to verify the body image satisfaction level of regular w alkers.
M ETHOD
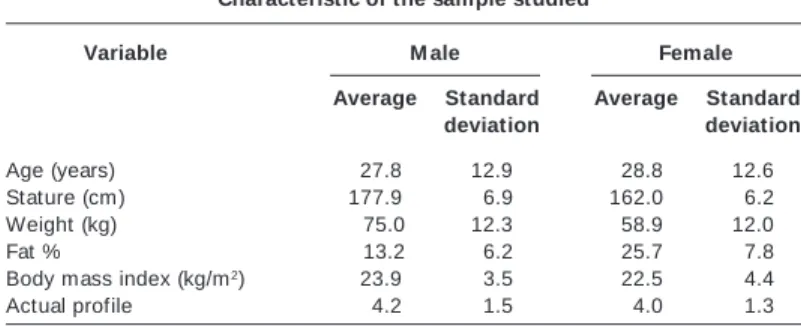
Subjects – The sample w as composed of 186 individuals (87
w omen and 98 men) w ho practiced regular w alking in the Campus of the Federal University of Juiz de Fora, w hose characteristics are described in table 1. In order to perform the measurements, an evaluation room w as adapted next to the area used for the physi-cal activity practice. The individuals invited to participate in this research w ere informed about the objectives and signed the con-sent term for researches involving human beings, according to Guidelines and Regulation Norms of Researches Involving Human
Beings (Resolution 196 of October 10th, 1996) of the Health
Na-tional Council. The research w as previously approved by the Eth-ics Research Committee of the Federal University of Juiz de Fora. As w ay to offer return to the participants of this research, a re-port containing BM I and F% w ith interpretation and explanation of results and their relation w ith health risk factors w as delivered to them shortly after data collection.
Anthropometrical measurements – The body mass
measure-ment w as performed, using a digital scale label Filizola® properly
calibrated and w ith the Inmetro seal. Follow ing, the stature mea-surement w as performed by means of a stadiometer w ith accura-cy of 1 mm fixed to the scale. The measurement of the follow ing skinfolds w ere performed: thorax/pectoral; triceps, suprailliac,
ab-domen and thigh. A Lange® compass (USA) w as used.
Body image measurements – In order to verify the actual and
ideal body image, the scale proposed by Stunkard et al.(29) (figure
1) w as used. The set of profiles w as show n to individuals and the follow ing questions w ere asked: Which profile best represents your actual physical appearance? Which profile w ould you like to have? In order to verify body dissatisfaction, the difference betw een the actual profile (AP) and the ideal profile (IP) indicated by the individ-ual w as used. The appraiser w as free of opinion in the selection of profiles.
Calculations and statistic treatment – For the BM I
calcula-tion, the equation w eight in kilograms divided by stature in meters, raised to the second pow er w as used. The w aist/hip relation w as obtained through dividing the w aist circumference by the hip cir-cumference. The body density w as estimated through the equa-tion of Jackson and Pollock(30) and Jackson et al.(31), and, on
conver-sion to F% , the equation of Siri(32) w as used. The data w ere
submitted to descriptive statistics. The BM I and F% data w ere grouped by AP. For the test of difference hypothesis betw een av-erages of F% and BM I betw een groups, the analysis of variance w ith one factor w as performed, according to the Scheffé test (p <
0.05). For the study of the association betw een AP and the F% and BM I values, the Pearson correlation w as performed. The dif-ferences betw een men and w omen dissatisfaction levels w as test-ed w ith the chi-squartest-ed test (p < 0.05). The program Statistica® 6.0
for Window s® w as used for calculation purposes.
RESULTS
Table 1 describes the average and the standard deviation of the sample’s characteristics. M ale BM I and F% w ere presented w ith-in normality range, accordith-ing to classification of the World Health
Organization(33) for BM I and Jackson and Pollock(30) and Jackson et
al.(31) for F% . For w omen, the average values of BM I w ere
present-ed w ithin normality range and the F% w as presentpresent-ed a little above normality range.
TABLE 1
Characteristic of the sample studied
Variable M ale Female
Average Standard Average Standard
deviation deviation
Age (years) 027.8 12.9 028.8 12.6
Stature (cm) 177.9 06.9 162.0 06.2
Weight (kg) 075.0 12.3 058.9 12.0
Fat % 013.2 06.2 025.7 07.8
Body mass index (kg/m2) 023.9 03.5 022.5 04.4
Actual profile 004.2 01.5 004.0 01.3
TABLE 2
Fat percentage and body mass index values by actual profile of both men and w omen (average ± standard deviation)
Profile the individual identifies himself w ith
1 2 3 4 5 6 7 8
Female N 1 9 17 35 13 9 3
F% 17.1 ± 0.0 19.6 ± 1.4 20.5 ± 1.6 25.5 ± 3.9 26.4 ± 3.1 35.6 ± 2.4 46.5 ± 2.6 BM I 15.8 ± 0.0 19.1 ± 1.2 20.0 ± 1.3 22.0 ± 2.9 23.3 ± 4.0 29.0 ± 4.7 34.7 ± 3.4
M ale N 1 12 23 18 30 8 4 2
F% 03.5 ± 0.0 09.8 ± 4.2 10.4 ± 3.1 09.8 ± 4.8 16.1 ± 5.0 17.6 ± 7.7 20.8 ± 2.1 28.1 ± 0.8 BM I 18.7 ± 0.0 20.5 ± 1.8 21.7 ± 1.6 23.1 ± 1.6 24.7 ± 2.1 29.2 ± 3.4 29.3 ± 1.2 34.0 ± 0.6
Table 3 indicates the AP for men and w omen and the difference betw een AP and IP. One observes that the IP for male individuals w ho presented AP 1, 2, 3 and 5 is the profile 4, in other w ords, individuals w ho identified themselves w ith profiles low er than 4 w anted to climb up one or tw o positions in relation to the AP. Indi-viduals w ho identified their profiles as higher than 5 w anted to step dow n one or tw o positions.
Women did not seem to w ant to climb positions in relation to the choice for the IP. Women w ho identified themselves w ith
pro-files 2 and 3 did not w ant to change profile. For those w ho identi-fied themselves w ith profiles higher than 3, a tendency to step dow n tw o positions w as observed. For example, w omen w ho iden-tified themselves w ith profile 6 considered profile 4 as ideal.
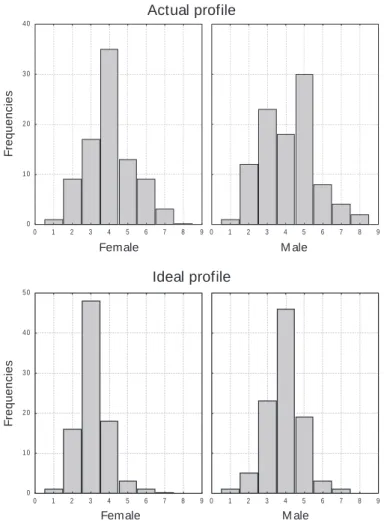
Figure 3 presents the F% and AP of men and w omen. In relation to w omen, no significant differences betw een F% of profiles from 2 to 5 w ere observed. Only profiles 6 and 7 w ere significantly dif-ferent from the other profiles in relation to F% . In relation to men, profiles 2, 3 and 4 presented no significant differences betw een Table 2 presents the average values of F% and BM I by AP. In figure 2, the histograms demonstrate the sample distribution in relation to male and female AP and IP. One observes through the tendency identified by mode, that most w omen selected profile 4 as the AP and most men selected profile 5. With regard to the IP, the histogram indicates the tendency of w omen to select profile 3 (n = 49 or 55% ) and men to select profile 4 (n = 46 or 47% ). Profile 3 w as indicated as ideal to be reached by 55% of w omen (profile 2 = 18% ; and 4 = 21% ). Profile 3, according to results from this study, corresponds to F% of 20.5 ± 0.9% (EPM ) and to BM I of
20.0 ± 0.3 kg/m2 (EPM ). In relation to men, only 18% are satisfied
w ith their profiles. Profile 4 w as indicated as the ideal by 47% of men (profile 3 = 23% ; and 5 = 19 % ). Profile 4 corresponds to F%
of 9.8 ± 1.4% (EPM ) to BM I of 23.1 ± 0.4 kg/m2 (EPM ). No
Fig. 2 – Sample distribution in relation to the choice of actual and ideal
profiles of men and w omen
Silhueta atual
Silhueta ideal
Freqüencia
0 1 0 2 0 3 0 4 0 5 0
0 1 2 3 4 5 6 7 8 9 0 1 2 3 4 5 6 7 8 9
Freqüências
0 1 0 2 0 3 0 4 0
0 1 2 3 4 5 6 7 8 9 0 1 2 3 4 5 6 7 8 9
Ideal profile Actual profile
F
re
q
u
e
n
c
ie
s
F
re
q
u
e
n
c
ie
s
Female M ale
Female M ale
TABLE 3
Ideal profile and ideal-actual difference
Profile
Actual M en Women
profile
Ideal Ideal-Actual Ideal Ideal-Actual
1
2 4.0 –2.0 2.0 –0.0
3 4.0 –1.0 3.0 –0.0
4 4.0 –0.0 3.0 –1.0
5 4.0 –1.0 3.0 –2.0
6 4.5 –1.5 4.0 –2.0
7 5.5 –1.5 5.0 –2.0
8 6.0 –2.0
All 4.0 –0.0 3.0 –1.0
each other as w ell as profiles 5, 6, 7 and 8. Only betw een profiles 2, 3 and 4 and profiles 5, 6, 7 and 8, significant differences in rela-tion to F% w ere observed.
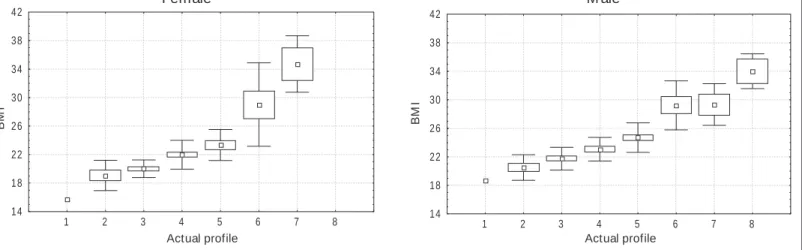
In figure 4, the BM I values in relation to AP of both genders w ere plotted. For the female group, profiles 2, 3 and 4 w ere not statistically different from each other. Profile 5 is significantly dif-ferent from profiles 2, 6 and 7, but not significantly difdif-ferent from profiles 3 and 4. Profiles 6 and 7 are significantly different from the other profiles (p < 0.05). For male group, profiles 2, 3 and 4 pre-sented no significant differences betw een each other, and the same occurred betw een profiles 5, 6, 7 and 8. It seems to exist tw o set of profiles: upper and low er profiles. Significant differences w ere found betw een these tw o groups of profiles in relation to the BM I values.
0 10 20 30 40 50 60
1 2 3 4 5 6 7 8
0 6 12 18 24 30 36 42 48 54 60
1 2 3 4 5 6 7 8
Female
M ale
Fig. 3 – Fat percentage by actual profile of men and w omen (average,
stan-dard deviation and 1.96 stanstan-dard deviation)
F
a
t
p
e
rc
e
n
ta
g
e
Actual profile
Actual profile
F
a
t
p
e
rc
e
n
ta
g
e
BM I and F% values w ere plotted in relation to AP for w omen (figure 5) and men (figure 6). For w omen, significant correlations w ere observed for BM I and F% , r = 0.75 and r = 0.70 respectively. For men, as for w omen, significant correlations w ere observed for BM I and F% , r = 0.79 and r = 0.60 respectively.
DISCUSSION
The objective of this study w as to identify the ideal physical type and dissatisfaction w ith body image of a group of regular w alkers. It w as considered that, in the morphological evaluations performed by the physical activity programs, the adoption of the BM I and F%
values recommended for good health conditions (25 kg/m2 and 15%
for men and 25 kg/m2 and 25% for w omen) could lead to
disagree-ment w ith bodies that our culture considers as ideal. The set of
profiles proposed by Stunkard et al.(29) w as used as instrument.
In relation to the instrument used, several limitations can be mentioned: profiles are tw o-dimensional and therefore they do not allow the representation of the individual as a w hole, the distribu-tion of his subcutaneous fat mass and other anthropometrical
as-pects relevant for the body image formation(34). Other limitation
Silhueta Atual 1 6
2 0 2 4 2 8 3 2 3 6 4 0
1 2 3 4 5 6 7 8 9
Silhueta Atual
2 6 10 14 18 22 26 30 34
1 2 3 4 5 6 7 8 9
BM I = 15.730 + 1.9548 * AP r = 0.79
F% = 2.4442 + 2.6005 * AP r = 0.61
Fig. 6 – Plotting of the body mass index and fat percentage in relation to male actual profile
F
a
t
p
e
rc
e
n
ta
g
e
Actual profile Actual profile
B
M
I
Silhueta Atual
14 20 26 32 38 44
1 2 3 4 5 6 7 8
Silhueta Atual
10 15 20 25 30 35 40 45 50 55
1,5 2,5 3,5 4,5 5,5 6,5 7,5
BM I = 11.916 + 2.6514 * AP r= 0.75
F% = 7.7195 + 4.4560 * AP r = 0.70
Fig. 5 – Plotting of the body mass index and fat percentage in relation to female actual profile
F
a
t
p
e
rc
e
n
ta
g
e
Actual profile Actual profile
B
M
I
14 18 22 26 30 34 38 42
1 2 3 4 5 6 7 8
14 18 22 26 30 34 38 42
1 2 3 4 5 6 7 8
Female M ale
Fig. 4 – Body mass index by actual profile of men and w omen (average, standard deviation and 1.96 standard deviation)
Actual profile Actual profile
B
M
I
B
M
I
Despite the limitations presented, the strong correlations of M BI and F% w ith AP (r = 0.75 and r = 0.70, for w omen and r = 0.79 and r = 0.61 for men) demonstrate that, for the sample studied, the set of profiles w as effective w ith regard to the AP identification. The group studied presented good perception of their body dimensions. Thus, the use of the average BM I and F% values grouped by AP is valid in the characterization of the ideal physical type.
The individuals w ho initiated a physical activity program, in most cases and somehow, search to modify the shape and proportions of their bodies. The amount of body fat is important factor for the health maintenance and in our culture, the low amount of body fat
became a factor of undeniable aesthetic value(20,42). This
be-sides the opinion of the ow n family lead people to present high
levels of dissatisfaction w ith the body appearance(1,42). Such
dis-satisfaction, in extreme cases, may lead to the adoption of self-destructive behaviors, such as the abuse of diets that may end up in bulimia and anorexia nervosa(43-46).
The BM I and F% determination for male and female profiles (table 4) allow ed verifying the ideal physical type desired by the sample studied. For w omen, the profile 3 w as considered as ideal, w hich corresponds to values of F% and BM I of 20.5 of F% and
20.0 kg/m2, respectively. Through values of BM I and F% , one
ob-serves that w omen w ould rather w ant thinner bodies w ith low er body volume than profiles recommended for good health
condi-tions. Corroborating these findings, Cachelin et al.(47), also using
the profiles of Stunkard(29), found that w omen tend to select smaller
profiles than the actual ones. In literature, one can also find several studies reporting that the female ideal body standard or physical
type is associated w ith low body w eight and low fat percentage(6,7,
9,10,12,13,48,49).
M en, in turn, adopted profile 4 as ideal, w hose values of F% and
BM I are 9.8 F% and 23.1 kg/m2, respectively. One observes the
male tendency of searching for a body w ith higher volume and low er amount of body fat. It w as observed that the men w ho iden-tified themselves w ith profile below 4 w anted to increase profile, reflecting the desire of presenting higher amount of body mass.
These results corroborate findings of Pope Jr. et al.(15),w ho
per-formed an experiment to identify the ideal physical type in relation to body fat and muscular mass of men in three different countries, Austria, the United States and France, and found a consensual de-sire of reducing fat percentage and increasing muscular mass. American and Austrian men considered 10.0% of fat percentage as ideal, w hile French men desired fat percentage around 13% . Concerning the muscular mass, the men of the three countries had a desire of increase around 14 kg.
In relation to body dissatisfaction, w omen presented dissatis-faction level similar to men, 76% and 82% , respectively. These
findings are not in agreement w ith results found by Lokken et al.(50),
Araújo and Araújo(51), Cachelin et al.(47) and Pingitore et al.(52), w ho
verified higher body dissatisfaction level among w omen w hen
com-pared to men. Loland(24) investigated 1,555 Norw egian males and
females from different age ranges and physical fitness and veri-fied that men are significantly more satisveri-fied than w omen, regard-less age and physical fitness levels.
The body image dissatisfaction leads people to search for
phys-ical activity programs(21-24,53). Women search for the leanness ideal,
and men, on the other hand, search for being stronger and larger. A w ell-elaborated physical activity program m ay reduce body w eight, as desired by w omen, or increase muscular mass, as de-sired by men. In fact, the practice of physical activities may lead individuals to reach body they consider as ideal. There are studies that report association betw een physical activity and high levels of body satisfaction(23,53,55). How ever, the practice of physical activity,
in some cases, may result in negative outcomes causing w omen
to be concerned w ith w eight(56,57) and men to present the
phenom-enon know n as muscle dysmorphia or reverse anorexia(58,59). Health
promotion researchers should include the concern w ith possible negative effects of the practice of physical activity in their reports.
CONCLUSION
One may conclude that men w ant to have low fat percentage,
stronger and larger bodies, w ith values of 9.8 F% and 23.1 kg/m2
of BM I, and w omen consider as ideal a leaner and thinner body,
w ith values of 20.5 F% and 20.0 kg/m2 of body mass index. Once
only a few individuals present bodies w ith such dimensions, most individuals studied are dissatisfied w ith their body image regard-less gender, but no statistical differences betw een genders w ere observed.
All the authors declared there is not any potential conflict of inter-ests regarding this article.
REFERENCES
1. Blow ers LC, Loxton NJ, Grady-Flesser M G, Occhipinti S, Daw e S. The relation-ship betw een sociocultural pressure to be thin and body dissatisfaction in pre-adolescent girls. Eating Behaviors 2003;4:229-44.
2. Cash T, Pruzinsky T. Body Images. New York: Guilford Press, 1990.
3. Fisher S. The evolution of psychological concepts about the body. In: Cash T, Pruzinsky T, editors. Body images. New York: Guilford Press, 1990;3-20.
4. Ricciardelli LA, M cCabe M P, Banfield S. Body image and body change methods in adolescent boys. Role of parents, friends, and the media. J Psychosom Res 2000; 49:189-97.
5. Volkw ein K, M cConatha JT. Cultural contours of the body – The impact of age and fitness. In: Lidor R, Bar-Eli M , editors. Innovations in sport psychology: Link-ing theory and practice. Tel-Aviv: ISSP, 1997;744-6.
6. Cattarin J, Williams R, Thomas CM , Thompson KJ. Body image, mood, and tele-vised images of attractiveness: The role of social comparison. Br J Clin Psychol 2000;19:220-39.
7. Garner DM , Garfinknel P, Schw artz D, Thompson M . The great American shape-up. Psychol Rep 1980;47:483-91.
8. Harrison K, Cantor J. The relationship betw een media consumption and eating disorders. J Commun Disord 1997;47:40-67.
9. Parham ES. Promoting body size acceptance in w eight management counsel-ing. J Am Diet Assoc 1999;99:920-25.
10. Smolak L, Levine M P, Schermer F. Parental input and w eight concerns among elementary school children. Int J Eat Disord 1999;25:263-71.
11. Thompson JK, Coovert M D, Stormer S. Body image, social comparison, and eating disturbance: a covariance structure modeling investigation. Int J Eat Dis-ord 1999;26:43-51.
12. Voracek M , Fisher M L. Shapely centrefolds? Temporal change in body measures: trend analysis. BM J 2002;325:1447-8.
13. Cash T, Winstead B, Janda L. Cultural expectations thinness in w omen. Psycho-logic Today 1986;4:30-37.
14. Jacobi L, Cash TF. In pursuit of the perfect appearance. Journal Applied Social Psychology 1994;24:379-69.
15. Pope Jr HG, Gruber AJ, M angw eth B, Boreau B, DeCol C, Jouvent R, et al. Body image perception among men in three countries. Am J Psychiatry 2000;157: 1297-301.
16. Strauss RS. Self-reported w eight status and dieting in a cross-sectional sample of young adolescents. Arch Pediatr Adolesc M ed 1999;153:741-7.
17. Thompson JK, Heinberg LJ, Altabe M , Tantleff-Dunn S. Exacting beauty: theory assessment and treatment of body image disturbance. American Psychological Association. Washington, DC, 1999.
18. Cohane G, Pope Jr HG. Body image in boys: a review of the literature. Int J Eat Disord 2001;29:373-9.
19. Sabino C. Os marombeiros: construção social de corpo e gênero em academias de musculação [Dissertação]. Rio de Janeiro UFRJ, Faculdade de Filosofia e Ciências Sociais, 2000.
20. Novaes JS. Estética – O corpo na Academia. Rio de Janeiro: Ed. Shape, 2001. 21. Fox KR, Corbin CB. The physical self-perception profile: development and
pre-liminary validation. Journal Sport Exercise Psychological 1989;11:408. 22. Hart EA. Avaliando a imagem corporal. In: M edidas e avaliação em educação
física e esportes de Barrow & M cGee. São Paulo: Ed. M anole, 2003;457-88. 23. Harter S. Competence as a dimension of self-evaluation: tow ard a
comprehen-sive model of self-w orth. In: Leahy R, editor. The development of the self. New York: Academic Press, 1985.
24. Loland NW. The aging body: attitudes tow ard bodily appearance among physi-cally active and inactive w omen and men of different ages. Journal of Aging and Physical Activity 2000;8:197-213.
25. Labre M P. Adolescent boys and the muscular male body ideal. J Adolesc Health 2001;30:233-42.
26. Nagel K, Jones K. Predisposition factors in anorexia nervosa. Adolescence 1992; 27:381-6.
27. Kunkel M . Body w eight perceptions, body mass index, and dieting practices of South Carolina adults. J Am Diet Assoc 1987;87:1217-8.
29. Stunkard AJ, Sorenson T, Schlusinger F. Use of the Danish Adoption Register for the study of obesity and thinness. In: Kety SS, Row land LP, Sidman RL, M at-thysse SW, editors. The genetics of neurological and psychiatric disorders. New York: Raven, 1983;115-20.
30. Jackson AS, Pollock M L. Generalized equations for predicting body density of men. Br J Nutr 1978;40:497-504.
31. Jackson AS, Pollock M L, Ward A. Generalized equations for predicting body density of w omen. M ed Sci Sports Exerc 1980;12:175-82.
32. Siri WE. Body composition from fluid spaces and density: analysis of methods 1961. Nutrition 1993;9:480-91.
33. World Health Organization, Obesity: preventing and managing the global epi-demic. World Health Organization, Geneva, 1998.
34. Kay S. The psychological and anthropometric in body image. In: Norton K, Olds T, editors. Anthropometrica. Sydney, Austrália: University of New South Wales Press, 1996;217-38.
35. Benedikt R, Werthein EH, Love A. Eating attitudes and w eight-loss attempts in female adolescents and their mothers. J Adolesc Health 1998;27:43-57.
36. Botta R. Television images and adolescent girls’ body image disturbance. J Com-mun Disord 1999;49:22-41.
37. Dunkley TL, Wertheim EH, Paxton, SJ. Examination of a model of multiple so-ciocultural influences on adolescent girls’ body dissatisfaction and dietary re-straint. Adolescence 2001;36:265-79.
38. Field AE, Camargo JR, Taylor CB, Berkey CS, Colditz GA. Relation of peer and media influences to the development of purging behaviors among preadoles-cent and adolespreadoles-cent girls. Arch Pediatr Adolesc M ed 1999;153:1184-89.
39. M orant H. BM A demands more responsible media attitude on body image. BM J 2000;320:1495.
40. O’dea JA, Abraham S. Improving the body image, eating attitudes, and behav-iors of young male and female adolescents: a new educational approach that focuses on self-esteem. Int J Eat Disord 2000;28:43-57.
41. Novaes JS. Ginástica de academia do Rio de Janeiro [Dissertação]. Rio de Janei-ro UFRJ, Faculdade de Educação Física, 1999.
42. M cLaren L, Gauvin L. Neighbourhood level versus individual level correlates of w omen’s body dissatisfaction: tow ard a multilevel understanding of the role of affluence. J Epidemiol Community Health 2002;56:193-99.
43. Delvin M J, Zhu AJ. Body image in the balance (review ). JAM A 2001;287:2159.
44. Friedman M , Wilfley D, Pike KM , Striegel-M oore RH, Rodin J. The relationship betw een w eight and psychological functioning among adolescent girls. Obes Res 1995;3:57-62.
45. Garner DM , Olmsted M P, Polivy J, Garfinkel PE. Comparison betw een w eight-preoccupied w omen and anorexia nervosa. Psychosom M ed 1984;46:255-66. 46. Nunes M A, Apolinário JC, Abuchaim ALG, Coutinho W. Transtornos alimentares
e obesidade. Porto Alegre: Editora Artmed, 1998.
47. Cachelin FM , Rebeck RM , Chung GH, Pelayo E. Does ethnicity influence body-size preference? A comparison of body image and body body-size. Obes Res 2002; 10:158-66.
48. Parnell K, Sargent R, Thompson SH, Duhe SF, Valois RF, Kemper RC. Black and w hite adolescent females’ perceptions of ideal body size. J Sch Health 1999; 66:112-8.
49. Tovée M J, Reinhardt S, Emery JL, Cornelissen PL. Optimum body-mass index and maximum sexual attractiveness. Lancet 1998;352:548.
50. Lokken K, Ferraro FR, Kirchner T, Bow ling M . Gender differences in body size dissatisfaction among individuals w ith low, medium, or high levels of body fo-cus. J Gen Psychol 2003;130:305-10.
51. Araújo DSM S, Araújo CGS. Autopercepção e insatisfação com peso corporal. Arq Bras Cardiol 2003; 80:235-42.
52. Pingitore R, Spring B, Garfield D. Gender differences in body satisfaction. Obes Res 1997;5:402-9.
53. Loland NW. Body image and physical activity: a survey among Norw egian men and w omen. International Journal Sport Psychological 1998;29:339-65.
54. Loland NW. Body image, sports and exercise. Tidsskr Nor Laegeforen 2000; 120:2919-21.
55. Williams P, Cash TF. Effects of a circuit w eight training program on the body images of college students. Int J Eat Disord 2001;30:75-82.
56. Davis C, Fox J. Excessive exercise and w eight preoccupation in w omen Addict Behav 1993;18:201-11.
57. Zabinski M , Calfas K, Gehrman CA, Wilfley DE, Sallis JF. Effects of a physical activity intervention on body image in university seniors: project GRAD. Ann Behav M ed 2001;23:247-52.
58. Leit RA, Gray JJ, Pope Jr HG. The media´s representation of the ideal male body: a cause for muscle dysmorphia? Int J Eat Disord 2002;31:334-38. 59. Pope Jr HG, Gruber AJ, Choi P, Olivardia R, Phillips KA. M uscle dysmorphia: an